We write our debugger for Windows [part 2]
Be sure to read the first part if you have not done it yet. Otherwise it will be difficult to understand the second part.
Foreword
This article is a continuation of the previous part of “Writing Your Debugger for Windows”. It is very important that you read and understand it. Without a complete understanding of what is written in the first part, you will not be able to understand this article and evaluate all the material in its entirety.
The only thing that remained unmentioned in the previous article is that our debugger can only debug the machine code. You can’t start debugging managed code. Maybe, if there is a fourth part of the article, I will also consider debugging and managed code in it.
I would like to show you some important aspects of debugging. They will include showing the source code and the callstack, setting breakpoints, entering the executable function (step into), attaching the debugger to the process, setting the default system debugger and some others.
Task list:
- Start debugging with main () function
- Getting the process start address
- Breakpoint Settings on the Start Address
- Breakpoint Stop, Cancellation Instructions
- Stop debugging and waiting for user actions
- Continue debugging on user command
- CDebuggerCore - debug interface class
- Getting source codes and line numbers
- Setting custom breakpoints
- Code tracing (step-in, step-out, step-over)
- Conditional breakpoints
- Debugging a running process
- Disconnect from process, shutdown or wait?
- Debugging a Fallen Process
- Manually connecting the debugger
')
Let's start debugging!
So, what do you do when you want to debug your program? Well, for the most part, we press F5 to start debugging applications and the Visual Studio debugger will stop the program execution in those places where you set breakpoints (including conditional ones). Clicking the “Repeat” button in the “Debug Assertion Failed” dialog box also opens the source code in the right place and stops the execution. Calling DebugBreak or _asm int 3 instructions do the same. And this is a small part of the “how to debug an application” options.
Rarely or from time to time, we start debugging from the very beginning by pressing F11 (step-into), and VS starts debugging with the functions main / wmain or WinMain / wWinMain (or with the _t prefix). Well, this is the logical starting address of the process being debugged. I call it “logical” because it is not a real starting address, which is also known as the entry point of the module. For console applications, this is the mainCRTStartup function, which then calls the main function and the Visual Studio debugger starts with main. Dll libraries can also have their own entry point. If you want to know a little more, read the information on the / ENTRY flag.
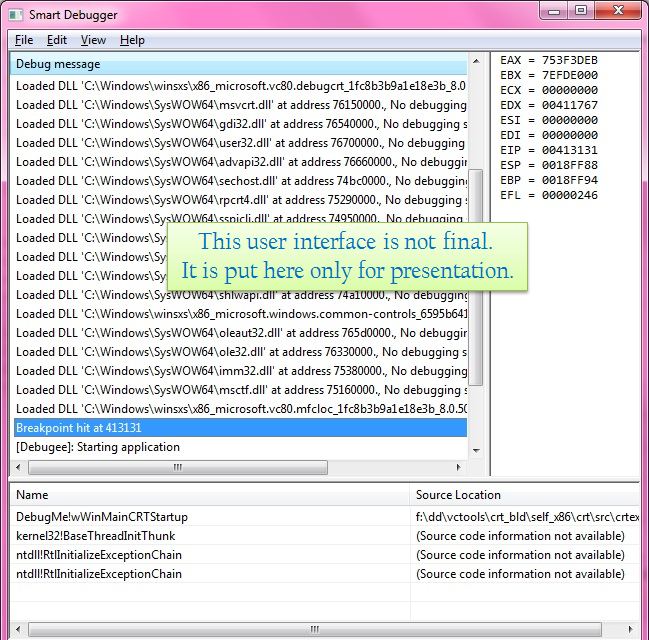
All this means that we must pause the program at the entry point of the application and allow the developer to continue debugging. Yes, I said “suspend” the execution of the program at the input point of the module — the process is already running, and if we do not suspend it, it will end somewhere. The call stack (image below) will appear as soon as you press F11.

What do we need to do to pause the process at the entry point?
In a nutshell:
- Get process start address
- Change the instruction at this address - for example, replace it with a breakpoint instruction (_asm int 3)
- Process the program stop as soon as the execution reaches this breakpoint, restore the original instruction
- Stop execution, show call stack, registers and source code, if possible
- Continue execution upon user request.
Just five points! But the task, in fact, not easy.
Getting the process start address
The starting address of the entry point and logical * entry point (function main / WinMain) - these are jungle! Before telling you in a few words about these concepts, let me give you a visual idea of this. But the first thing you need to understand: the first instruction for this address is the starting point of the program and the debugger only works with this address.
* [This term is coined by me and only relates to this article!]
This is how the WinMain function in disassembled form in Visual Studio looks like (with annotations):

You can switch to the same view by running debugging, clicking the right mouse button and selecting “to disassembled code”. Code bytes are not displayed by default (highlighted in green), but you can enable them through the context menu.
Relax! You do not need to understand the instructions either in machine language or in any dialect of assembler! This is just for illustration. In the example above, 0x00978F10 is the starting address, and 8B FF is the first instruction. We just need to replace it with a breakpoint instruction. We know that such an API function is called DebugBreak, but at such a low level we cannot use it. For x86, the instruction is a breakpoint _asm int 3. It names code 0xCC (204).
It turns out that we just need to replace the value of byte 8B with CC and that's it! When the program is launched, the exception EXCEPTION_DEBUG_EVENT with the code EXCEPTION_BREAKPOINT will be generated in this place. We know that it was we who did this, and after that we handle this exception in the way we need it. If you did not understand this paragraph, I ask you for the last time, first read the first part of the article [http://habrahabr.ru/post/154847/].
X86 instructions are not fixed length, but who cares? We do not need to see how many bytes (1, 2, N) the instruction takes. We just change the first byte. The first byte of the instruction can be anything, not just 8B. But we must ensure that as soon as the time comes to continue the execution of the program, we will restore the original byte.
A small remark for those who know everything and for those who do not know something. First, breakpoints are not the only way to stop a program from running at the starting address. A better alternative is one-time breakpoints, which we'll discuss later. Secondly, the CC instruction is not the only breakpoint instruction, but for us it is enough for the eyes.
There are some difficulties with getting the starting address, but to keep your interest, let me immediately show the C ++ code to get the starting address. The lpStartAddress member in the CREATE_PROCESS_DEBUG_INFO structure contains the starting address. We can read this information while processing the very first debugging event:
// This is inside Debugger-loop controlled by WaitForDebugEvent, ContinueDebugEvent switch(debug_event.dwDebugEventCode) { case CREATE_PROCESS_DEBUG_EVENT: { LPVOID pStartAddress = (LPVOID)debug_event.u.CreateProcessInfo.lpStartAddress; // Do something with pStartAddress to set BREAKPOINT. ... ... The type CREATE_PROCESS_DEBUG_INFO :: lpStartAddress is LPTHREAD_START_ROUTINE, and I think you know what it is (function pointer). But, as I said, there are some difficulties with the starting address. In short, this address is relative to where the application image was loaded into memory. To make me more convincing, let me show you the output of dumpbin utilities with the / headers option:
dumpbin /headers DebugMe.exe ... OPTIONAL HEADER VALUES 10B magic # (PE32) 8.00 linker version A000 size of code F000 size of initialized data 0 size of uninitialized data 11767 entry point (00411767) @ILT+1890(_wWinMainCRTStartup) 1000 base of code This address (00411767) is stored in lpStartAddress while debugging our application. But when I started debugging from within Visual Studio, the address of wWinMainCRTStartup was different from this (@ILT has nothing to do with this).
Thus, let me postpone the discussion of the intricacies of obtaining a starting address and simply use the GetStartAddress () function, the code of which will be shown later. It will return the exact address where you should set a breakpoint!
Change instruction at start address to breakpoint instruction
As soon as we get the start address, changing the instructions at this point to a breakpoint (CC) is quite trivial. We need to do:
- Read one byte at this address and save it.
- Write in its place byte 0xCC
- Clear instruction cache
- Continue debugging
Now you need to ask two important questions:
- How to count, write and reset instructions?
- When do we do this?
Let me answer the second question first. We will read, write and reset instructions during the processing of the CREATE_PROCESS_DEBUG_EVENT event (or, at your discretion, at the time of EXCEPTION_BREAKPOINT). When the process starts to load, we get the real starting address (I mean the CRT-Main address), read the first instruction at this address, save it, and write to this place byte 0xCC. Then we call our debugger ContinueDebugEvent ().
For a better understanding, let me show you the code:
DWORD dwStartAddress = GetStartAddress(m_cProcessInfo.hProcess, m_cProcessInfo.hThread); BYTE cInstruction; DWORD dwReadBytes; // Read the first instruction ReadProcessMemory(m_cProcessInfo.hProcess, (void*)dwStartAddress, &cInstruction, 1, &dwReadBytes); // Save it! m_OriginalInstruction = cInstruction; // Replace it with Breakpoint cInstruction = 0xCC; WriteProcessMemory(m_cProcessInfo.hProcess, (void*)dwStartAddress,&cInstruction, 1, &dwReadBytes); FlushInstructionCache(m_cProcessInfo.hProcess,(void*)dwStartAddress,1); A little bit about the code:
• M_cProcessInfo is a member of our class, which is nothing more than PROCESS_INFORMATION, filled with the CreateProcess function.
• The GetStartAddress () function returns the starting address of the process. For a unicode user interface application, this is the address of the wWinMainCRTStartup () function;
• Then we call ReadProcessMemory to get the byte located at the start address and save its value
• After this, write a breakpoint instruction (0xCC) at this address using the WriteProcessMemory function
• Finally, call FlushInstructionCache so that the CPU reads the new instruction, and not any cached old one. The CPU, of course, may not zasherovat instruction, but you always have to call FlushInstructionCache.
Note that ReadProcessMemory requires PROCESS_VM_READ rights. In addition, WriteProcessMemory requires PROCESS_VM_READ | PROCESS_VM_OPERATION - all these permissions are granted to the debugger as soon as it passes the debug flag to CreateProcess. Thus, we do not need to do anything and reading / writing will always be successful (with valid memory addresses, of course!).
Processing breakpoint instructions and restoring original instructions
As you know, breakpoint instruction (EXCEPTION_BREAKPOINT) is the type of exception that comes with the EXCEPTION_DEBUG_EVENT debugging event. We handle debug events using the EXCEPTION_DEBUG_INFO structure. The code below will help you remember and understand:
// Inside debugger-loop switch(debug_event.dwDebugEventCode) { case EXCEPTION_DEBUG_EVENT: { EXCEPTION_DEBUG_INFO & Exception = debug_event.u.Exception; // Out of union // Exception.ExceptionCode would be the actual exception code. ... The operating system will always send one breakpoint instruction to the debugger, which will indicate that the process is loading. That is why you can “set the breakpoint instruction at the starting address” at the very first exception of the breakpoint. This ensures that all breakpoints after the first one are yours.
No matter where your breakpoints are, you still need to ignore the first breakpoint event. Although debuggers, for example, WinDbg, will show you this breakpoint, the Visual Studio debugger will ignore this breakpoint and start execution from the logical beginning of the program (main / WinMain, not CRT-Main).
Thus, the interrupt handling code will look like this:
// 'Exception' is the same variable declared above switch(Exception.ExceptionRecord.ExceptionCode) { case EXCEPTION_BREAKPOINT: if(m_bBreakpointOnceHit) // Would be set to false, before debugging starts { // Handle the actual breakpoint event } else { // This is first breakpoint event sent by kernel, just ignore it. // Optionally display to the user that first BP was ignored. m_bBreakpointOnceHit = true; } break; ... You can also use the else-part to set a breakpoint instead of setting it during the process start event. In any case, the main processing of the breakpoint event occurs in the if part. We need to handle a breakpoint that we placed at the starting address.
It becomes difficult and intriguing - concentrate, read carefully, sit relaxed. If you haven't had a break while you read this article, make it!
In simple terms, the breakpoint event occurred where we placed it. Now we simply interrupt the execution, show the call stack (and other useful information), return the original instruction and wait for any action from the user to continue debugging.
At the assembler or machine code level, when a breakpoint event was generated and sent to the debugger, the instruction has already been executed, although it was just one byte in size. The instruction pointer has already moved to this byte.
Thus, in addition to recording the original instructions at our address, we also need to correct the processor registers. We can get and set registers of our process specifically using the GetThreadContext and SetThreadContext functions. Both functions take on a context structure. Strictly speaking, the members of this structure depend on the processor architecture. Since this article focuses on the x86 architecture, we will follow the same structure definition, which can be found in the header file winnt.h.
Here is how we can get the flow context:
CONTEXT lcContext; lcContext.ContextFlags = CONTEXT_ALL; GetThreadContext(m_cProcessInfo.hThread, &lcContext); , . ? EIP . Eip CONTEXT. , EIP . , , . : lcContext.Eip --; // Move back one byte SetThreadContext(m_cProcessInfo.hThread, &lcContext); EIP is the address at which the processor will read the next instruction and execute it. You need THREAD_GET_CONTEXT and THREAD_SET_CONTEXT rights to successfully perform these functions, and you already have them.
Let me briefly switch to another topic: restoring the original instructions! To write the original instruction in the running process, we need to call WriteProcessMemory, followed by FlushInstructionCache. Here is how it is done:
DWORD dwWriteSize; WriteProcessMemory(m_cProcessInfo.hProcess, StartAddress, &m_cOriginalInstruction, 1,&dwWriteSize); FlushInstructionCache(m_cProcessInfo.hProcess,StartAddress, 1); Original instructions restored. We can call ContinueDebugEvent. What we did:
- GetThreadContext, reduce EIP by one, SetThreadContext.
- Restore the original instructions
- Continue debugging
Well, where is the call stack? Registers? Source? And when will the program end? All this will be without user interaction!
Stop execution, call stack, register values and source code, if any
To display the call stack, we need to load debugging symbols, which are stored in existing * .PDB files. The set of functions from DbgHelp.dll helps us to load symbols, list the source code of files, trace the call stack and much more. And all this will be considered later.
To display the CPU registers, we just need to display the actual data from the CONTEXT structure. To display 10 registers as in the Visual Studio debugger (Debug -> Windows -> Registers or Alt + F5) you can use the following code:
CString strRegisters; strRegisters.Format( L"EAX = %08X\nEBX = %08X\nECX = %08X\n" L"EDX = %08X\nESI = %08X\nEDI = %08X\n" L"EIP = %08X\nESP = %08X\nEBP = %08X\n" L"EFL = %08X", lcContext.Eax, lcContext.Ebx, lcContext.Ecx, lcContext.Edx, lcContext.Esi, lcContext.Edi, lcContext.Eip, lcContext.Esp, lcContext.Ebp, lcContext.EFlags ); And that's it! Display this text in the appropriate window.
To suspend program execution until the user gives the appropriate command (Continue, Step-in, Stop Debugging, etc.), we should not call ContinueDebugEvent. Since the debug stream and GUI stream are different, we simply ask the GUI stream to display the actual information and freeze the debug stream until some “event” arrives, for example, from the user.
Confused? The word "event" is in quotation marks, since it is nothing more than an event created by the CreateEvent function. To suspend program execution, we call WaitForSingleObject (in the debugger thread). To restart the debugger thread, we simply call SetEvent from the GUI thread. Of course, depending on your preferences, you can use other technologies to synchronize threads. This clause provides only a general idea of the implementation of the function “suspend execution - continue execution”.
Now, thanks to this reasoning, we can write code logic:
- GetThreadContext, reduce EIP by one, SetThreadContext
- Return original instruction using WriteProcessMemory, FlushInstructionCache
- Display current register values
- Using the functions of character information * .PDB files, display the source code and line number (if possible)
- Using call stack trace functions and character information functions, get a call stack and display it
- Waiting for user response
- Execution of the event requested by the user (Continue, Step, Stop, ...)
- Calling ContinueDebugEvent
Surprised? Fine! I hope you enjoy debugging!
One important point that is worth mentioning is that a thread that is being debugged cannot be the primary thread being debugged, but it must call a breakpoint instruction. Until now, we are still handling the first breakpoint event to pause program execution. But those eight stages that I have listed above will apply to all debugging events (from any stream being debugged) that can pause the execution of the program.
There are still minor difficulties with changing EIP. Let me tell you about the problem itself, and I will show you the solution to it later. The breakpoint can be set by the user, and we also replace the instructions for these addresses with CC (of course, keeping the original instructions). As soon as program execution reaches the next breakpoint, we simply return the instruction and execute the 8 steps that I described above. Enough detail? Well, if we do this, then the program will pause in this place only once, and if we do not return the original instruction, then we will have complete confusion!
Anyway, let me continue!
Oh yes! Source! I know you already want to know how to do it to death!
Any * .EXE and * .DLL image can have debugging information supplied with it in the * .PDB file. A little about this:
- Debugging information will be available only if the / DEBUG flag was set when compiling with the linker. In Visual Studio, you can change this in the project properties (Linker-> Debugging -> Generate Debug Info).
- The / DEBUG flag does not mean that the EXE / DLL will be compiled in a debug configuration. The _DEBUG / DEBUG preprocessor macros are processed at compile time. But the rest is already during linking.
- This means that even in the Release configuration, the image may contain debug information, and in the Debug configuration it may not.
- A file with the * .PDB extension stores debugging information and is usually named <program_name> .pdb, but you can rename it using the linker options. The file contains all the information about the source code: functions, classes, types, and more.
- The linker places a small piece of information about the * .PDB file in the header of the EXE / DLL image. Since this information is placed in the header, this does not affect file performance, only the file size is increased by several bytes / kilobyte.
To get debug information, we need to use the Sym * functions inside DbgHelp.Dll. This library is the most important component of debugging at the source code level. It also contains call stack trace functions and for getting information about an EXE / DLL image. To use them you need to connect Dbghelp.h and DbgHelp.lib.
To get debugging information, you need to initialize the symbol handler for this process. Since our target process is debugee, we initialize it with a debugee identifier. To initialize the symbol handler, we need to call the SymInitialize function:
BOOL bSuccess = SymInitialize(m_cProcessInfo.hProcess, NULL, false); The first parameter is the ID of the running process for which character information is required. The second parameter is the paths where you should look for the * .PDB file, separated by a semicolon. The third parameter indicates whether the symbol handler should automatically load characters for all modules or not.
Now the lines below make sense:
'Debugger.exe': Loaded 'C:\Windows\SysWOW64\msvcrt.dll', Cannot find or open the PDB file 'Debugger.exe': Loaded 'C:\Windows\SysWOW64\mfc100ud.dll', Symbols loaded. Visual Studio 2010 could not find the symbols for msvcrt.dll. And the mfc100ud.dll library has its own debug symbols, so Visual Studio was able to download them. Essentially, this means that for MFC libraries, Visual Studio will display symbolic information, source code, class / function names, stack stack, and so on. To explicitly load symbols for the corresponding libraries / exe-files, we call the function SymLoadModule64 / SymLoadModuleEx.
Where and when should we call these functions? It took me a lot of time while I tried to initialize and load debugging information before the debug loop (i.e. before any debugging event, but after CreateProcess). It did not work. This must be done when processing CREATE_PROCESS_DEBUG_EVENT. Since we refuse to automatically load symbols from dependent modules, we need to call the SymLoadModule64 / Ex function for the newly downloaded EXE file. For incoming events LOAD_DLL_DEBUG_EVENT, we also need to call this function. Depending on the module settings, we will either be able to show debug information to the user, or not.
Below you can see an example of debugging information loading code when processing a library loading event. The GetFileNameFromHandle function is described in the previous part of the article .
case LOAD_DLL_DEBUG_EVENT: { CStringA sDLLName; sDLLName = GetFileNameFromHandle(debug_event.u.LoadDll.hFile); DWORD64 dwBase = SymLoadModule64 (m_cProcessInfo.hProcess, NULL, sDLLName, 0, (DWORD64)debug_event.u.LoadDll.lpBaseOfDll, 0); strEventMessage.Format(L"Loaded DLL '%s' at address %x.", sDLLName, debug_event.u.LoadDll.lpBaseOfDll); ... Of course, the similar code will be also when loading process. A small caveat: successful initialization of debugging information and its successful download does not mean that the source code will be available! We need to call SymGetModuleInfo64 to load information from * .PDB, if it is available. Here is how it is done:
// Code continues from above IMAGEHLP_MODULE64 module_info; module_info.SizeOfStruct = sizeof(module_info); BOOL bSuccess = SymGetModuleInfo64(m_cProcessInfo.hProcess,dwBase, &module_info); // Check and notify if (bSuccess && module_info.SymType == SymPdb) { strEventMessage += ", Symbols Loaded"; } else { strEventMessage +=", No debugging symbols found."; } I am very grateful to Jochen Kalmbach for his excellent article on stack tracing, which helped me to find information about the source code and stack trace.
When the symbol type is symPdb, we have information about the source code. * .PDB contains only information about the source code, the source code itself (the files * .h and * .cpp) must be available at the specified path! * .PDB contains character names, file names, line numbers and more. Tracing the stack (without reviewing the source code) is quite possible if we have function names.
Finally, when a breakpoint event arrives, we can get a call stack and show it. To do this, we need to call the StackWalk64 function. Below you can look at the trimmed sample code that uses this function. Please, for a full understanding, read the article by Jochen Kalmbach, about which I spoke.
void RetrieveCallstack(HANDLE hThread) { STACKFRAME64 stack={0}; // Initialize 'stack' with some required stuff. StackWalk64(IMAGE_FILE_MACHINE_I386, m_cProcessInfo.hProcess, hThread, &stack, &context, _ProcessMemoryReader, SymFunctionTableAccess64, SymGetModuleBase64, 0); ... STACKFRAME64 is a data structure that contains addresses from which information about the call stack is extracted. As Jochen writes, for x86 we need to initialize this structure before calling the function StackWalk64:
CONTEXT context; context.ContextFlags = CONTEXT_FULL; GetThreadContext(hThread, &context); // Must be like this stack.AddrPC.Offset = context.Eip; // EIP - Instruction Pointer stack.AddrPC.Mode = AddrModeFlat; stack.AddrFrame.Offset = context.Ebp; // EBP stack.AddrFrame.Mode = AddrModeFlat; stack.AddrStack.Offset = context.Esp; // ESP - Stack Pointer stack.AddrStack.Mode = AddrModeFlat; When calling StackWalk64, the first constant determines the type of machine that is x86. The next argument is the ID of the process being debugged. The third is the thread ID in which we will receive the call stack (not necessarily the main thread). The fourth parameter is the most important parameter for us. The fifth is the context of the structure that has the necessary addresses for initialization. The _ProcessMemoryReader function is a function we declared that does nothing except call ReadProcessMemory. The other two Sym * functions are from DbgHelp.dll. The last parameter is also a function pointer, but we do not need it.
To trace the call stack, you definitely need a loop until the trace ends. While such questions are open as: an invalid call stack, an endless call stack and some others, I decided to do it in a simple way: call the function until the returned address becomes NULL or until StackWalk64 is executed abnormally. Below is shown how we will receive the call stack (the function names will be received a bit later):
BOOL bSuccess; do { bSuccess = StackWalk64(IMAGE_FILE_MACHINE_I386, ... ,0); if(!bTempBool) break; // Symbol retrieval code goes here. // The contents of 'stack' would help determining symbols. // Which would put information in a vector. }while ( stack.AddrReturn.Offset != 0 ); The debugging symbol has several properties:
- Module name (exe or dll)
- Symbol name - decorated or not decorated
- Symbol type: function, class, parameter, local variable, etc.
- Virtual symbol address
The stack trace also includes: source file, line number, first processor instruction on this line.
Although we do not need the first instruction of the processor on this line, as long as we do not disassemble the code, we may need to move relative to the first instruction. So it happens, the code at the source code level contains several instructions in one line (for example, multiple function calls). For now, I omit it.
Thus, we need: the name of the module, the name of the function being called and the line number in order to form complete stack data.
, , SymGetModuleInfo64. , – SymLoadModuleXX, SymGetModuleInfo64 . ( StackWalk64 ), :
IMAGEHLP_MODULE64 module={0}; module.SizeOfStruct = sizeof(module); SymGetModuleInfo64(m_cProcessInfo.hProcess, (DWORD64)stack.AddrPC.Offset, &module); module.ModuleName , . module.MoadedImageModule . Module.LineNumbers , (1 – ). . , SymGetSymFromAddr64 SymFromAddr. PIMAGEHLP_SYMBOL64, 6 , ( , ) SYMBOL_INFO. , , – . : IMAGEHLP_SYMBOL64 *pSymbol; DWORD dwDisplacement; pSymbol = (IMAGEHLP_SYMBOL64*)new BYTE[sizeof(IMAGEHLP_SYMBOL64)+MAX_SYM_NAME]; memset(pSymbol, 0, sizeof(IMAGEHLP_SYMBOL64) + MAX_SYM_NAME); pSymbol->SizeOfStruct = sizeof(IMAGEHLP_SYMBOL64); // Required pSymbol->MaxNameLength = MAX_SYM_NAME; // Required SymGetSymFromAddr64(m_cProcessInfo.hProcess, stack.AddrPC.Offset, &dwDisplacement, pSymbol); // Retruns true on success :
- . , . MAX_SYM_NAME 2000.
- IMAGEHLP_SYMBOL64 DbgHlp.dll . ( — . .), SizeOfStruct , . MaxNameLength .
- : Name (, ) Address, ( ).
Using SymFromAddr and initializing SYMBOL_INFO is almost the same, and I prefer to use this new feature. Although now she cannot give us any additional information, then I will explain all the fields of this structure as needed.
Finally, to finish working with the call stack, we need to get the path to the source code and the line number. I remind you that the * .PDB file contains this information only if the debugging symbols were successfully loaded. Also, the PDB contains only the source code information, not the source code.
To get the information with the line number, we need to use SymGetLineFromAddr64 and get it through the IMAGEHLP_LINE64 structure. This function takes 4 arguments, and the first three coincide with the function described above. It is only necessary to initialize the structure with the correct size. It looks like this:
IMAGEHLP_LINE64 line; line.SizeOfStruct = sizeof(line); bSuccess = SymGetLineFromAddr64(m_cProcessInfo.hProcess, (DWORD)stack.AddrPC.Offset, &dwDisplacement, &line); if(bSuccess) { // Use line.FileName, and line.LineNumber } The functions of the debugging symbols or any other functions from DbgHlp.dll do not support the loading of the source code and its display. We have to do it ourselves. If the string information or source file is not available, we will not be able to display the source code.
At the time of this writing, I have not yet decided what will be displayed if the source code is not available. We can show a set of instructions, but the x86 instructions are not fixed size. We can simply show a sequence of bytes (for example, "55 04 FF 76 78 AE ...") in one line. Or we can disassemble the instructions and show the result. Although I have a module for disassembling x86 code, it does not understand all the instructions.
, . , , , , , , , UI. , Windows .
, , ContinueDebugEvent. , .
(UT – , DT – ):
[UT] . UI.
[DT] CreateEvent.
[DT] CreateProcess .
[DT] , .
[DT] WaitForSingleObject DT
[UT] - , (, )
[UT] SetEvent DT
[DT] , .
, () . / , , :
( GetStartAddress!). , CREATE_PROCESS_DEBUG_INFO::lpStartAddress – , . , ? , , , .
, , DbgHelp.dll Sym* , . SymFromName , SYMBOL_INFO. SymGetSymFromName64, PIMAGEHLP_SYMBOL64. , wWinMainCRTStartup, SymFromName:
DWORD GetStartAddress( HANDLE hProcess, HANDLE hThread ) { SYMBOL_INFO *pSymbol; pSymbol = (SYMBOL_INFO *)new BYTE[sizeof(SYMBOL_INFO )+MAX_SYM_NAME]; pSymbol->SizeOfStruct= sizeof(SYMBOL_INFO ); pSymbol->MaxNameLen = MAX_SYM_NAME; SymFromName(hProcess,"wWinMainCRTStartup",pSymbol); // Store address, before deleting pointer DWORD dwAddress = pSymbol->Address; delete [](BYTE*)pSymbol; // Valid syntax! return dwAddress; } , wWinmainCRTStartup, . , , , , , EXE , 32-, , Unicode ANSI .
? .
CDebuggerCore — The debugging-interface class
I wrote an abstract class that has only a few purely virtual functions needed for debugging. Unlike the previous article, which was closely integrated into the user interface and MFC, I made this class independent of anything. I used the native identifiers of the Windows STL and CString class in this class. Please note that you can use CString from non-MFC applications through the <atlstr.h> connection. There is no need to link the program with the MFC-libraries, just one header file is enough. If CString bothers you, replace it with your favorite string class and that's it.
Here is the basic skeleton of CDebuggerCore:
class CDebuggerCore { HANDLE m_hDebuggerThread; // Handle to debugger thread HANDLE m_heResumeDebugging; // Set by ResumeDebugging PROCESS_INFORMATION m_cProcessInfo; // Other member not shown for now. public: // Asynchronous call to start debugging // Spawns a thread, that has the debugging-loop, which // calls following virtual functions to notify debugging events. int StartDebugging(const CString& strExeFullPath); // How the user responded to continue debugging, // it may also include stop-debugging. // To be called from UI-thread int ResumeDebugging(EResumeMode); // Don't want to listen anything! Terminate! void StopDebugging(); protected: // Abstract methods virtual void OnDebugOutput(const TDebugOutput&) = 0; virtual void OnDllLoad(const TDllLoadEvent&) = 0; virtual void OnUpdateRegisters(const TRegisters&) = 0; virtual void OnUpdateCallStack(const TCallStack&) = 0; virtual void OnHaltDebugging(EHaltReason) = 0; }; Some readers may not like this class. But in order to explain how the debugger code works, I have to write the code itself!
Since this class is abstract, it must be basic for some other class and all virtual methods (On *) must be overloaded. Needless to say, these virtual functions are called from the main class depending on various debugging events. No virtual function requires a return value, so you can leave the implementation empty.
Suppose you created the CDebugger class inherited from CDebuggerCore and implemented all the virtual functions. Then you can start debugging with this code:
// In header, or at some persist-able location CDebugger theDebugger; // The point in code where you ask it to start debugging: theDebugger.StartDebugging("Path to executable"); , , , . – , StartDebugging .
, DebuggerThread ( ). CreateProcess, WaitForDebugEvent ContinueDebugEvent. - , On*. , OUTPUT_DEBUG_STRING_EVENT, OnDebugOutput . . .
, , , , On* , HaltDebugging . private CDebuggerCore, :
// Enum enum EHaltReason { // Reason codes, like Breakpoint }; // In CDebuggerCore private: void HaltDebugging(EHaltReason); :
void CDebuggerCore::HaltDebugging(EHaltReason eHaltReason) { // Halt the debugging OnHaltDebugging(eHaltReason); // And wait for it, until ResumeDebugging is called, which would set the event WaitForSingleObject(m_heResumeDebugging,INFINITE); } , HaltDebugging, OnHaltDebugging. OnHaltDebugging , , . , . DT .
UI, : , .. UI ResumeDebugging c (, « (Continue)», « (StepIp)» « (Stop)»). ResumeDebugging, EResumeMode, SetEvent . .
, HaltDebugging , , . m_eResumeMode, ResumeDebugging ; , . , EResumeMode :
// What action was initiated by user to resume enum EResumeMode { Continue, // F5 Stop, // Shift+F5 StepOver, // F10 // More .. }; The final part will be:
- Getting source codes and line numbers
- Setting custom breakpoints
- Code tracing (step-in, step-out, step-over)
- Conditional breakpoints
- Debugging a running process
- Disconnect from process, shutdown or wait?
- Debugging a Fallen Process
- Manually connecting the debugger
Source: https://habr.com/ru/post/190800/
All Articles