From the basement of the secret laboratory of the PVS-Studio developers ...

From time to time we talk about our internal research and development, which takes place in the development team of the PVS-Studio static code analyzer for C / C ++. Today's story is about another new product that we are preparing as part of our product.
Those who follow our project (and even more so use it) know that our analyzer was originally a plug-in only for Visual Studio. Then it became possible to use it as a console application embedded in the Makefile (ask me how if you do not know). Then, at the beginning of this year, we had integration in C ++ Builder. By the way, we still have quite a few users under C ++ Builder, and we do not quite understand why. And recently, we thought about the so-called standalone application.
')
In general, how does the ideal static code analyzer look like for the user (in vacuum or not)? It seems to me that, based on my experience in this field, the ideal analyzer should look like this. The user downloads the utility, launches it, indicates the folder with the code, and presses the big green button: “Find all errors!”. No settings, no "integration into the project." After all, the user does not need it? Yes, not necessary. But you need a code analyzer, unfortunately. At a minimum, you need information on #include and #define if we are talking about C ++. It is needed in order to perform the preprocessing of the code.
And here we come to the need to choose one of the options:
- Either the tool itself must extract this information from the project file (as our plugins for Visual C ++ and C ++ Builder do).
- Or the tool can receive this information if it is sent to it in the Makefile (how our command line version works).
- Either the tool forces the user to painfully drive in all the folders for #include and #define parameters, which is almost impossible, since It is extremely difficult for the user to do this.
- Or ... come up with some other option.
We went the fourth way and decided to try it. And what if, as the source information, the analyzer will receive not ordinary source files in the form of .cpp files, but already preprocessed files . Those. files that are processed by the preprocessor. This will save us from having to call the preprocessor, and therefore know these #include and #define.
Of course, this is slightly different from the ideal analyzer option described above. But on the other hand, it allows you to use PVS-Studio for almost any C / C ++ project, no matter in which development environment you would not run it.
So, the tool developed in the secret laboratories of our team looks like this:
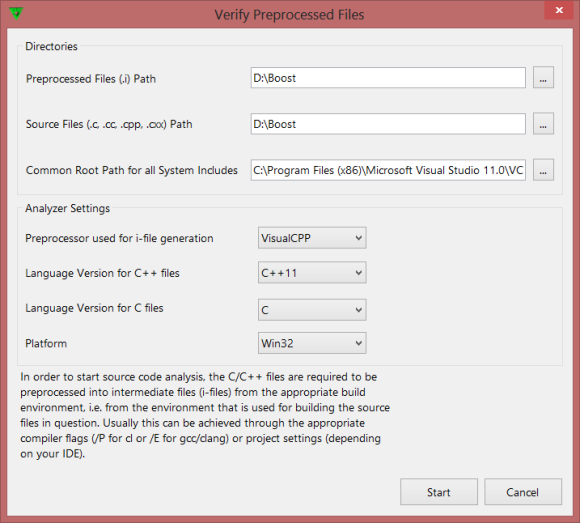
Figure 1 - Startup dialog for scanning preprocessed files.
First, we specify the folder where the preprocessed .i-files are located. They will analyze our tool.
Secondly, we specify the source folder. This is necessary in order to identify errors more accurately. In addition, it is always better to do (in the future) navigate through custom .cpp-files, rather than not quite understandable to humans .i-files.
Third, we specify the folder in which the system include files are located. The most basic ones, like <string> or <stream>. For what? In order for the analyzer to know that there are files here that do not need to issue diagnostic messages.
So, we can “feed” the preprocessed files to this program, and then run the analyzer onto them. This is how we are currently testing the Boost project. By the way, there will soon be a report on checking Boost - subscribe to our blog, so as not to miss. After checking the files, we get a list of diagnostic messages in this form:

Figure 2 - List of diagnostic messages after checking i-files.
I draw readers' attention to the fact that this is not Visual Studio or RAD Studio. This is a separate utility that repeats completely (or rather uses) the PVS-Studio window. It also has a built-in code editor (Scintilla from Notepad ++), which allows you to work with errors quite fully:
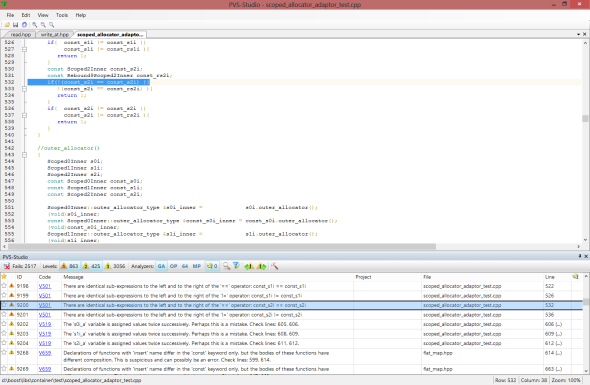
Figure 3 - Full code editor.
Naturally, this post does not pull on a full description of our new secret utility. However, I can answer a few questions.
Who DOES NOT need this utility? Those who can easily test their project in PVS-Studio with the help of integration in Visual Studio and C ++ Builder. Who needs this utility? Those who want to check their code using PVS-Studio and use other development environments and / or project files that are difficult to integrate our command line utility.
What would you like to see such a utility? Is the checking mode for ready-to-use preprocessed files convenient for you? What is missing in such a utility? Should we release it or abandon further development of this utility, as everyone is satisfied with our integration into Microsoft / Embarcadero environments?
PS By the way, we have updated the design of our database of errors found in open source projects.
Source: https://habr.com/ru/post/189566/
All Articles