Correct analytics in a mobile application
The vast majority of mobile applications are published without integrated analytics frameworks and without their proper configuration. This is very sad, the application is not a website where you can plug in Google Analytics in 10 minutes and collect statistics.
I see four reasons to think about analytics in a mobile application BEFORE its release:
Under the cut a set of tools for analytics and recommendations for their customization adopted in Touch Instinct and valuable comments from LinguaLeo and the mobile advertising agency Mobio.

')
By analytics of user behavior, I mean the collection and display of such data as:
- the number of daily audience (DAU);
- user paths in the application;
- how often the application functions are used;
- achieving goals (registration, purchase, three visits in a month, ...);
- frequency of returning the audience (retention rate).
The web usually uses free and powerful Google Analytics to get this data. Google Analytics has a great mobile version . To make it work you need to build a special library of iOS , Android .

Track the opening of each screen. In Android, we call the tracker in onStart and onStop for each Activity. In iOS, we inherit ViewController from GAITrackedViewController and set the name of the screen .
Track the click of any button, an interactive item on the screen, or a search query. In Google Analytics, Events are for this purpose. In the handlers for the elements of interest to us, we call sendEvent . Consider what action parameters will be required for analytics: the text of the search query, the object id on the card of which pressed the button, ... and transfer them to Label.
If the application has built-in purchases do not forget to set up their tracking. ( Android , iOS )
Analytics is powerful and free, all analysts know how to work with it. Almost perfect tool. If it were not for one fat BUT, Google Anayltics is not able to track the source of installations for iOS. Able only for Android. This dramatically undermines all its merits, so I recommend using the free Flurry .
 Ilya Krasinsky , Lingua Leo
To use Flurry, embed the library in the application ( iOS , Android )
In Flurry, there is no screen concept, there are only events (logEvent). Do not use a single pageView event with parameters . This is then impossible to use. For each screen, call a separate event.
 Alexey Pisarevsky , Mobio Mobile Marketing Agency
Ilya Krasinsky , Lingua Leo
In addition to GA and Flurry, the most popular are : MixPanel (the most powerful tool), Localytics and Apsalar . I recommend starting with Flurry.
On the web, you can accurately track where each user came to you thanks to the referer and the ability to pass arbitrary parameters to the url (for example, utm tags ).
In the mobile world, everything is more complicated. After clicking on the link to the application, the user leaves the browser in the application store and the chain breaks. That is, without additional gestures, you cannot assess the effectiveness of marketing activities .

Google made support referer and utm-tags for Android. Just add a couple of lines to the manifest and you'll see traffic sources in Analytics. Apple, unfortunately, is not so generous and it is impossible to understand where the installation came from. Therefore, Google Analytics does not close the problem of mobile analytics.
Third-party services help: AppsFlyer , Distimo , Mobile app tracking , Adxtracking and ... Flurry.
These tools work heuristically and do not always correctly associate the installation with following a link. It works like this:
Ilya Krasinsky , Lingua Leo
Alexey Pisarevsky , Mobio Mobile Marketing Agency
In my opinion, in most cases, Flurry is the perfect solution. This includes analytics of user behavior and source tracking for iOS / Android, and even for free. Although for my taste, Google Analytics is prettier and works much faster.

Push alerts are an important tool for engaging users. It is important not only to send push notifications correctly, but also to constantly monitor their effectiveness and adjust the strategy.
Push analytics can be divided into two parts: analysis of the behavior of users who came from push-messages and analytics in the mailing service.
With the analysis of behavior is simple. When launching an application with a push notification, we send an event to Flurry, specifying the type and text of the message. In standard reports, users will appear who have opened the application with various push messages.
With the history mailing service, it is a little more difficult, if you have not yet decided, I recommend using Parse, it has excellent reports . If you make your admin panel for push notifications, collect the following statistics:
Push analytics in the mailing service allows for a / b testing. For example, before mass mailing we do a test for 20% of users, we look at which text has a higher conversion to discoveries and send it to the remaining 80% (thanks to Maxim Ilyahov for the idea ).
This is rather a nice addition than a necessary tool, it is useful to identify problems in the application interface. It looks like this.

I recommend the service Heatma.ps , although it costs money: $ 18 for applications with a small number of users, $ 90 for applications with 10,000 active users per month.
All applications that Touch Instinct releases from August by default comply with these rules. And we teach customers how to use it all.
It is very interesting to hear your opinion! What should be from analytics necessarily? Maybe there is something better Flurry? Or do you add unusual events like “scroll to the second screen”?
Subscribe to our blog (button on the right above). Every Thursday, interesting articles about mobile development, marketing and business of a mobile studio. The following article (August 29) “Laying out Android mockups without pain” is practical advice on how to design an Android designer layout that will adapt to all resolutions, correctly stretch elements and scale fonts.
I see four reasons to think about analytics in a mobile application BEFORE its release:
- From the first time you never make a successful mobile application. After the release, an analysis of the behavior of real users in a “battle” is required.
- Evaluation of the effectiveness of advertising campaigns is impossible without analytics.
- It takes two weeks to display iOs of an application, when you suddenly have to wait for the analyst for about a month.
- Data from the past does not return.
Under the cut a set of tools for analytics and recommendations for their customization adopted in Touch Instinct and valuable comments from LinguaLeo and the mobile advertising agency Mobio.
')
User behavior analytics
By analytics of user behavior, I mean the collection and display of such data as:
- the number of daily audience (DAU);
- user paths in the application;
- how often the application functions are used;
- achieving goals (registration, purchase, three visits in a month, ...);
- frequency of returning the audience (retention rate).
The web usually uses free and powerful Google Analytics to get this data. Google Analytics has a great mobile version . To make it work you need to build a special library of iOS , Android .
Recommendations for setting up Google Analytics Mobile
Track the opening of each screen. In Android, we call the tracker in onStart and onStop for each Activity. In iOS, we inherit ViewController from GAITrackedViewController and set the name of the screen .
Track the click of any button, an interactive item on the screen, or a search query. In Google Analytics, Events are for this purpose. In the handlers for the elements of interest to us, we call sendEvent . Consider what action parameters will be required for analytics: the text of the search query, the object id on the card of which pressed the button, ... and transfer them to Label.
If the application has built-in purchases do not forget to set up their tracking. ( Android , iOS )
Analytics is powerful and free, all analysts know how to work with it. Almost perfect tool. If it were not for one fat BUT, Google Anayltics is not able to track the source of installations for iOS. Able only for Android. This dramatically undermines all its merits, so I recommend using the free Flurry .
Ilya Krasinsky , Lingua Leo1. It is much worse that the GA works in sessions. This often leads to errors in the calculation of uniqs, i.e. his colleagues very often lie, especially if in some products, for example, after registration / authorization, for some unknown reason, a session breaks down (indirectly, it can be tracked by a large number of 1–3 second sessions) or compared with other analytics
2. Out of the box can not do cohort analysis, you have to use variables and record the date of the first session of the user.
3. GA does not calculate conversions on the basis of all data, it constantly uses only a small% of data and on the basis of them approximates the results of the entire sample, especially when you look at the behavior of the metric in a month or two.
In the autumn of last year, version 2.0 of the mobile was released, some of the bugs were fixed, but still periodically on the application you encounter exorbitant bugs in the data
To use Flurry, embed the library in the application ( iOS , Android )
In Flurry, there is no screen concept, there are only events (logEvent). Do not use a single pageView event with parameters . This is then impossible to use. For each screen, call a separate event.
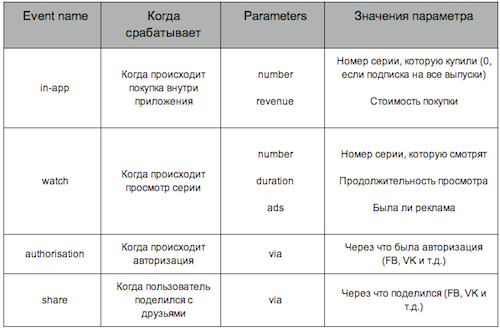
Alexey Pisarevsky , Mobio Mobile Marketing AgencyWhen setting up Flurry events, start with the most basic ones. For example, setting up Flurry events for a series app with payment of series by money or viewing an advertising video.
The key events in the application will be:
- purchases;
- views of clips;
- authorization;
- sharing in the social network;
Basic configuration of events and parameters for measuring these events:
 Ilya Krasinsky , Lingua Leo
I recommend using verbs with additions in the title of events: Success Purchase, Press plus button, Create Task, Watch movie
This greatly facilitates the construction and analysis of funnels - read a coherent text.
In addition to GA and Flurry, the most popular are : MixPanel (the most powerful tool), Localytics and Apsalar . I recommend starting with Flurry.
Sources of installations
On the web, you can accurately track where each user came to you thanks to the referer and the ability to pass arbitrary parameters to the url (for example, utm tags ).
In the mobile world, everything is more complicated. After clicking on the link to the application, the user leaves the browser in the application store and the chain breaks. That is, without additional gestures, you cannot assess the effectiveness of marketing activities .
Google made support referer and utm-tags for Android. Just add a couple of lines to the manifest and you'll see traffic sources in Analytics. Apple, unfortunately, is not so generous and it is impossible to understand where the installation came from. Therefore, Google Analytics does not close the problem of mobile analytics.
Third-party services help: AppsFlyer , Distimo , Mobile app tracking , Adxtracking and ... Flurry.
These tools work heuristically and do not always correctly associate the installation with following a link. It works like this:
- For each channel (ex. Iphones.ru, google admob, habr, banner on the site, email newsletter ...) a unique link is created
- The user opens the link on the smartphone
- The server collects a maximum of open data about the smartphone and redirects the user to the AppStore.
- After installing the application, the method is launched from the SDK tracker. It collects the data on the smartphone again and compares it with the data from point 3.
Ilya Krasinsky , Lingua LeoMAT (Mobile App Tracking) is generally the most reliable. It is believed that in 80% of cases it determines the source.
The tool for tracking in the flu appeared not so long ago and so far I have no data about its reliability.
MAT is good in that it can wrap the link in a flute and thus there will be 2 tracking systems.
Fluri is good because on the basis of tracking you can build segments and analyze the audience that came from different channels.
Alexey Pisarevsky , Mobio Mobile Marketing AgencyI recommend embedding a tracking system that will allow you to buy ads using the CPI model (cost-per-install, pay for installations). Such systems inform the ad network about the fact of installation. There are several CPI networks in Russia: Clickrocket , Unilead , Mobioffers ) ... they work on the same principle as the CPA networks on the web. You assign a price for the installation (for example, $ 3), the offer is sent to network partners. Sites accept this offer and advertise. Upon the installations, the network pays sites a reward equal to your rate minus the network commission. To use CPI networks, you must send information from which site the user came from. You can embed a library of each site or a tracker that is integrated with a large number of CPI networks. Flurry is integrated with fewer networks, and Google Analytics is not able to send information at all. They are not suitable for this purpose.
The most powerful Mobile App Tracking tracker. It is integrated with the vast majority of advertising sources. Unfortunately, it is expensive: 0.2 cents for each measured event, including clicks and events. Other popular trackers are AdXtracking and Appsflyer. Their price is more loyal. Appsflyer only takes 5 cents per install. Organic plants are free.
I recommend Appsflyer + Flurry to my clients. The first is for assessing the effectiveness of the promotion, and the second is for analyzing user behavior.
In my opinion, in most cases, Flurry is the perfect solution. This includes analytics of user behavior and source tracking for iOS / Android, and even for free. Although for my taste, Google Analytics is prettier and works much faster.
Push analytics
Push alerts are an important tool for engaging users. It is important not only to send push notifications correctly, but also to constantly monitor their effectiveness and adjust the strategy.
Push analytics can be divided into two parts: analysis of the behavior of users who came from push-messages and analytics in the mailing service.
With the analysis of behavior is simple. When launching an application with a push notification, we send an event to Flurry, specifying the type and text of the message. In standard reports, users will appear who have opened the application with various push messages.
With the history mailing service, it is a little more difficult, if you have not yet decided, I recommend using Parse, it has excellent reports . If you make your admin panel for push notifications, collect the following statistics:
- the number of sent;
- the number of applications opened after a push message;
- The percentage of users who subscribed to push among all users of the application.
Push analytics in the mailing service allows for a / b testing. For example, before mass mailing we do a test for 20% of users, we look at which text has a higher conversion to discoveries and send it to the remaining 80% (thanks to Maxim Ilyahov for the idea ).
Heat maps
This is rather a nice addition than a necessary tool, it is useful to identify problems in the application interface. It looks like this.
I recommend the service Heatma.ps , although it costs money: $ 18 for applications with a small number of users, $ 90 for applications with 10,000 active users per month.
All applications that Touch Instinct releases from August by default comply with these rules. And we teach customers how to use it all.
It is very interesting to hear your opinion! What should be from analytics necessarily? Maybe there is something better Flurry? Or do you add unusual events like “scroll to the second screen”?
Subscribe to our blog (button on the right above). Every Thursday, interesting articles about mobile development, marketing and business of a mobile studio. The following article (August 29) “Laying out Android mockups without pain” is practical advice on how to design an Android designer layout that will adapt to all resolutions, correctly stretch elements and scale fonts.
Source: https://habr.com/ru/post/189344/
All Articles