Battle for conversion
In the previous article, we talked about how to attract an audience through our own affiliate program. Now you need to bring new visitors to the goals for which your service was started.
We will review the public tools that we used to increase Buruk ’s conversion by 25% and make users a little happier. In the end - about the new product from Google Analytics, which allows you to link online traffic sources with offline conversion.
Work on increasing conversion consists of several stages. Which one is more important - you can’t tell right away, it’s important that the work is iterative and the information obtained at the previous iteration is used for the next one.
')
For this you need:
For Buruk, our main goals are the beginning of the search, the subscription to the newsletter, the transition to the agent from the search results and the most important, but postponed in time target - the purchase of a ticket. It became possible to track deferred targets quite recently and this is a very cool feature. How to use deferred conversion - at the end of the article.
After the goals are set, it is necessary to collect statistics of the initial conversion, we will dance from it and we will increase it. Depending on the number of goals, project attendance and the frequency of transactions, the initial data collection period can take from a couple of hours to a couple of weeks.
Placed goals will help not only to understand the effectiveness of the work, but also signal the problems on the site. For example, thanks to the conversion report in IE, we learned that JS works “a little” incorrectly - half of the users stopped getting to the goal.

There are goals, there are initial data - into battle! Let's look at the tools that will help in this matter.
The metric provides some cool tools for in-page analytics, allowing you to understand what is stopping the user from sorting out a particular page.
Form analytics is one of the main tools for online stores and services with non-trivial registration (although it is in itself wrong, but sometimes necessary). The tool shows how many users started filling out the form, how many reached the end and where the majority stopped. Great stuff, allows programmers to give hands and make forms more humane.
Click Map - where your users actually click, what they are interested in and how they use your navigation.
Scrolls map - it is immediately clear to what height the page “works”. The more content in the blind zone - the more you need to fix.
Map of paths on the site - allows you to understand how the user comes to the site, where he goes and how many steps to the goal is lost on the way.
These tools work more for static-statistical analysis, when collecting primary data they need to be used over large intervals - a week, a month, this way you can identify all possible gags and illogical user behavior caused by page curvature.
An example of what we are working on right now is an incorrectly constructed main menu. Users do not want to "fly away for the holidays." They want interesting promotions and flexible search. And special offers, perhaps, deserve more attention. In the search form, it is noticeable how the definition of a city by IP works - the arrival city is changed much more often.

It is convenient to apply click cards without additional settings for pages like the main one. But what to do if your site has a large number of pages of the same type placed on different URLs, and yet you want to see the general picture of the behavior of users on these pages? Here comes to the rescue urlFilter , which is stated in the official documentation , to which, however, not everyone gets. Using the filter, you can group multiple pages into one. For example, we search all the search pages in Bukury into groups by city / airport of departure: / search / mow / rom / 2013-09-09 / 2013-09-15 / 1 / - / - / e / → / search / mow
Example setup code:
In the report, these pages will be visible with full URLs, but when you go to the player - the result will be common to all pages.
The next tool is a scrolling card. Consider again our main page.
By scrolling it is clear that the main page is done correctly. The main elements of the most popular laptops appear on the screen (note the column on the right - the redder, the more users see the page). If you see the same picture with your own, with clear boundaries of the number of views - this is an occasion to think about adding "beacons" that will push the user to scroll the page. We are just thinking.

The web visitor is a unique feature (it is also free!) Metrics. The web visitor was once a separate product, but in 2010 Yandex bought the code with the team and since 2011 this functionality has organically complemented the Metrics toolkit.
The web browser allows you to view all the actions of users in the record - clicking on links, filling out forms, jerking with a mouse (this is a separate funny bonus, which suggests that the user is sad and it would be nice to entertain him with useful information).
A web visitor comes into play after a page is found on which users fall off and you need to understand why the user has not found the right path to the goal.
Google is now reorienting Analytics from pure statistics to a platform for usability experiments and AB tests. The functionality is huge, there is even a book about 1500 pages about it.
We recently switched to Univeral Analytics, this is the future of Google Analytics. The previous version of tracking will not be updated if you use the old code - you need to update it. Not all Universal functions work correctly (they are now in the public beta), but the news is so pleasant that we did not delay the transition. The new Analytics works faster, provides greater limits, allows you to transfer your user ID, allows you to send requests from the backend, etc. In addition, Google’s new analytics capabilities will be implemented only in Universal Analytics.
We are interested in the conversion section

The last three points (Reverse Goal Path, Funnel Visuzlization and Goal Flow) provide an overall picture of what is happening on the site, even for very large projects.
In support of these points, with properly placed events, you can get a picture of the user passing through the site.
In our case, the diagram looks like this.
And now about the coolest and the freshest in GA - new opportunities for transferring events from the server and tracking any events happening “offline”!
On Buruki, we are looking for airline tickets for agencies, but we don’t sell anything ourselves, like Yandex.Market. The purchase occurs after the transition from us to the agent, we have no control over this process and cannot place our counter on the agent pages. After some time (sometimes minutes, sometimes hours) sales statistics come to us.
The problem is that with such a scheme of work it is not at all clear what kind of source brought the real sale.
Google solves this problem for us and for all who have a transaction going on offline.
Google has unified the interface for interacting with analytics servers. All requests go to the URL www.google-analytics.com/collect and accept the same set of parameters, regardless of whether we work on the frontend or backend. The only difference is that in js, we have a ready-made convenient wrapper function at our disposal, with which we can, for example, send events:
On the server side, the entire request is sent as POST payload encoded in form-urlencoded (line breaks in the example below are added for clarity):
The attentive reader will pay attention to the additional parameter cid - client ID. This is again a new feature in Universal Analytics. If earlier the definition of what a “visitor” was was the privilege of the analyst itself, then now we can manually specify our id. This is done on the burok: for each visitor we create a visitor, and accordingly send an ID to analytics. Thanks to this, we are able to accurately track the actions that take place after the user has left the site. In our case - this is an extract of the air ticket, which takes from 2 minutes to several hours.
For those who want to experience offline tracking, I leave a link to the official documentation .
This method can be used, for example, for conferences, stores or concerts - you distribute unique coupons on the site to users, and later you pull GA on events when the user reached a real institution and performed an action.
The conversion work is endless. As soon as a new section appears on the site, a new functionality or a cool special offer - you need to start working on improving usability, increasing conversion and simplifying the site.
An interesting fight and a beautiful victory!
PS If you already use offline analytics from Google - share your case in the comments. The topic is new, the potential is crazy.
PS We are looking for django-python in St. Petersburg - hantim.ru/jobs/21698-python-django-razrabotchik , respond or wait for letters to andrew.novoselsky@gmail.com!
We will review the public tools that we used to increase Buruk ’s conversion by 25% and make users a little happier. In the end - about the new product from Google Analytics, which allows you to link online traffic sources with offline conversion.
Work on increasing conversion consists of several stages. Which one is more important - you can’t tell right away, it’s important that the work is iterative and the information obtained at the previous iteration is used for the next one.
')
Easy conversion.
For this you need:
- understand what goals are on the site .
Goals can be at least two types - final and intermediate. With the ultimate goal, everything is clear: for an online store, this is a purchase, for Grupon, registration, etc. But on the way to this goal there can be many intermediate stages.
IMPORTANT! Your goals and goals of the user do not always coincide! A cool robust backend and a simple buying procedure are not synonymous! Think about the user and as a user. Even if he is inexperienced.
Our users want to go to Thailand, they dream to fly there (other dream destinations are Barcelona, Paris, Rome), they search for tickets many times, compare hotels, but only buy after a few months. In this case, the path from the intermediate to the final goal is stretched for a long time and this chain should be monitored.
- identify entry points and their differences.
Users who come from the search and regular visitors can expect different information from the service.
- go through all possible paths from the entrance to the goal.
But it is impossible to pass! Therefore, it is necessary to identify the most important ways and simplify them as much as possible.
- change and watch and poke a wand.
This is the most interesting, at this stage the first three stages are repeated in a circle, maximum information is collected, we rejoice at the results.
Description of tools for monitoring and making changes.
For Buruk, our main goals are the beginning of the search, the subscription to the newsletter, the transition to the agent from the search results and the most important, but postponed in time target - the purchase of a ticket. It became possible to track deferred targets quite recently and this is a very cool feature. How to use deferred conversion - at the end of the article.
After the goals are set, it is necessary to collect statistics of the initial conversion, we will dance from it and we will increase it. Depending on the number of goals, project attendance and the frequency of transactions, the initial data collection period can take from a couple of hours to a couple of weeks.
Placed goals will help not only to understand the effectiveness of the work, but also signal the problems on the site. For example, thanks to the conversion report in IE, we learned that JS works “a little” incorrectly - half of the users stopped getting to the goal.
There are goals, there are initial data - into battle! Let's look at the tools that will help in this matter.
Let's start with Yandex.Metrics
The metric provides some cool tools for in-page analytics, allowing you to understand what is stopping the user from sorting out a particular page.
Form analytics is one of the main tools for online stores and services with non-trivial registration (although it is in itself wrong, but sometimes necessary). The tool shows how many users started filling out the form, how many reached the end and where the majority stopped. Great stuff, allows programmers to give hands and make forms more humane.
Click Map - where your users actually click, what they are interested in and how they use your navigation.
Scrolls map - it is immediately clear to what height the page “works”. The more content in the blind zone - the more you need to fix.
Map of paths on the site - allows you to understand how the user comes to the site, where he goes and how many steps to the goal is lost on the way.
These tools work more for static-statistical analysis, when collecting primary data they need to be used over large intervals - a week, a month, this way you can identify all possible gags and illogical user behavior caused by page curvature.
An example of what we are working on right now is an incorrectly constructed main menu. Users do not want to "fly away for the holidays." They want interesting promotions and flexible search. And special offers, perhaps, deserve more attention. In the search form, it is noticeable how the definition of a city by IP works - the arrival city is changed much more often.
It is convenient to apply click cards without additional settings for pages like the main one. But what to do if your site has a large number of pages of the same type placed on different URLs, and yet you want to see the general picture of the behavior of users on these pages? Here comes to the rescue urlFilter , which is stated in the official documentation , to which, however, not everyone gets. Using the filter, you can group multiple pages into one. For example, we search all the search pages in Bukury into groups by city / airport of departure: / search / mow / rom / 2013-09-09 / 2013-09-15 / 1 / - / - / e / → / search / mow
Example setup code:
yaCounter.clickmap({ urlFilter: function(urlOrig) { var url = window.location.pathname.toLowerCase(), prefix = 'http://' + window.location.host; if (url.substr(0, 8) === '/search/') { return prefix + url.substr(0, 11); } // // ... return urlOrig; } }); In the report, these pages will be visible with full URLs, but when you go to the player - the result will be common to all pages.
The next tool is a scrolling card. Consider again our main page.
By scrolling it is clear that the main page is done correctly. The main elements of the most popular laptops appear on the screen (note the column on the right - the redder, the more users see the page). If you see the same picture with your own, with clear boundaries of the number of views - this is an occasion to think about adding "beacons" that will push the user to scroll the page. We are just thinking.
The web visitor is a unique feature (it is also free!) Metrics. The web visitor was once a separate product, but in 2010 Yandex bought the code with the team and since 2011 this functionality has organically complemented the Metrics toolkit.
The web browser allows you to view all the actions of users in the record - clicking on links, filling out forms, jerking with a mouse (this is a separate funny bonus, which suggests that the user is sad and it would be nice to entertain him with useful information).
A web visitor comes into play after a page is found on which users fall off and you need to understand why the user has not found the right path to the goal.
Now a little about GA
Google is now reorienting Analytics from pure statistics to a platform for usability experiments and AB tests. The functionality is huge, there is even a book about 1500 pages about it.
We recently switched to Univeral Analytics, this is the future of Google Analytics. The previous version of tracking will not be updated if you use the old code - you need to update it. Not all Universal functions work correctly (they are now in the public beta), but the news is so pleasant that we did not delay the transition. The new Analytics works faster, provides greater limits, allows you to transfer your user ID, allows you to send requests from the backend, etc. In addition, Google’s new analytics capabilities will be implemented only in Universal Analytics.
We are interested in the conversion section
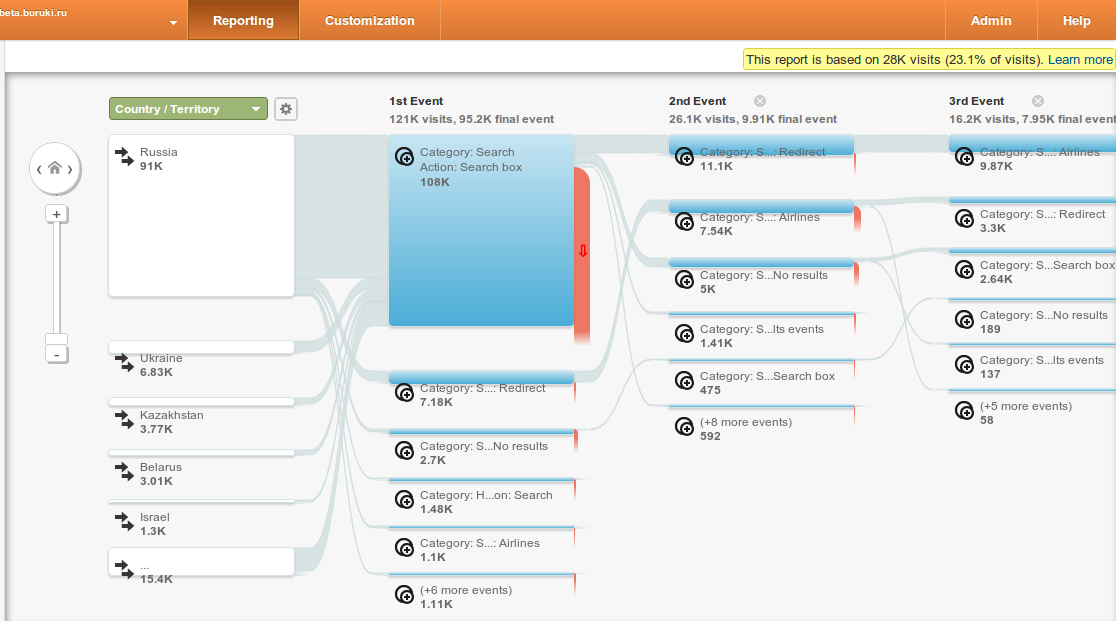
The last three points (Reverse Goal Path, Funnel Visuzlization and Goal Flow) provide an overall picture of what is happening on the site, even for very large projects.
In support of these points, with properly placed events, you can get a picture of the user passing through the site.
In our case, the diagram looks like this.
And now about the coolest and the freshest in GA - new opportunities for transferring events from the server and tracking any events happening “offline”!
On Buruki, we are looking for airline tickets for agencies, but we don’t sell anything ourselves, like Yandex.Market. The purchase occurs after the transition from us to the agent, we have no control over this process and cannot place our counter on the agent pages. After some time (sometimes minutes, sometimes hours) sales statistics come to us.
The problem is that with such a scheme of work it is not at all clear what kind of source brought the real sale.
Google solves this problem for us and for all who have a transaction going on offline.
Google has unified the interface for interacting with analytics servers. All requests go to the URL www.google-analytics.com/collect and accept the same set of parameters, regardless of whether we work on the frontend or backend. The only difference is that in js, we have a ready-made convenient wrapper function at our disposal, with which we can, for example, send events:
// analytics.js ga('create', 'UA-XXXX-Y'); ga('send', 'event', 'category', 'action', 'label', value); On the server side, the entire request is sent as POST payload encoded in form-urlencoded (line breaks in the example below are added for clarity):
POST / collect HTTP / 1.1
Host: www.google-analytics.com
v = 1
& tid = UA-XXXX-Y
& cid = 555
& t = event
& ec = category
& ea = action
& el = label
& ev = value
The attentive reader will pay attention to the additional parameter cid - client ID. This is again a new feature in Universal Analytics. If earlier the definition of what a “visitor” was was the privilege of the analyst itself, then now we can manually specify our id. This is done on the burok: for each visitor we create a visitor, and accordingly send an ID to analytics. Thanks to this, we are able to accurately track the actions that take place after the user has left the site. In our case - this is an extract of the air ticket, which takes from 2 minutes to several hours.
For those who want to experience offline tracking, I leave a link to the official documentation .
This method can be used, for example, for conferences, stores or concerts - you distribute unique coupons on the site to users, and later you pull GA on events when the user reached a real institution and performed an action.
The conversion work is endless. As soon as a new section appears on the site, a new functionality or a cool special offer - you need to start working on improving usability, increasing conversion and simplifying the site.
An interesting fight and a beautiful victory!
PS If you already use offline analytics from Google - share your case in the comments. The topic is new, the potential is crazy.
PS We are looking for django-python in St. Petersburg - hantim.ru/jobs/21698-python-django-razrabotchik , respond or wait for letters to andrew.novoselsky@gmail.com!
Source: https://habr.com/ru/post/189280/
All Articles