JavaScript tracing, debugging, profiling - filling gaps
For years, I used Chrome DevTools, Firebug, and even Opera Dragonfly to debug, trace, and profile my JavaScript code. I note that I used these great tools not only to work with JavaScript, but also to track network events, debug CSS, work with the DOM.
However, sometimes I ended up in certain zones of alienation, in which the above tools could not help me for certain reasons, but I would like to.

')
So it turns out that I often look through JavaScript code with which I am not very familiar, if I am at all familiar. For example, I simply study third-party code for general development, trying to understand how some jQuery extension works that does not want to work as I expected, correct bugs, familiarize myself with the MVC code of the framework that I want to understand better, review the code of my project colleagues, sometimes even my own code, which forgot how it works (I hope not the only one). It so happens that even finding a place from which its fascinating journey into this code (broken into many files, minified in some places, often tangled) turns out to be a puzzle.
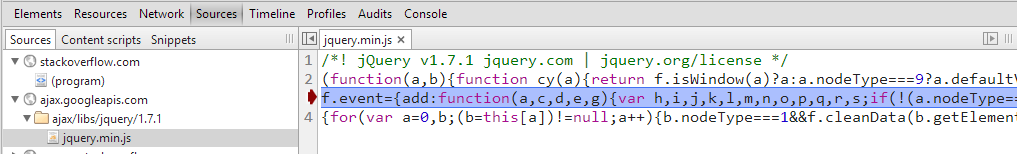
After a cursory examination and the realization that the humble contemplation of the kilobyte source is not particularly productive, I run the code. Inspired by putting a breakpoint in some familiar place, I lose my temper a bit when I once again get into the debugger in the minified jQuery (and who doesn’t lose heart?), I get annoyed when I once again step in the debugger through the necessary piece of code, I frantically jump over cycles to I’m not stuck there for a thousand iterations, holding my breath, putting conditional breakpoints, apathetically pressing F11 again and again in fear of missing something important. Sounds familiar?
In certain cases, the console also comes to the rescue, but everyone probably remembers that “magical” feeling when you forget to delete console.log (or, God forgive me, alert) before the commit. Fortunately, jshint comes to the rescue of some people here, which unobtrusively reminds. It can be worse, you think that the console comes to the rescue, but you get the soulless “console is undefined”. If you have not had this, then you are either lucky or new.
What about crazy Heisenbag ? The bug is running, F12 is pressed, the breakpoints are set with unmistakable accuracy and cold calculation by a professional hunter, the steps described are completed, and the bug, like it never was?
I do not even want to start a sad song about errors reproduced only in certain browsers / devices / platforms where there is no saving DevTools. No, sometimes (though not always) alternatives are available, often no longer supported, heavyweight, difficult to install and use, and not having exactly the functionality you need. Yes old versions of IE, I am looking at you . In fairness, despite the fact that the witch hunt is always fun, not only the old versions of IE are sinful. Creating an environment for debugging on mobile devices is no less sad (specific platform requirements, simulators, additional software, SDK, device configuration, etc.) - Androind , iPnone .
Finally, performance profiling. With the help of the excellent JsPerf service, it is possible to view other people’s browsers for different browsers or to drive your optimization ideas, this is when there are ideas. Chrome DevTools and Firebug have built-in profilers that take exact numbers from the V8 and SpiderMonkey engines, respectively, but I have never been comfortable using the interface, where these numbers are presented, did not like the fact that you need to turn on profiling all the time and you can’t just turn it on once and to always have it turned on by default, the insertion of console.profile / console.time into the code (and especially forgetting to remove them) also was never fun.
Considering the above, once I got the idea - it would be nice to have a tool that solves at least some of the aforementioned problems and:
If the above problems and suggestions for solving them are not close to you, then you probably don’t need to read further, as there will be what can be called advertising (albeit free at the moment) product.
I am glad if I have not lost you after the advertising disclaimer. As with most of my colleagues, I’ve imposed an old programmer spell “writing a tool in a short list,” therefore, please welcome spy-js, a new JavaScript tool designed to fill in the gaps of existing tools, look at debugging, profiling, tracing with another corner. The project is in beta stage, but the beta version already knows how most of the wish list sounded above. The general direction of development is not to replace the capabilities of existing DevTools / Firebug, but to provide an alternative solution to the problems and fill in the possible gaps of these tools.
Spontaneously obeying following the Atwood law, that everything that can be written in JavaScript will be written on it, spy-js is mainly written in the language for which it is written (ek, wrapped).
Architecturally, spy-js is a nodejs web application and browser client. How it works: the browser in which the page with the scripts to be traced will be loaded is configured to use a proxy server (nodejs web application). The web application proxies the requests and, if the requested resource is a JavaScript file, modifies it before sending it back to the browser. Modifying a file is an insertion of instructional instructions . When the modified code is executed in the browser, information about its execution is sent back to the server, which after processing becomes available in the spy-js user interface, where you can watch the events occurring in almost real time.
The project would never have been completed without the use of wonderful open source projects, such as: nodejs, esprima, express, grunt, socket.io, jQuery, knockout.js, underscore, ace, bootstrap. Not all projects used are listed.
The free beta version of spy-js is currently available for download at http://spy-js.com . The source code of the project itself is not open. Documentation, configuration examples, the ability to start bugs, ask questions, and so on, are currently done using the open github repository. Questions can also be asked on stack overflow with the spy-js tag.
At this stage, my financial investments in the project are not so great, I work on it most of my free time. My plan is to continue developing to the stage when / if I can offer paid licenses and invest more time / support / finance into the product with the help of feedback from those who find the tool useful.
I am sincerely grateful for any support, suggestions, feedback, dissemination of information about the project. It really inspires and helps me do what I do. I hope with your help I can contribute to the development of JavaScript toolkit.
However, sometimes I ended up in certain zones of alienation, in which the above tools could not help me for certain reasons, but I would like to.
')
So it turns out that I often look through JavaScript code with which I am not very familiar, if I am at all familiar. For example, I simply study third-party code for general development, trying to understand how some jQuery extension works that does not want to work as I expected, correct bugs, familiarize myself with the MVC code of the framework that I want to understand better, review the code of my project colleagues, sometimes even my own code, which forgot how it works (I hope not the only one). It so happens that even finding a place from which its fascinating journey into this code (broken into many files, minified in some places, often tangled) turns out to be a puzzle.
After a cursory examination and the realization that the humble contemplation of the kilobyte source is not particularly productive, I run the code. Inspired by putting a breakpoint in some familiar place, I lose my temper a bit when I once again get into the debugger in the minified jQuery (and who doesn’t lose heart?), I get annoyed when I once again step in the debugger through the necessary piece of code, I frantically jump over cycles to I’m not stuck there for a thousand iterations, holding my breath, putting conditional breakpoints, apathetically pressing F11 again and again in fear of missing something important. Sounds familiar?
In certain cases, the console also comes to the rescue, but everyone probably remembers that “magical” feeling when you forget to delete console.log (or, God forgive me, alert) before the commit. Fortunately, jshint comes to the rescue of some people here, which unobtrusively reminds. It can be worse, you think that the console comes to the rescue, but you get the soulless “console is undefined”. If you have not had this, then you are either lucky or new.
What about crazy Heisenbag ? The bug is running, F12 is pressed, the breakpoints are set with unmistakable accuracy and cold calculation by a professional hunter, the steps described are completed, and the bug, like it never was?
I do not even want to start a sad song about errors reproduced only in certain browsers / devices / platforms where there is no saving DevTools. No, sometimes (though not always) alternatives are available, often no longer supported, heavyweight, difficult to install and use, and not having exactly the functionality you need. Yes old versions of IE, I am looking at you . In fairness, despite the fact that the witch hunt is always fun, not only the old versions of IE are sinful. Creating an environment for debugging on mobile devices is no less sad (specific platform requirements, simulators, additional software, SDK, device configuration, etc.) - Androind , iPnone .
Finally, performance profiling. With the help of the excellent JsPerf service, it is possible to view other people’s browsers for different browsers or to drive your optimization ideas, this is when there are ideas. Chrome DevTools and Firebug have built-in profilers that take exact numbers from the V8 and SpiderMonkey engines, respectively, but I have never been comfortable using the interface, where these numbers are presented, did not like the fact that you need to turn on profiling all the time and you can’t just turn it on once and to always have it turned on by default, the insertion of console.profile / console.time into the code (and especially forgetting to remove them) also was never fun.
Considering the above, once I got the idea - it would be nice to have a tool that solves at least some of the aforementioned problems and:
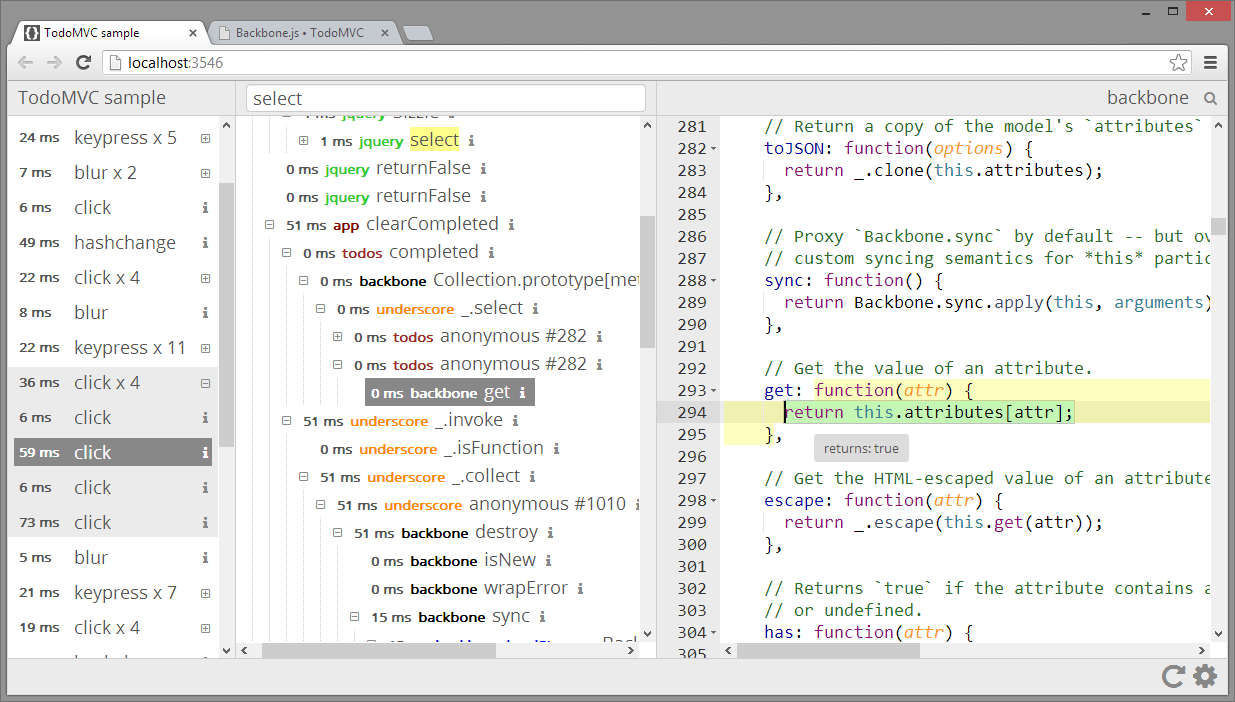
- allows you to see what events are happening in the code right now, open the call tree and the highlighted code execution path
- allows you to filter scripts and events and monitor only what I am interested in at the moment
- allows you to execute certain scripts in the application and then analyze what happened, including access to the data at the time of execution
- allows you to trace, debug, profile code in any browser / device / platform
- allows you to quickly, conveniently and constantly see the performance of functions, immediately see what can be lost from the recently added one, speeding up to support decision-making on what exactly you can try to optimize
- allows you to see highlighted let the execution of a specific script
- allows you to study unfamiliar code, analyzing the process of its implementation
If the above problems and suggestions for solving them are not close to you, then you probably don’t need to read further, as there will be what can be called advertising (albeit free at the moment) product.
I am glad if I have not lost you after the advertising disclaimer. As with most of my colleagues, I’ve imposed an old programmer spell “writing a tool in a short list,” therefore, please welcome spy-js, a new JavaScript tool designed to fill in the gaps of existing tools, look at debugging, profiling, tracing with another corner. The project is in beta stage, but the beta version already knows how most of the wish list sounded above. The general direction of development is not to replace the capabilities of existing DevTools / Firebug, but to provide an alternative solution to the problems and fill in the possible gaps of these tools.
Spontaneously obeying following the Atwood law, that everything that can be written in JavaScript will be written on it, spy-js is mainly written in the language for which it is written (ek, wrapped).
Architecturally, spy-js is a nodejs web application and browser client. How it works: the browser in which the page with the scripts to be traced will be loaded is configured to use a proxy server (nodejs web application). The web application proxies the requests and, if the requested resource is a JavaScript file, modifies it before sending it back to the browser. Modifying a file is an insertion of instructional instructions . When the modified code is executed in the browser, information about its execution is sent back to the server, which after processing becomes available in the spy-js user interface, where you can watch the events occurring in almost real time.
The project would never have been completed without the use of wonderful open source projects, such as: nodejs, esprima, express, grunt, socket.io, jQuery, knockout.js, underscore, ace, bootstrap. Not all projects used are listed.
The free beta version of spy-js is currently available for download at http://spy-js.com . The source code of the project itself is not open. Documentation, configuration examples, the ability to start bugs, ask questions, and so on, are currently done using the open github repository. Questions can also be asked on stack overflow with the spy-js tag.
At this stage, my financial investments in the project are not so great, I work on it most of my free time. My plan is to continue developing to the stage when / if I can offer paid licenses and invest more time / support / finance into the product with the help of feedback from those who find the tool useful.
I am sincerely grateful for any support, suggestions, feedback, dissemination of information about the project. It really inspires and helps me do what I do. I hope with your help I can contribute to the development of JavaScript toolkit.
Source: https://habr.com/ru/post/188708/
All Articles