Intel Power Monitoring Tool - on guard energy efficiency
 We continue to talk about the energy efficiency of mobile devices and Intel applications for Android . Today's post concerns both topics at the same time, because it will be about the Intel Power Monitoring Tool (Intel PMT) program - a tool that allows you to audit the resources consumed both by the system as a whole and by a separate application. Intel PMT may be interesting to curious Android users who want to know everything about their system, but is addressed primarily to developers and serves as a means of diagnosing problems that are not visible to the naked eye.
So, the Intel Power Monitoring Tool is an Android data profiling tool related to power consumption and performance. With a user-defined interval, the application records the effective values of four dozen key operating system indicators (the number of dozens strongly depends on the number of processor cores, since it is he who is in the center of attention of the utility). Among these values you will find the parameters:
- Batteries - state, voltage, current, power consumed / received power, remaining capacity;
- CPU - the frequency and utilization of each core, CPU P state residency and CPU C state residency;
- Display - status, backlight brightness
- Wi-Fi and 3G Interfaces - Transmission Rate in Packets and Bit
- External and internal storage devices - write and read speed
 The application interface is harsh and not overloaded with any design. The controls are exhausted with just a few buttons that implement the most necessary. You can start the recording process (it goes in the background) and stop it; display the results on the display or the system status bar; send the program log by mail. Finally, a separate button initiates monitoring of a specific application, the name of which, in the best traditions of console utilities, is entered manually.
The output of the results is even simpler: no graphical representations of data, only text format, only hardcore! Perhaps this approach is justified, because professional developers do not need color music, but a stream of digital data, which can then be processed in a database or spreadsheet editor. On the other hand, unaccustomed to such austerity looks excessive - it was possible to turn on visualization at least as an option.
The program writes its log in text format, it can be obtained through a connection to a PC or via e-mail - the corresponding button is in the interface. Each line of the log has the following form:
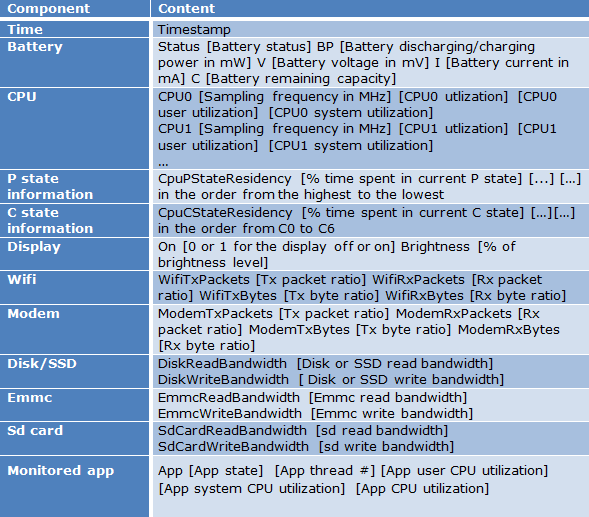
07:40:21 Status Charging BP 406.30 V 3833 I 106 C 692 CPU0 900 27.00% 17.00% 10.00% CPU1 900 42.00% 39.00% 3.00% CpuPStateResidency 0.00% 1.01% 13.13% 85.86% 0.00% CpuCStateResidency 0.01% 3.44% 41.49% 11.09% 43.98% 0.00% 0.00% On 1 Brightness 15.00% WifiTxPackets 0 WifiRxPackets 0 WifiTxBytes 0 WifiRxBytes 0 ModemTxPackets 0 ModemRxPackets 0 ModemTxBytes 0 ModemRxBytes 0 DiskReadBandwidth 0.00 DiskWriteBandwidth 0.00 EmmcReadBandwidth 0.00 EmmcWriteBandwidth 6.00 SdCardReadBandwidth 0.00 SdCardWriteBandwidth 0.00 youtube PID 3858 AppState 83 AppNumOfThreads 48 AppCpuUserUtil 21.00 AppCpuSystemUtil 2.00 AppCpuUtil 23.00
What each field means, you can find out from the table.

')
The last section of the log refers to the monitored application, in this example it is a YouTube client.
How can Intel Power Monitoring Tool be used for developer needs? Let's give with abbreviations an example from the article devoted to the tool from the Intel site.
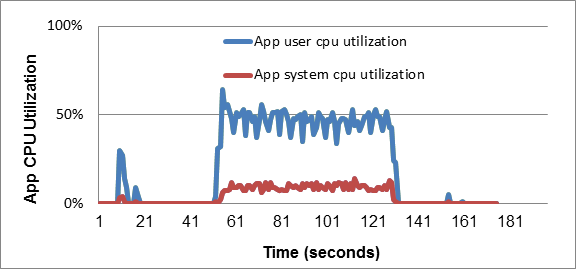
Suppose Mark is an Android mobile application developer. He developed an application for reading books called EReader. He would like to find out if his application has serious problems with power consumption and performance. For this, he decided to use the Power Monitoring Tool. Studying the data, he draws attention to the fact that the total CPU usage and CPU utilization by the application almost reaches 100% without any user actions. He decides to check the profiling data to see if this is a problem. It retrieves the Power Monitoring Tool data and builds CPU utilization graphs by the user application and the system, as shown in the following figure. In this figure, the CPU load by a user application reaches 50%, which means that the application fully uses one core to execute code in user space.
Thanks to data received from the Power Monitoring Tool by the application of the processor by the application, Mark determines that the maximum processor load is at the time of opening the book. Mark guesses that this may be caused by a piece of code opening the e-book. He checks this piece of code and finds an error in it in the form of an infinite loop.
Despite some wooden interface, Intel Power Monitoring Tool may be a convenient tool for those developers who meticulously monitor the energy efficiency of their applications. Unfortunately, the application has not been updated for quite a long time (more than a year), which leads to some incompatibility with the new hardware (the program honestly reports at launch). However, in the case of our test smartphone Orange AZ210A, incompatibility has manifested itself only in the absence of evidence from the Wi-Fi interface. The Intel PMT application runs on Android 2.3 and higher on the Intel Atom platform.
Source: https://habr.com/ru/post/188420/
All Articles
