Apache Mahout. Metrics for determining user similarities
Hey.
I read the book Mahout in Action. Faced the effect of “looking into a book - I see a fig.” To eliminate it decided to take notes.
Apache Mahout is a library for working with machine learning algorithms that can be used as an add-on to Hadoop or independently. The library implements the methods of collaborative filtering , clustering and classification .
We consider a recommender system based on collaborative filtering. It can be user-based or property-oriented (item-based).
One of the basic concepts of user-oriented recommender systems is a metric for determining user similarity. Suppose that we have data on the views and scores of films by different users. We will compare two users: X and Y. They rated the films X (x 1 , x 2 , ..., x n ) and Y (y 1 , y 2 , ..., y m ) , where n , m is the number of ratings given by the first and second users, respectively. N is the number of ratings that were given by both users to the same films (the intersection of the sets of films watched by the first and second). We assume that (x i , y i ) is a pair of ratings submitted by users of the same film.
Mahout implements metrics based on several algorithms. I describe the algorithms themselves, not their implementations in Mahout.
')
In brackets I will mark the chapter in the book “Mahout in Action” Owen, Anil, Dunning, Friedman .
The implementation in Mahout is PearsonCorrelationSimilarity .
Pearson's correlation coefficient is the number K (-1 ≤ K ≤ 1) , which shows the tendency of two sets of numbers, going in pairs, to be similar. Those. to form an almost linear relationship between the numbers of the first and second sets. x i = By i (for all i B will be about the same). If the dependence is linear, then the correlation coefficient is 1, if the inverse is -1, if there is no dependence, then 0.
Calculated by the formula:
Right vector entry.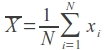 - average. So we center the data. When calculating manually, this should be taken into account, but the implementation of the correlation in Mahout takes care of this on its own.
It is logical to assume that two users who watched 200 of the same films are more similar even if they gave different ratings than two users who watched three of the same films and gave them the same ratings. But from the formula we get the opposite result.
The second drawback is the impossibility of calculating the correlation for users who have only one assessment (since the denominator will be zero).
The coefficient is also not defined for those cases where one of the users gave the same rating to all films. For example, the user watched 3 films and gave them all a rating of 5. Again, the denominator is zero.
In order to eliminate the first disadvantage introduced the concept of weight correlation. If many parameters are used for counting, then the positive correlation is multiplied by 1, and the negative correlation by -1. So If a large number of similar films have been viewed but with opposite evaluations, then the correlation will be positive.
It can also be multiplied by a number less than 1, if few parameters were used to calculate the coefficient, thus reducing the user similarity.
Implementation in Mahout - EuclideanDistanceSimilarity .
The implementation is to find the distance between users. Users act as points in a multidimensional space with coordinates, estimates. Only ratings given by both users in the film are taken into account.
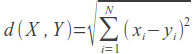
The smaller the distance, the tastes of users are more similar. Therefore, the metric implemented in Mahout returns K = 1 / (1 + d) . Unlike the previous metric, this one takes a value from 0 to 1. The greater the coefficient, the more similar the tastes of users.
The disadvantage of this metric is that users who rate one movie equally (there are no other common movies) will be more similar than those that rate a hundred films almost the same.
Implementing in Mahout - using PearsonCorrelationSimilarity .
It is the cosine of the angle between two lines formed by the point O (0,0, ...) and the user points X (x 1 , x 2 , ...) , Y (y 1 , y 2 , ...) .
-1 ≤ cos A ≤ 1 . If the angle is A = 0 (cos A = 1) , then the users are similar. If the angle is A = 180 (cos A = -1) , then the tastes of the users are opposite. If the angle is close to 90 degrees - there is no dependence between the preferences of these two users. More information about the cosine coefficient ...
Mahout has no special implementation for this metric, using the Pearson correlation metric to calculate. Manual calculation can be made according to the formula below. The vector record on the right differs from the Pearson correlation only in that we do not center the coordinates.

Implementation in Mahout - SpearmanCorrelationSimilarity .
Spearman's correlation coefficient is defined as the Pearson correlation coefficient between ranked variables. The least preferred film is rated 1, the next 2, etc. After setting all the estimates, the Pearson correlation coefficient is calculated.
The disadvantage of this metric is slow work. Indeed, before calculating the correlation coefficient, it is necessary to conduct rankings. In addition, the metric has the disadvantages of the Pearson metric.
Implementation in Mahout - TanimotoCoefficientSimilarity .
The Tanimoto coefficient is the ratio of the numbers filled by both the first and second users (intersection) to the number of all properties of the first and second (union): K = I / U. This metric is recommended to be used in cases when the values of preferences are Boolean.
Implementation in Mahout - LogLikelihoodSimilarity .
The algorithm for calculating the metric is not quite clear intuitively, unlike the previous ones.
Let n films be watched by the first user, m is the second, p is watched by two users in the sum (union).

* - the film is not rated by the user (or not viewed). equal to 1 if the film is rated, 0 otherwise.


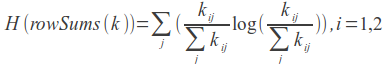
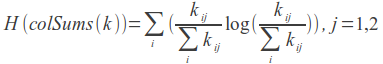
LLR = 2 (H (k) - H (rowSums (k)) - H (colSums (k))) - log-likelihood coefficient.
More about this algorithm: formulas , implementation .
I would be glad if someone come in handy. About errors we write in a personal, and trolls in comments.
I read the book Mahout in Action. Faced the effect of “looking into a book - I see a fig.” To eliminate it decided to take notes.
Apache Mahout is a library for working with machine learning algorithms that can be used as an add-on to Hadoop or independently. The library implements the methods of collaborative filtering , clustering and classification .
We consider a recommender system based on collaborative filtering. It can be user-based or property-oriented (item-based).
Collaborative filtering is one of the methods for constructing forecasts using known preferences (estimates) of a group of users to predict the unknown preferences of another user. Its basic assumption is as follows: those who have equally evaluated any items in the past tend to give similar marks to other items in the future. (from wikipedia)
One of the basic concepts of user-oriented recommender systems is a metric for determining user similarity. Suppose that we have data on the views and scores of films by different users. We will compare two users: X and Y. They rated the films X (x 1 , x 2 , ..., x n ) and Y (y 1 , y 2 , ..., y m ) , where n , m is the number of ratings given by the first and second users, respectively. N is the number of ratings that were given by both users to the same films (the intersection of the sets of films watched by the first and second). We assume that (x i , y i ) is a pair of ratings submitted by users of the same film.
Mahout implements metrics based on several algorithms. I describe the algorithms themselves, not their implementations in Mahout.
')
Pearson's correlation coefficient (4.3.1)
In brackets I will mark the chapter in the book “Mahout in Action” Owen, Anil, Dunning, Friedman .
The implementation in Mahout is PearsonCorrelationSimilarity .
Pearson's correlation coefficient is the number K (-1 ≤ K ≤ 1) , which shows the tendency of two sets of numbers, going in pairs, to be similar. Those. to form an almost linear relationship between the numbers of the first and second sets. x i = By i (for all i B will be about the same). If the dependence is linear, then the correlation coefficient is 1, if the inverse is -1, if there is no dependence, then 0.
Calculated by the formula:
Right vector entry.
- average. So we center the data. When calculating manually, this should be taken into account, but the implementation of the correlation in Mahout takes care of this on its own.Metric problems for Pearson correlation (4.3.2)
It is logical to assume that two users who watched 200 of the same films are more similar even if they gave different ratings than two users who watched three of the same films and gave them the same ratings. But from the formula we get the opposite result.
The second drawback is the impossibility of calculating the correlation for users who have only one assessment (since the denominator will be zero).
The coefficient is also not defined for those cases where one of the users gave the same rating to all films. For example, the user watched 3 films and gave them all a rating of 5. Again, the denominator is zero.
Correlation Weight (4.3.3)
In order to eliminate the first disadvantage introduced the concept of weight correlation. If many parameters are used for counting, then the positive correlation is multiplied by 1, and the negative correlation by -1. So If a large number of similar films have been viewed but with opposite evaluations, then the correlation will be positive.
It can also be multiplied by a number less than 1, if few parameters were used to calculate the coefficient, thus reducing the user similarity.
Euclidean metric (4.3.4)
Implementation in Mahout - EuclideanDistanceSimilarity .
The implementation is to find the distance between users. Users act as points in a multidimensional space with coordinates, estimates. Only ratings given by both users in the film are taken into account.
The smaller the distance, the tastes of users are more similar. Therefore, the metric implemented in Mahout returns K = 1 / (1 + d) . Unlike the previous metric, this one takes a value from 0 to 1. The greater the coefficient, the more similar the tastes of users.
The disadvantage of this metric is that users who rate one movie equally (there are no other common movies) will be more similar than those that rate a hundred films almost the same.
Cosine Coefficient (4.3.5)
Implementing in Mahout - using PearsonCorrelationSimilarity .
It is the cosine of the angle between two lines formed by the point O (0,0, ...) and the user points X (x 1 , x 2 , ...) , Y (y 1 , y 2 , ...) .
-1 ≤ cos A ≤ 1 . If the angle is A = 0 (cos A = 1) , then the users are similar. If the angle is A = 180 (cos A = -1) , then the tastes of the users are opposite. If the angle is close to 90 degrees - there is no dependence between the preferences of these two users. More information about the cosine coefficient ...
Mahout has no special implementation for this metric, using the Pearson correlation metric to calculate. Manual calculation can be made according to the formula below. The vector record on the right differs from the Pearson correlation only in that we do not center the coordinates.
Spearman's correlation coefficient (4.3.6)
Implementation in Mahout - SpearmanCorrelationSimilarity .
Spearman's correlation coefficient is defined as the Pearson correlation coefficient between ranked variables. The least preferred film is rated 1, the next 2, etc. After setting all the estimates, the Pearson correlation coefficient is calculated.
The disadvantage of this metric is slow work. Indeed, before calculating the correlation coefficient, it is necessary to conduct rankings. In addition, the metric has the disadvantages of the Pearson metric.
Tanimoto coefficient (4.3.7)
Implementation in Mahout - TanimotoCoefficientSimilarity .
The Tanimoto coefficient is the ratio of the numbers filled by both the first and second users (intersection) to the number of all properties of the first and second (union): K = I / U. This metric is recommended to be used in cases when the values of preferences are Boolean.
Log-likelihood (4.3.8)
Implementation in Mahout - LogLikelihoodSimilarity .
The algorithm for calculating the metric is not quite clear intuitively, unlike the previous ones.
Let n films be watched by the first user, m is the second, p is watched by two users in the sum (union).
* - the film is not rated by the user (or not viewed). equal to 1 if the film is rated, 0 otherwise.
LLR = 2 (H (k) - H (rowSums (k)) - H (colSums (k))) - log-likelihood coefficient.
More about this algorithm: formulas , implementation .
I would be glad if someone come in handy. About errors we write in a personal, and trolls in comments.
Source: https://habr.com/ru/post/188350/
All Articles