Readers of the article about Opera use Opera browser 4 times more often.
British scientists have recently established a remarkable fact that, despite the low popularity of the Opera browser in recent days, articles are read using it, and the more often the more facts about Opera are mentioned in these articles. Scientists still find it difficult to explain this phenomenon, mentioning only the existence of the proverb "The trouble does not come alone." Similarly, here, related words are attracted, and the Opera browser appears most often where people talk about it.
Leaving aside the hard work of the scientists of the minds on the newly discovered mystery of nature, let us take up the task of a simpler and more mundane task - let's see what tools these amazing results are obtained . Perhaps looking at their work, amazing discoveries also lie ahead.
Scientists have used the Yandex metrics service, substituting a picture from it into one of the many comments on the page with the article and comparing with similar comments ordinary, non-Opera articles. Further, going to the pages of public access to browser statistics "Opera - non-Opera",
... they made this discovery.
After the news to attract attention, let's see what really happened.
')
Readers of the Habr site are interested in statistics about other readers . No, no, yes, and there will be articles that fill the gap with a lack of information on visitors' browsers, from the OS, attendance frequency and other interesting characteristics, which, looking at the flow of articles, you can guess, but you can not see in the graphs. Site owners keep statistics, but revealing it means sharing a competitive advantage in planning visitor flows. It is not by chance that everyone has data on visits, but not all site owners tend to share them. The site shows its statistics on a special page, but it is a very general plan. At the same time, I would like to know what could be obtained from the logs of typical pages, without pretending to commercial data.
To do this, a study of a dozen other articles was conducted using open and free Yandex Yandex metrics counters. Organizing your own counters and calculations is obviously a task of a different level of technical complexity, which does not correspond to a light interest in user-user agents, and the Yandex Metric solves most idle questions quite well, producing beautiful graph images.
The main answers given by the graphs turned out like this.
Interesting to know all this? Go.
In order to compare the resulting charts with the statistics of browsers on average in Russia and around the world, we will look at the publications made in various articles. Looking at the cardinal differences in browser composition in different years and even months, regular readers of this topic are not surprised - each factor and number has its own rationale and reason. Just give a list of links, so as not to search for them by topic.
* Yandex metrics statistics for January 2013 - www.pcbee.ru/browsers/top-browsers-2013.html ;
* webrowser.ru/rynok/statistika-internet-brauzerov-v-aprele-2013-goda.html - Statcounter and Net Application statistics on the world and Liveinternet in Russia for April 2013; few comments;

* Browser usage statistics in RUnet for June 2013 - OpenStat, LiveInternet, HotLog: alexvaleev.ru/browserstat/index.php?type=month&year=2013&month=6

We will determine the statistics of which typical articles we would like to see in order to compare its differences. Select the conditional categories of articles:
Thematic programming and web technologies
There are many other topics on which I would like to see the statistics, but you can not embrace the immense.
As a joke, you can determine the correlation between the subject of articles and the composition of browser browsers. This is very technological - based on the choice of readers to determine which category an article belongs to, having made thousands of measurements of page visits in advance. There are also easier ways to check the article for keywords. But the difference is that people vote with browsers, and the parser is engaged in word recognition, the answer of which depends on the success of the recognition program implementation.
Therefore, despite the absurdity of thousands of measurements against one, 6 (six) counters were placed for different categories of articles. 5 counters are connected by 1 article, characteristic for the selected category, and one is connected to several (6) technical plan items in order to get average statistics.
Placed - and wait, with what browsers and OS visitors will begin to come. By the way, the Yandex-metric, according to its own intelligence, can show at the same time the gender and age of readers, which can also be used in categorization.
To divide articles into categories in some constructive way is quite basic and urgent need of readers. Of course, powerful classifiers in the form of hubs and tags have been created for this purpose. You can additionally find out which authors on which topics most often write and analyze keywords. But the dependence of browsers, OS, gender and age of readers is also an interesting topic, especially for British scientists.
Therefore, perhaps, the initiative will find further support, and other readers will continue the tradition of categorizing articles, and in a month we will be able to look at the new results. Only one thing is important - that the placement of tags corresponds to the planned categories.
The collected statistics will work for one more useful business, therefore it is not entirely “empty fun” - by reading activity we will be able to get a graph of the intensity of viewing articles depending on the hour, day of the week and time from the start of publication and finding the article in zahabrenny, on the main and among the best. In fact, the statistics were collected specifically for these purposes, and not for the discoveries of British scientists.
But this other matter will be thoroughly calculated in another article in order to find out the real price of the estimates in the comments of the articles.
For this review, statistics was collected on articles of different categories (links lead to open statistics on the specified groups of articles):
one.
Six articles of different popularity on the themes of scripts and developments :
/ post / 186362 / - 28tys. views - “Leveling debian / ubuntu servers for small ones. Part 1"
/ post / 186410 / - 15 thousand. Views - “Evidence-Based Planning” (translated by J. Spolsky)
/ post / 186198 / - 12 thousand. views - "9 signs that you should not hire this Web developer" (from the table)
/ post / 186202 / - 14tys. views - "Compression of data during transmission from the browser to the server"
/ post / 186200 / - 9tys. views - “Do not be afraid of bicycles. Or another Grand Central Dispatch (GCD) in C ++ 11 ”
/ post / 186218 / - 3 thousand. views - "Understanding Node.js"
- a total of 95 thousand views on the metrics counter, 85 thousand visitors.
Statistics on them shows the overall picture of visitors to the site with a bias on articles on programming and technology. From this average statistics, you can judge the browsers and OS of the average user with such interests. In particular, it can be used as a standard for comparison with other statistics.
If we look at the statistics from other articles - news, cosmonautics, scandalous laws, then there will be several other visitors on them. It is unlikely that such knowledge will be useful or will greatly go beyond the limits of error. But it will still be interesting to compare - how different are browsers and reader-developer systems from all those who don’t discover technical articles, including the same reader-developers to a lesser extent.
2
Qualitatively about Mars :
/ post / 185846 / - 51 thousand. views - "Curiosity goes on a journey of a year long"
What is the difference between lovers of high-quality information about Mars and visitors to feature articles? The statistics of this counter is trying to answer this question.
3
From the developer company about Opera :
/ company / opera / blog / 186210 / - 30 thousand. views - "Ctrl + Z for Ctrl + D" - about plans for Opera for computers from the project manager. Expressive bias in the statistics of browsers that interested British scientists.
four.
Scandalous laws and public interest :
/ post / 185844 / - 64 thousand. views - "The blocking script, the second act. Voting on the ROI.
This is not a popular first article on this topic, but still it should show a collection of just such a contingent of readers who will not pass by the problems of the Network and at the same time will not necessarily be developers.
five.
Sample fictional news :
/ post / 186392 / - on data security (“Kim Dotcom (Mega, Megaupload) is going to launch an interception-proof email and e-mail”, 17000 views, 52 comments) - data on data security, which collects readers of popular messages.
6
A sample of interesting conversations :
/ post / 186452 / - conversations in the comments (“What would you do if ...?”, 31 thousand views, 400 comments). Monitoring a wide variety of developer visitors who are inclined to talk in comments about their interests. It is interesting because more people may come here again to read comments and take part in conversations on pleasant topics. Therefore, the ratio of “views - visitors” compared to other statistics will be interesting.
The number of views here is indicated at the time of writing the article, on average 3-4 days after the publication of the articles studied. This number in the caption for each article will increase over time and not correspond to the specified values.
Link Metrics statistics - open for everyone to see. But for fixing the described data at the time of publication of the article, screenshots of some graphs were made.
1. Statistics 6 subject articles.
What we see in the general statistics on thematic articles? A sample of several articles is to a large extent random and will differ by a percentage or more with broader averaging, and on some topics it will differ greatly, as we will see in the following categories in the Opera browser. Taking this remark into account, we will look at the list of browsers that were viewed 95 thousand times 6 pages of typical, moderately successful and moderately unsuccessful six articles in approximately the following ratio:
The observation lasted several days. The situation is similar with other articles. Per-minute monitoring from July 11 to July 17 shows characteristic bursts of viewability of 6 articles, 5 of which were published on Thursday-Friday, one - on Monday.
At the beginning of the publication, when the article is at the top of the tape or went to the first page of the tape “zahabrennye” (gained a rating of +8 or higher), its browsability reaches 60 hits per second, and this is not the highest rate. These are views of full pages of articles with not very “hot” topics, but with somewhere even boring developments. After an hour or two, the abstract of the article leaves the first pages of the tapes (there are several types of tapes on the site with annotations of 10 articles each), and its viewability drops 2-3 times, which is also seen in the graphs. There are visible dips in views at night (1-7 hours Moscow time), and July 13-14 shows a decrease in views at the weekend - then there are less visitors and articles 1-2 days old. However, they have 2-3 views per minute during the day. (All visitors, authorized and unauthorized on the site, who have come to full pages of articles, are taken into account, annotation views are not taken into account.)
By a single article connected to the counter on Monday morning, it is clear that the article is viewed on the second day, but several times smaller. We will be able to view cleaner graphs of viewing individual articles in 5 subsequent screenshots of counters, in which 1 article per counter is registered.
And now let's look at the statistics of browsers and mobile clients - this is mainly because of what we started collecting statistics. It will be a basic reference for comparing the same statistics on the other 5 thematic articles, including the article about the Opera browser, which was the basis for the discovery of British scientists.
This is the case with browsers for typical visitors to feature articles for the same period of 6 days.
What is characteristic? Impressively low share of MSIE (2.7% with 13% of the average Russian; well, this is normal for the site). If you look at the statistics on the page for more details , then you can see detailed information on versions and browser shares on it. In general, nothing special, but note the percentage of future versions of Chrome (26.29 - 2%) and Firefox (23, 25 - 1% of the rest of Fx). Intermediate (27 and 24) versions to use "not fashionable" - or alpha, or sure "beta".
The share of mobile devices - 11%.
Operating Systems:
For comparison, OS statistics in Russia: gs.statcounter.com/#os-RU-monthly-2013030-201306-bar
The amount of Linux in 15% on the site speaks for itself.
2. Qualitatively about Mars.
The qualification of articles on space is related to the fact that in recent days low-quality articles of not-very-skillful authors have appeared, which are not the goal of the sample.
For the only quality article in the last 2-3 weeks, let's see what contingent of readers it is looking for, whether browser statistics are diluted with nolo people. After all, the views are much larger, and the influence of new people will be noticeable.
Undoubtedly, this article refers to the top ten for the week, she scored 180 "pluses" and was in the first position "best for the day." The more interesting it is to see how much the sysly views fall when such an article leaves the first line of the “Best” informer in the sidebar - in fact, disappears from each page of tapes. The statistics of the 2 days of its existence very clearly shows how “catkstrophic is the boundary of the first day for such articles. A little further we will see that for not so “top-end” articles the fall is not so “disastrous” - in quotes, because a large number of views is explained by the first position of the rating for the day. the fall in the areas of the graph can be estimated at 10-12 times. And according to the total area (integral) of views - the first day is 97% views for this article. Terrific mean the first day. However, it will be seen that this is so - for hits and, possibly, for a certain subject (for reading, not for development and use) - the article was read once - and grateful, but they do not come back again. A little bit wrong - for feature articles, where views after the first day there is 5-8% of the total.
We look at the first day of the life of the article. Yes, they read little at night, as always. The next day, readers take their own and fill up the missed information of the previous day (it was published at 1:50 pm, but statistics were not received until 9:00 pm; you can say that on the first day you read about as many people as in the second, and some of them are repeated visits for reading, for example, comments; however, only 5% of them are noted, and there are relatively few comments.
Browsers Surprises are not expected here, but we'll see.
Yes, the browsers are the same. How are you doing with OS?
There is progress here - the percentage of users with Linux is not so high, 1.5 times less than in thematic articles. For a change, let's see what gender and age reads this article, according to Metrics.
3. From the company-developer of the Opera :
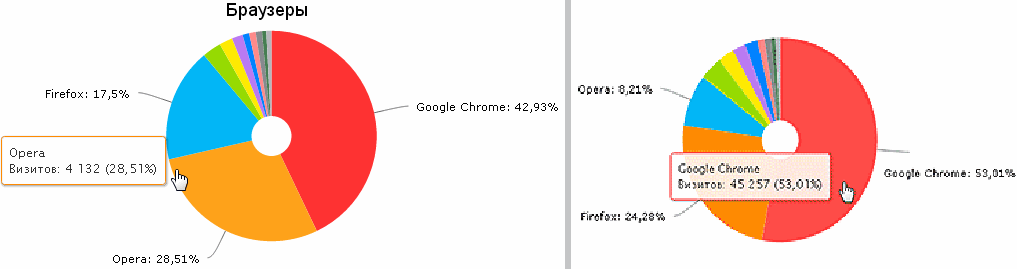
We got to the main interest of British scientists. Still, the difference in browsers is striking.

They lied a little - not 4, but only 3.5 times the share of the Opera more when reading the article about the Opera. But it was most likely made by newsmen, who know how to make a splash.
For mobile devices - 8%.
The share of Linux - 9%. From which you can make a cautious assumption that not all developers (readers of topical articles) read through the Opera, but also a sufficient percentage of the rest of Habr's readers.
Of the other indicators, Metrics can tell about the geographical distribution of readers; about attendance by time of day.
4. Scandalous laws and public interest
Considerable interest is the question of whether the difference is visible between the scandalous and thematic articles through user agents. After all, the former usually have 5-10 times more traffic and simply force out the main content of the resource to the backyard. If there was a way to sort these 2 types of content, we would have 2 different sites, and even more - for development, for recreation, for the fight ...
On attendance by the minute during the week - we see the stable readability of the article the following days. Not so sharp drop in views after 24 hours (3.5-4 times). Most likely, this is due to the fact that the article was not an absolute hit in 24 hours, and not everyone who saw the article in the list of the best read it.

In the OS, we do not see a significant reduction in Linux - the same 10% as for “space” and articles about Opera.
5. Sample Fiction News
Suppose this is not a very revealing article, but let's see how its visitors differ from others.
It turns out that such an article is read with 15% of mobile devices - 1.5 times more than the average, and 2 times more than about space. This is a noticeable difference, and it can be used as a filter (if we had statistics for all articles). Probably, browsing through mobiles is facilitated by the ease of content, perception perception, and a noticeable caller title (with the words "Kim Dotk").
The composition of the OS has not changed, except that the share of mobile has increased. Linux - 12%, from which we conclude that the share of geeks consumes and yellow news, because they are in the same tape with others. If it were not so, the Linux share would be reduced to Internet-wide 1.5-2%. Link - metrika.yandex.ru/stat/os/?counter_id=21769096&date1=20130711&date2=20130717&filter=month&goal_id=&group=day (we will not spend money on screenshots).
6. A sample of interesting conversations.
This article is difficult to attribute to any group. She is unusual. The author asked commentators to tell who they would become if there was a ban on their main occupation. 400 comments. However, the share of repeat visits is small. In general, I don’t even know if there are substantially more than the usual 10% in the articles of repeated visits. Affects the specificity of reading the news on the first day ... Well then. We looked at it like this:
A typical fall after the first day and quite active reading in the following days (conditionally, 7-8%) - reading the comments, obviously. Mobile - 16%. Linux - 12%. Fits the signs of easy reading publicism, which is similar in composition to the content.
So, we have considered the dependence of user agents on the content and subject of articles. Considered the importance of the first day of the life of the article. It was found that some topics with the choice of user agents "work wonders." And some regularities of statistics may suggest topics for articles. Especially influential - Linux OS and mobile agents. Rules:
We did not disassemble the composition of Windows and the share of IE (it was 2.5-3.5% and did not show any pronounced bias). In particular, this is hampered by the choice of graphs that is available for easy viewing. But Metrics has an API that could possibly help to better process the statistics. In any case, it, Metric, turned out to be a good tool for analyzing the composition of user-agents of a highly loaded site, producing statistics with literally minute accuracy and speed (sometimes processing is delayed up to half an hour, but not lost). It can be recommended as a light and normally designed tool.
* If the abstract were serious and the name corresponded to the content of this article, it would look something like this: habrahabr.ru/post/145045 (June 2012)
* or like this: (February 2007)
* About Habré, statistics and cakes (January 2010) - long-term statistics and trends of articles;
* Other search results for "Habrahabr statistics"
UPD: counter to kata allows you to see through which RSS-readers read Habr's tapes: habrahabr.ru/qa/43746
Leaving aside the hard work of the scientists of the minds on the newly discovered mystery of nature, let us take up the task of a simpler and more mundane task - let's see what tools these amazing results are obtained
. Perhaps looking at their work, amazing discoveries also lie ahead.Scientists have used the Yandex metrics service, substituting a picture from it into one of the many comments on the page with the article and comparing with similar comments ordinary, non-Opera articles. Further, going to the pages of public access to browser statistics "Opera - non-Opera",
... they made this discovery.
A bit more serious
After the news to attract attention, let's see what really happened.
')
Readers of the Habr site are interested in statistics about other readers . No, no, yes, and there will be articles that fill the gap with a lack of information on visitors' browsers, from the OS, attendance frequency and other interesting characteristics, which, looking at the flow of articles, you can guess, but you can not see in the graphs. Site owners keep statistics, but revealing it means sharing a competitive advantage in planning visitor flows. It is not by chance that everyone has data on visits, but not all site owners tend to share them. The site shows its statistics on a special page, but it is a very general plan. At the same time, I would like to know what could be obtained from the logs of typical pages, without pretending to commercial data.
To do this, a study of a dozen other articles was conducted using open and free Yandex Yandex metrics counters. Organizing your own counters and calculations is obviously a task of a different level of technical complexity, which does not correspond to a light interest in user-user agents, and the Yandex Metric solves most idle questions quite well, producing beautiful graph images.
The main answers given by the graphs turned out like this.
- What is the difference between the composition of browsers and operating systems (OS) of Habr's readers from the statistics of counters on average over the Internet
- how the per-minute schedule of article views behaves during the first day or two after their publication;
- what is the difference between the composition of browsers in articles of different categories, such as technical or journalistic;
- how the attendance of the article falls after the first day of publication;
- gender and age composition of readers (specificity of Yandex-metrics analytics);
- how many people read using experimental versions of browsers (as well as obsolete ones);
- share of mobile browsers.
Interesting to know all this? Go.
In order to compare the resulting charts with the statistics of browsers on average in Russia and around the world, we will look at the publications made in various articles. Looking at the cardinal differences in browser composition in different years and even months, regular readers of this topic are not surprised - each factor and number has its own rationale and reason. Just give a list of links, so as not to search for them by topic.
* Yandex metrics statistics for January 2013 - www.pcbee.ru/browsers/top-browsers-2013.html ;
* webrowser.ru/rynok/statistika-internet-brauzerov-v-aprele-2013-goda.html - Statcounter and Net Application statistics on the world and Liveinternet in Russia for April 2013; few comments;
* Browser usage statistics in RUnet for June 2013 - OpenStat, LiveInternet, HotLog: alexvaleev.ru/browserstat/index.php?type=month&year=2013&month=6
What will we be interested in?
We will determine the statistics of which typical articles we would like to see in order to compare its differences. Select the conditional categories of articles:
Thematic programming and web technologies
- About astronautics,
- about browsers,
- about laws about blocking sites,
- about the security of personal data
- about something that like regular readers and much commented.
There are many other topics on which I would like to see the statistics, but you can not embrace the immense.
As a joke, you can determine the correlation between the subject of articles and the composition of browser browsers. This is very technological - based on the choice of readers to determine which category an article belongs to, having made thousands of measurements of page visits in advance. There are also easier ways to check the article for keywords. But the difference is that people vote with browsers, and the parser is engaged in word recognition, the answer of which depends on the success of the recognition program implementation.
Therefore, despite the absurdity of thousands of measurements against one, 6 (six) counters were placed for different categories of articles. 5 counters are connected by 1 article, characteristic for the selected category, and one is connected to several (6) technical plan items in order to get average statistics.
Placed - and wait, with what browsers and OS visitors will begin to come. By the way, the Yandex-metric, according to its own intelligence, can show at the same time the gender and age of readers, which can also be used in categorization.
To divide articles into categories in some constructive way is quite basic and urgent need of readers. Of course, powerful classifiers in the form of hubs and tags have been created for this purpose. You can additionally find out which authors on which topics most often write and analyze keywords. But the dependence of browsers, OS, gender and age of readers is also an interesting topic, especially for British scientists.
Therefore, perhaps, the initiative will find further support, and other readers will continue the tradition of categorizing articles, and in a month we will be able to look at the new results. Only one thing is important - that the placement of tags corresponds to the planned categories.
The collected statistics will work for one more useful business, therefore it is not entirely “empty fun” - by reading activity we will be able to get a graph of the intensity of viewing articles depending on the hour, day of the week and time from the start of publication and finding the article in zahabrenny, on the main and among the best. In fact, the statistics were collected specifically for these purposes, and not for the discoveries of British scientists.
But this other matter will be thoroughly calculated in another article in order to find out the real price of the estimates in the comments of the articles.
For this review, statistics was collected on articles of different categories (links lead to open statistics on the specified groups of articles):
one.
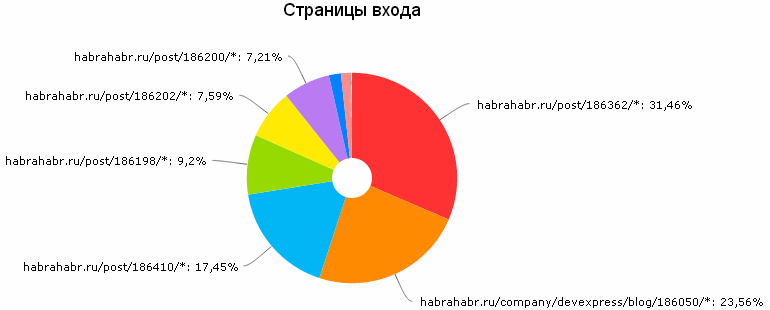
Six articles of different popularity on the themes of scripts and developments :
/ post / 186362 / - 28tys. views - “Leveling debian / ubuntu servers for small ones. Part 1"
/ post / 186410 / - 15 thousand. Views - “Evidence-Based Planning” (translated by J. Spolsky)
/ post / 186198 / - 12 thousand. views - "9 signs that you should not hire this Web developer" (from the table)
/ post / 186202 / - 14tys. views - "Compression of data during transmission from the browser to the server"
/ post / 186200 / - 9tys. views - “Do not be afraid of bicycles. Or another Grand Central Dispatch (GCD) in C ++ 11 ”
/ post / 186218 / - 3 thousand. views - "Understanding Node.js"
- a total of 95 thousand views on the metrics counter, 85 thousand visitors.
Statistics on them shows the overall picture of visitors to the site with a bias on articles on programming and technology. From this average statistics, you can judge the browsers and OS of the average user with such interests. In particular, it can be used as a standard for comparison with other statistics.
If we look at the statistics from other articles - news, cosmonautics, scandalous laws, then there will be several other visitors on them. It is unlikely that such knowledge will be useful or will greatly go beyond the limits of error. But it will still be interesting to compare - how different are browsers and reader-developer systems from all those who don’t discover technical articles, including the same reader-developers to a lesser extent.
2
Qualitatively about Mars :
/ post / 185846 / - 51 thousand. views - "Curiosity goes on a journey of a year long"
What is the difference between lovers of high-quality information about Mars and visitors to feature articles? The statistics of this counter is trying to answer this question.
3
From the developer company about Opera :
/ company / opera / blog / 186210 / - 30 thousand. views - "Ctrl + Z for Ctrl + D" - about plans for Opera for computers from the project manager. Expressive bias in the statistics of browsers that interested British scientists.
four.
Scandalous laws and public interest :
/ post / 185844 / - 64 thousand. views - "The blocking script, the second act. Voting on the ROI.
This is not a popular first article on this topic, but still it should show a collection of just such a contingent of readers who will not pass by the problems of the Network and at the same time will not necessarily be developers.
five.
Sample fictional news :
/ post / 186392 / - on data security (“Kim Dotcom (Mega, Megaupload) is going to launch an interception-proof email and e-mail”, 17000 views, 52 comments) - data on data security, which collects readers of popular messages.
6
A sample of interesting conversations :
/ post / 186452 / - conversations in the comments (“What would you do if ...?”, 31 thousand views, 400 comments). Monitoring a wide variety of developer visitors who are inclined to talk in comments about their interests. It is interesting because more people may come here again to read comments and take part in conversations on pleasant topics. Therefore, the ratio of “views - visitors” compared to other statistics will be interesting.
The number of views here is indicated at the time of writing the article, on average 3-4 days after the publication of the articles studied. This number in the caption for each article will increase over time and not correspond to the specified values.
Link Metrics statistics - open for everyone to see. But for fixing the described data at the time of publication of the article, screenshots of some graphs were made.
Features of site views
1. Statistics 6 subject articles.
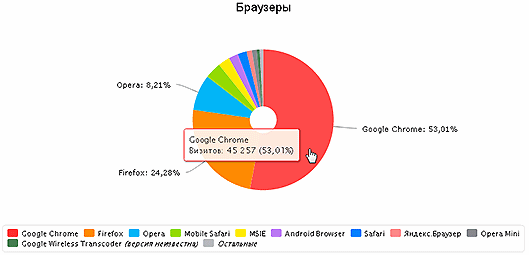
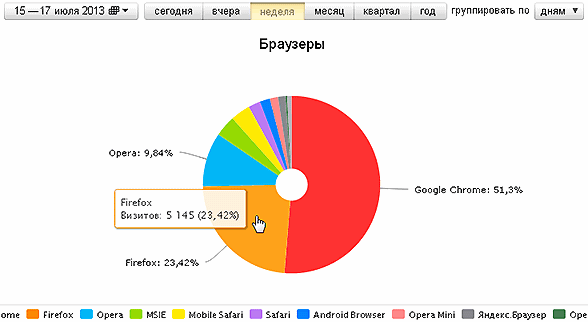
What we see in the general statistics on thematic articles? A sample of several articles is to a large extent random and will differ by a percentage or more with broader averaging, and on some topics it will differ greatly, as we will see in the following categories in the Opera browser. Taking this remark into account, we will look at the list of browsers that were viewed 95 thousand times 6 pages of typical, moderately successful and moderately unsuccessful six articles in approximately the following ratio:
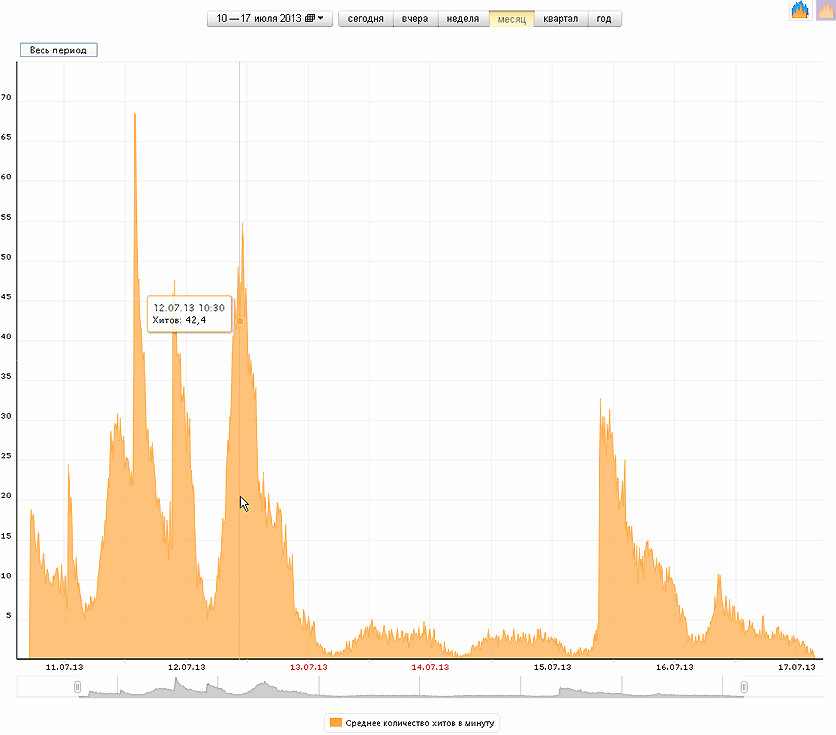
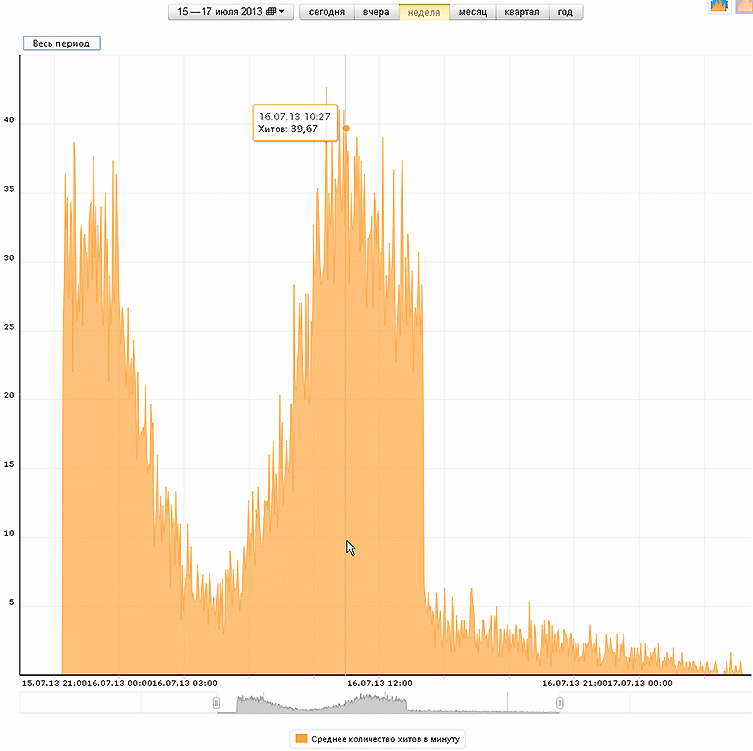
The observation lasted several days. The situation is similar with other articles. Per-minute monitoring from July 11 to July 17 shows characteristic bursts of viewability of 6 articles, 5 of which were published on Thursday-Friday, one - on Monday.
At the beginning of the publication, when the article is at the top of the tape or went to the first page of the tape “zahabrennye” (gained a rating of +8 or higher), its browsability reaches 60 hits per second, and this is not the highest rate. These are views of full pages of articles with not very “hot” topics, but with somewhere even boring developments. After an hour or two, the abstract of the article leaves the first pages of the tapes (there are several types of tapes on the site with annotations of 10 articles each), and its viewability drops 2-3 times, which is also seen in the graphs. There are visible dips in views at night (1-7 hours Moscow time), and July 13-14 shows a decrease in views at the weekend - then there are less visitors and articles 1-2 days old. However, they have 2-3 views per minute during the day. (All visitors, authorized and unauthorized on the site, who have come to full pages of articles, are taken into account, annotation views are not taken into account.)
By a single article connected to the counter on Monday morning, it is clear that the article is viewed on the second day, but several times smaller. We will be able to view cleaner graphs of viewing individual articles in 5 subsequent screenshots of counters, in which 1 article per counter is registered.
And now let's look at the statistics of browsers and mobile clients - this is mainly because of what we started collecting statistics. It will be a basic reference for comparing the same statistics on the other 5 thematic articles, including the article about the Opera browser, which was the basis for the discovery of British scientists.
This is the case with browsers for typical visitors to feature articles for the same period of 6 days.
What is characteristic? Impressively low share of MSIE (2.7% with 13% of the average Russian; well, this is normal for the site). If you look at the statistics on the page for more details , then you can see detailed information on versions and browser shares on it. In general, nothing special, but note the percentage of future versions of Chrome (26.29 - 2%) and Firefox (23, 25 - 1% of the rest of Fx). Intermediate (27 and 24) versions to use "not fashionable" - or alpha, or sure "beta".
The share of mobile devices - 11%.
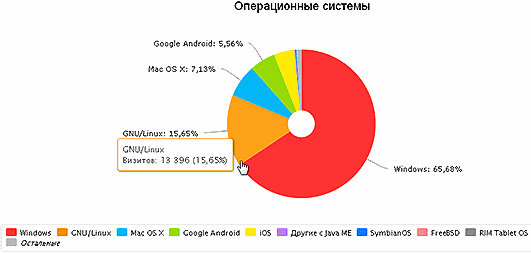
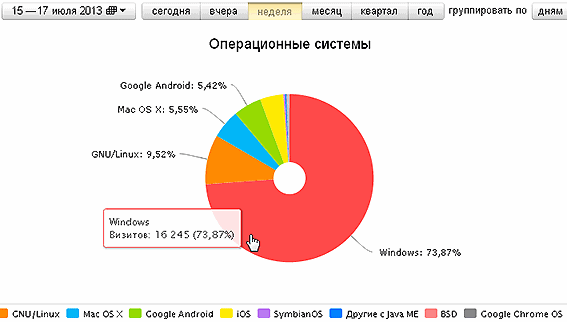
Operating Systems:
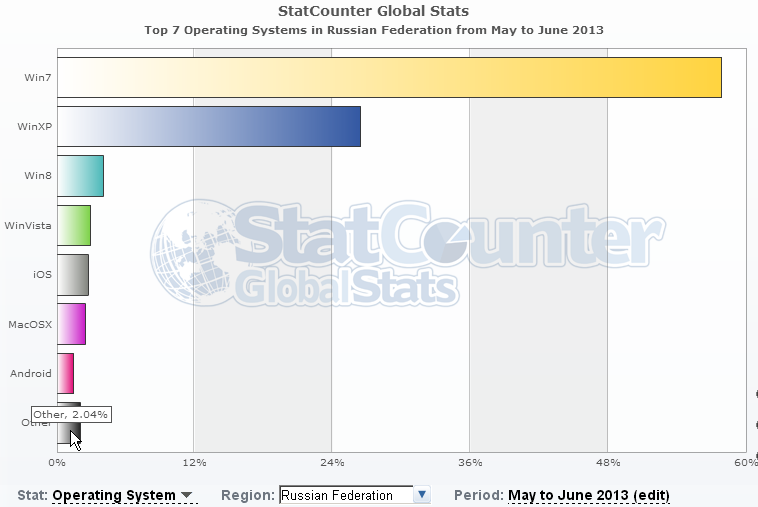
For comparison, OS statistics in Russia: gs.statcounter.com/#os-RU-monthly-2013030-201306-bar
The amount of Linux in 15% on the site speaks for itself.
2. Qualitatively about Mars.
The qualification of articles on space is related to the fact that in recent days low-quality articles of not-very-skillful authors have appeared, which are not the goal of the sample.
For the only quality article in the last 2-3 weeks, let's see what contingent of readers it is looking for, whether browser statistics are diluted with nolo people. After all, the views are much larger, and the influence of new people will be noticeable.
Hit hits fall after day
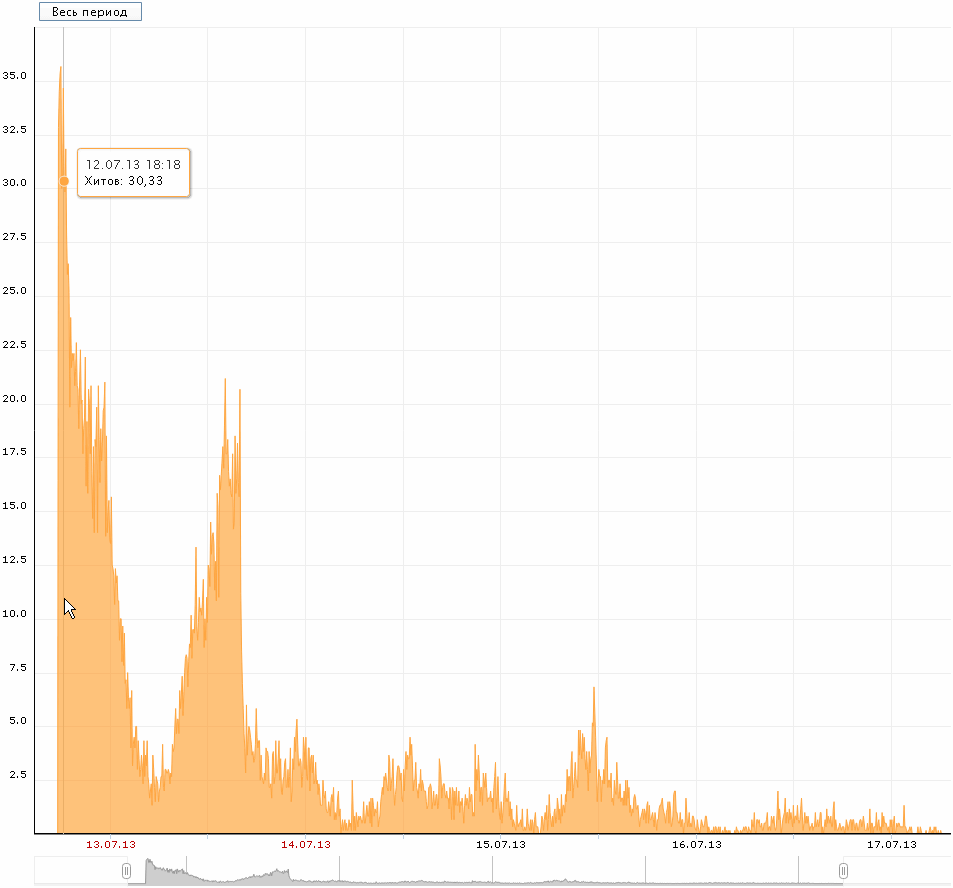
Undoubtedly, this article refers to the top ten for the week, she scored 180 "pluses" and was in the first position "best for the day." The more interesting it is to see how much the sysly views fall when such an article leaves the first line of the “Best” informer in the sidebar - in fact, disappears from each page of tapes. The statistics of the 2 days of its existence very clearly shows how “catkstrophic is the boundary of the first day for such articles. A little further we will see that for not so “top-end” articles the fall is not so “disastrous” - in quotes, because a large number of views is explained by the first position of the rating for the day. the fall in the areas of the graph can be estimated at 10-12 times. And according to the total area (integral) of views - the first day is 97% views for this article. Terrific mean the first day. However, it will be seen that this is so - for hits and, possibly, for a certain subject (for reading, not for development and use) - the article was read once - and grateful, but they do not come back again. A little bit wrong - for feature articles, where views after the first day there is 5-8% of the total.
We look at the first day of the life of the article. Yes, they read little at night, as always. The next day, readers take their own and fill up the missed information of the previous day (it was published at 1:50 pm, but statistics were not received until 9:00 pm; you can say that on the first day you read about as many people as in the second, and some of them are repeated visits for reading, for example, comments; however, only 5% of them are noted, and there are relatively few comments.
Browsers Surprises are not expected here, but we'll see.
Yes, the browsers are the same. How are you doing with OS?
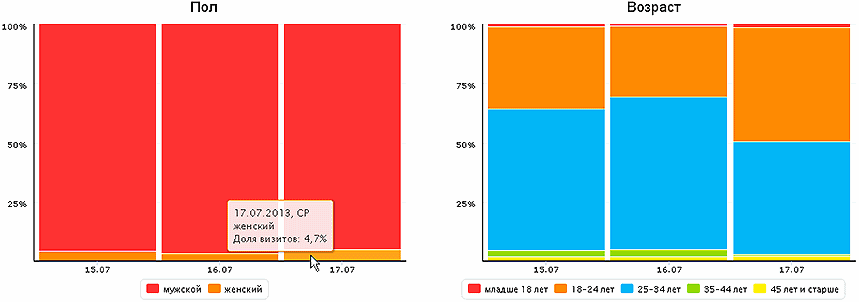
There is progress here - the percentage of users with Linux is not so high, 1.5 times less than in thematic articles. For a change, let's see what gender and age reads this article, according to Metrics.
3. From the company-developer of the Opera :
We got to the main interest of British scientists. Still, the difference in browsers is striking.
They lied a little - not 4, but only 3.5 times the share of the Opera more when reading the article about the Opera. But it was most likely made by newsmen, who know how to make a splash.
For mobile devices - 8%.
The share of Linux - 9%. From which you can make a cautious assumption that not all developers (readers of topical articles) read through the Opera, but also a sufficient percentage of the rest of Habr's readers.
Of the other indicators, Metrics can tell about the geographical distribution of readers; about attendance by time of day.
4. Scandalous laws and public interest
Considerable interest is the question of whether the difference is visible between the scandalous and thematic articles through user agents. After all, the former usually have 5-10 times more traffic and simply force out the main content of the resource to the backyard. If there was a way to sort these 2 types of content, we would have 2 different sites, and even more - for development, for recreation, for the fight ...
On attendance by the minute during the week - we see the stable readability of the article the following days. Not so sharp drop in views after 24 hours (3.5-4 times). Most likely, this is due to the fact that the article was not an absolute hit in 24 hours, and not everyone who saw the article in the list of the best read it.
In the OS, we do not see a significant reduction in Linux - the same 10% as for “space” and articles about Opera.
5. Sample Fiction News
Suppose this is not a very revealing article, but let's see how its visitors differ from others.
It turns out that such an article is read with 15% of mobile devices - 1.5 times more than the average, and 2 times more than about space. This is a noticeable difference, and it can be used as a filter (if we had statistics for all articles). Probably, browsing through mobiles is facilitated by the ease of content, perception perception, and a noticeable caller title (with the words "Kim Dotk").
The composition of the OS has not changed, except that the share of mobile has increased. Linux - 12%, from which we conclude that the share of geeks consumes and yellow news, because they are in the same tape with others. If it were not so, the Linux share would be reduced to Internet-wide 1.5-2%. Link - metrika.yandex.ru/stat/os/?counter_id=21769096&date1=20130711&date2=20130717&filter=month&goal_id=&group=day (we will not spend money on screenshots).
6. A sample of interesting conversations.
This article is difficult to attribute to any group. She is unusual. The author asked commentators to tell who they would become if there was a ban on their main occupation. 400 comments. However, the share of repeat visits is small. In general, I don’t even know if there are substantially more than the usual 10% in the articles of repeated visits. Affects the specificity of reading the news on the first day ... Well then. We looked at it like this:
A typical fall after the first day and quite active reading in the following days (conditionally, 7-8%) - reading the comments, obviously. Mobile - 16%. Linux - 12%. Fits the signs of easy reading publicism, which is similar in composition to the content.
So, we have considered the dependence of user agents on the content and subject of articles. Considered the importance of the first day of the life of the article. It was found that some topics with the choice of user agents "work wonders." And some regularities of statistics may suggest topics for articles. Especially influential - Linux OS and mobile agents. Rules:
- 10% of Linux on the site is normal for any article;
- if more (15%) read through Linux, then this is an article on development;
- if they read through mobile agents (15%, not 10 or less), then this is an easy article, easy article or news;
We did not disassemble the composition of Windows and the share of IE (it was 2.5-3.5% and did not show any pronounced bias). In particular, this is hampered by the choice of graphs that is available for easy viewing. But Metrics has an API that could possibly help to better process the statistics. In any case, it, Metric, turned out to be a good tool for analyzing the composition of user-agents of a highly loaded site, producing statistics with literally minute accuracy and speed (sometimes processing is delayed up to half an hour, but not lost). It can be recommended as a light and normally designed tool.
Other articles on Habr's statistics
* If the abstract were serious and the name corresponded to the content of this article, it would look something like this: habrahabr.ru/post/145045 (June 2012)
* or like this: (February 2007)
* About Habré, statistics and cakes (January 2010) - long-term statistics and trends of articles;
* Other search results for "Habrahabr statistics"
UPD: counter to kata allows you to see through which RSS-readers read Habr's tapes: habrahabr.ru/qa/43746
Source: https://habr.com/ru/post/186864/
All Articles