PHDays III CTF: An Inside Look (Part 2)
 We continue our story about the preparation of CTF competitions, which took place at the Positive Hack Days forum. Today we will talk about creating the interface, usability (usability), as well as the development of visualization of the course of competitions.
First part
User interface
A very important part of developing CTF was creating a user interface for commands (UI). With it, players must carry out all actions related to game mechanics. From personal experience, we knew that the overall impression of CTF largely depends on the quality of the UI, so we took the design and usability very seriously.
')
The UI was a web application that communicated with the jury system through MongoDB and AMQP-RPC. As a basis, we chose a bundle of Pyramid + Nginx. Notification system was implemented on Flask.
UI requirements were as follows:
- Interactivity . In the context of CTF, it is very important to promptly receive notifications about game events: about changes in the state of services, the appearance of new tasks, operations with resources, etc. We have tried to do everything to keep the system up to date with users.
- Speed performance As already mentioned, the responsiveness of the interface can decide the outcome of the game. In most cases, the application processes requests immediately, without tugging once again the jury system, or making it deferred. For example, verification of decisions was made without recourse to the Jury system.
- Fault tolerance . The UI architecture allowed to deploy the system on several hosts, transparently to users. However, this was not needed in the game, since we had a fairly powerful server.
- Safety As in all other components, you had to be ready for attacks from the teams. The UI was as isolated as possible from other system components. For example, access to the database was read-only, and communication with the Jury System was carried out through AMQP.
Usability
The most important task of the UI is to provide participants with an intuitive interface. We did not cherish unrealizable hopes and understood that for the participants of CTF any legend and entourage fade into the background. The most important thing is the solution of tasks, and the user interface should not distract the players. Usability was one of the main priorities, and therefore we changed the design five times.
The first versions of the UI were performed in bright colors, with flat minimalist elements. Subsequently, we painted the interface for better perception, and also changed the background to a dark one to support the entourage of computer games (as it turned out, the design of almost all games is made against a dark background). The illustrations of the monsters from the comic fit very well into the design of the page with the tasks, but apart from this, the UI was no longer connected with the legend.
Current game events were displayed as vk.com-style pop-up messages. In addition, you could see the event log from the very beginning of the game.


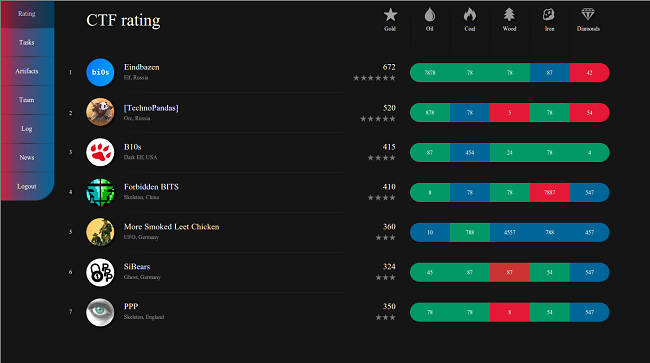
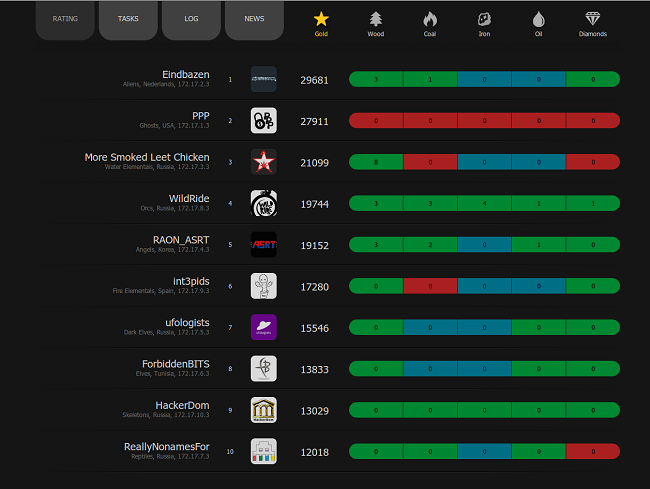
Evolution of the Scorbord Interface

The final version of the page with tasks
Visualizer
From the very first days of the development of CTF, it was decided that visualization of the gameplay is absolutely necessary. First of all, it is necessary in order to attract as many outsiders as possible and embed hacker contests in the context of the PHDays III forum.
Concept
To begin with, it was necessary to understand what events the viewers should show so that they would be interested to observe what was happening, and at the same time so that the process was as informative as possible.
Events were divided into two categories:
- Attack on the service. It can occur in a very large number (up to 138,240 events per game).
- The remaining events. Occur infrequently - decision task (up to 250 per game), killing the boss (4 per game), getting achivka (up to 391 per game)
Frequent events should be displayed so that they are not too annoying, occur in the background, and make a variety of gameplay. Rare events should be made as visible as possible so that they are not lost on the background of frequent ones.
After analyzing all the events, comparing them with the invented legend and game mechanics, we developed a working visualizer concept:
- Events occur on the world map D'Errorim (top view).
- Each team has its own castle - a place where the heroes of the team live.
- Near the castle are five mines, where teams extract resources.
- Each team has its own flying creature (dragon), which is designed to visualize all active events.
- In the center of the map are 25 houses, displaying the task.
- In addition to the houses, there are also three common gold mines.

Map D'Errorim from the visualizer
Event visualization:
- Attack on the service . The dragon cyclically flies through all the mines that the team attacked in the last round. Flying up to the mine, he begins to attack the mine, making several laps over it. Thus, all dragons continuously fly around the map, displaying attacks made in the last round.
- Solution Taska . The dragon interrupts his route and flies to attack the house corresponding to the solved task. In this case, all but the dragon and the house is obscured, thereby highlighting this important event.
- Killing the boss When the boss's lifetime has expired and it became clear which teams were able to overcome him, their dragons interrupt their way and fly to the attack. After some time, the boss breaks into bloody pieces and dragons fly whoever.
- Getting achivki . On top of the screen is a stamp with the name of the achivka and the team that received it.
However, visualization of events by itself is not enough for them to be interesting to observe. We still need a lot of beautiful animated graphics, we need a dynamic view of the map. The camera should periodically change its position, smoothly approach the places where events occur, and move back, “follow” the actions of the dragons and show the entire map. In general, the camera should be “alive”, anticipate interesting moments for the viewer and point him at them.
Expanding boundaries
After the first concept was ready and it was time to start working on the creation of the application, an idea came to us: what if we made a mobile and online version of the visualizer? Nowadays, this is a very promising direction that will help attract and interest much more viewers! It would be great and unusual if the course of the CTF could be observed from anywhere in the world where there is access to the Internet - this has not happened before!
The idea was received with great enthusiasm. However, this in turn not only complicated the design of the project, but also added the need for interactive user interaction. It was decided to create a manual camera control mode, namely scrolling and zoom using the touch interface.
In addition to viewing the map, the user needs the ability to view the overall rating and information about each team, as well as the ability to follow the dragon of a particular team.

Interactive Visualizer Interface

Team rating in the visualizer

Team profile in the visualizer
Architecture
When all the requirements for the system have been thought out, it's time to start developing the project architecture. It was immediately clear that the application is distributed and consists of several links:
- a service that receives events from the Jury system;
- a web application that returns game events and game status to clients;
- client visualizing game events;

Schematic representation of the visualizer architecture
By the time the visualizer started designing, work was underway on the Jury system and the players' user interface, and the AMQP message queue for transferring game events and the MongoDB database for storing the system state were already selected as communication channels. Messages between the client and the server, it was decided to send in JSON, because it is very convenient and quite compact.
The first link of the visualizer is service. When an event enters the queue, the AMQP service must convert it from the format of the jury system to the format of the client application, as well as update the game state. All received information is stored in MS SQL database.
The second link is a web application that receives client requests and returns events and system status from a database in JSON format.
The last link is the client of the visualizer, an application that queries the server for a list of events and states and displays the received data in accordance with the concept described above.
Selection of development tools
The server part of the visualizer (both the service and the web application) was written for the .NET platform in C #. The tools were chosen mostly because of the preferences of the developer who was involved in this task. C # is powerful enough and at the same time simple language, well suited for the implementation of such applications, so the development went quickly and without any problems. The choice of MS SQL Server DBMS was also due to the simplicity of interaction with C # tools.
The client part is essentially an ordinary computer game, but without the ability to control the player, so based on the requirements, it was necessary to find a cross-platform game engine running Android, iOS and HTML5. We considered the possibilities of different engines, but none of them could fully satisfy our needs. Variants with writing custom code for each platform using the same API were dismissed immediately, since there was no time to write three different projects. It also turned out that games written in “pure” HTML5 are quite demanding of performance, and there is no way to run them on older devices. We were almost desperate to find something more or less appropriate when Game Maker: Studio came across.
Game Maker is an environment that uses its own C-like GML programming language, sharpened specifically for designing games with a built-in map editor, image editor, and many other useful features. Moreover, the GMS bundle includes a whole set of compilers for machine code of various platforms, including Windows, OS X, Linux (Ubuntu), HTML5 (JavaScript), iOS, Android version 2.2 and higher, Windows Phone. We were also pleased with the performance compared to other engines (25-30 fps on HTC Desire with Android 2.3.5). The only negative is that the product is not free, but there were no problems with the purchase of a license.
As a result, everyone agreed that Game Maker is perfect for our tasks, and the development phase began.

Developing a client visualizer in Game Maker: Studio
Development
Development began six weeks before the start of PHDays III. But considering that the application should have been validated in the App Store and Google Play, the deadline is exactly one month! Work went on day and night, in heat and cold. For all 30 days, two people worked on the visualizer unabated. Since the server part is in some way just a message translator, there were practically no difficulties with it. However, we counted on a large number of requests from customers, so caching was implemented, and the amount of traffic forwarded was also minimized.
The situation was different with the client, because an unusual programming language was used with its own specifics, with its own API and its own laws.
The most unusual part of client development was the creation of a touchscreen interface with scrolling and zoom. By default, Game Maker provides primitives for working with a multi-touch interface, but the scrolling and scaling of the map had to be developed from scratch. There is the concept of “visible level region” with various parameters, such as coordinates, area dimensions, rotation angle, etc. By changing the listed parameters depending on the position of the cursor, it turned out to achieve very good results. It was also necessary to take into account that the resolution and aspect ratio on different devices can vary greatly, therefore, when the application is initialized, various correction factors are calculated for correct operation and display of all parts of the interface.
Another problem was the incorrect display of the effects in the version of the application HTML5. It turned out that the particle system built into Game Maker, when building games under HTML5, in principle, does not allow the use of additive blending of colors (additive blending) and does not know how to paint particles in different colors if the browser does not support WebGL. In this regard, we had to create our own particle system, which uses the functions of working with sprites. Since it was necessary to ensure fast operation of the application on old mobile devices, the particle system turned out to be quite fast and functioned perfectly on all platforms, including HTML5.
The final changes in the client part of the visualizer were made a day before the project was completed. Nevertheless, everything turned out exactly as planned from the very beginning! In addition to the hard work and insane enthusiasm of the developers, Game Maker helped to meet the short term, in which (despite the peculiarities in the work) a clear and logical interface, good documentation and many features that greatly facilitate the development of games.

Google Play Store Visualizer Page
During the whole development process, we did not forget about testing. At the initial stages, each part of the system was debugged separately, then test games were conducted (there were five of them in total). Final testing was conducted the day before the game already at the forum site at the World Trade Center.
Conclusion
Before the start of the competition, a lot of gray hair added to all of us an unpleasant technical failure: the electrical network could not bear the load when all the teams turned on. Fortunately, this problem was quickly eliminated with the help of a new electrical panel, and then everything went pretty smoothly. As a result, the Dutch team Eindbazen became the winner of PHDays CTF, the Americans from PPP were the second, and our compatriots from the team More Smoked Leet Chicken took the third place.
That's all. We hope you were interested to learn about the process of creating the game. We will be happy to answer questions in the comments. Thanks for attention!
Authors: slim_d0g blackzert muodov ki11obyte Asperka
PS A detailed description of the preparation process of the game (including testing) and the full legend of the competition are available on the official PHDays website.
Source: https://habr.com/ru/post/186800/
All Articles