Interactive Globe - SVG versus Canvas
Good day, dear reader! Last time we studied the process of creating an interactive horoplete map, now I propose to complicate the task a bit and go to the three-dimensional model of the Earth, which the people call the globe. We will make the globe of two types: SVG version and Canvas version. In both cases, we will use the JavaScript library d3.js. Each option has its own advantages. In my performance, the Blue Planet looks like this:
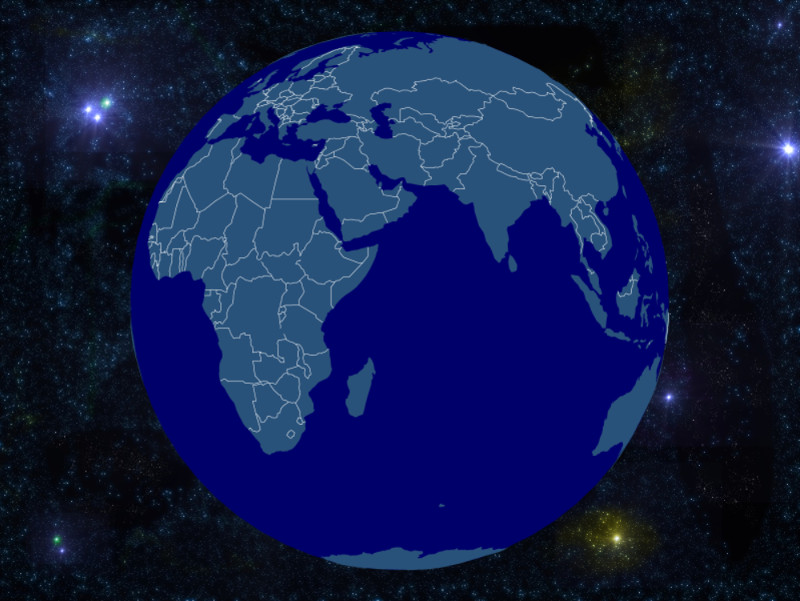
And how to create your own world with continents and oceans can be found under the cat.
')
First we need to find the geodata. Like last time, we will use TopoJSON for this purpose. You can read about how to get it in the previous article in the “Map Matter” section. And so we have the
Our goal will be a globe that can:
Define the main variables and add DOM elements.
The variable
Next, we load our files using the library queue.js , which allows us to do this asynchronously.
We now turn to the main function, in our case it is called
Let's move on to handling mouse events. Here, the explanations require drag.origin () , it allows us to specify the “original” (valid) starting coordinates when an item is captured, in our case, the latitude and longitude.
To implement focusing on the country, we need to write a function that would return geodata for the country by its
Now you can go directly to the implementation of focus (centering) on the country selected from the list.
Here, the whole point is covered in transition.tween () , which allows us to call a given function (rotation) for each interpolated value.
That's it - the SVG globe is ready. Sources can be found on GitHub (there you can also ask questions to those who have read-only on Habrahabr), and you can touch the result through the bl.ocks.org service.
Let's look at the benefits of SVG :
With the SVG implementation sort of sorted out, let's see how to do something similar on the canvas. Create a simple animation of the rotation of the Earth. Here, much will be similar to the previous example. The code is small, so I will bring it all at once.
Rotation is implemented as rotation from point
Well, we created the animation. Sources can be found on GitHub , and you can admire space views through the bl.ocks.org service.
Consider the advantages of Canvas:
So we looked at a couple of interesting examples created using the wonderful d3.js library. I tried to make the examples moderately simple to understand, vivid and quite interesting. In the fight against SVG and Canvas, the friendship eventually won, so the use of this or that technology depends on the type of your project. For example, if your project is related to cartography, it is advisable to use SVG , if you work with multimedia, then Canvas will help you. I hope you were interested. Good luck and success in the further development of d3.js !
And how to create your own world with continents and oceans can be found under the cat.
')
Start
First we need to find the geodata. Like last time, we will use TopoJSON for this purpose. You can read about how to get it in the previous article in the “Map Matter” section. And so we have the
world-110m.json TopoJSON file for a map with a scale of 1: 110,000,000, or 1 cm = 1,100 km (1 ″ = 1,736 miles) and a world-110m-country-names.tsv with the names of countries of the form id - the name of the country. The external file with the names is used for convenience, since in this case you can easily translate the names into any language. Everything, you can proceed directly to the creation of the globe.Comment:
In our chosen scale, some small countries “degenerate” in a geometrical sense, therefore there are only 174 countries on our list.
We draw the interactive globe
Our goal will be a globe that can:
- rotate the mouse "grabbing" the land
- center the globe on the country selected from the list
Template for those who need it.
<!DOCTYPE html> <html lang="en"> <head> <meta charset="utf-8"> <title>Nice title</title> <script src="http://d3js.org/d3.v3.min.js"></script> <script src="http://d3js.org/queue.v1.min.js"></script> <script src="http://d3js.org/topojson.v1.min.js"></script> </head> <style> Your awesome CSS </style> <body> <h1>Cool Header</h1> <script> Your awesome d3.js code </script> </body> </html> Define the main variables and add DOM elements.
var width = 600, height = 500, sens = 0.25, focused; //Setting projection var projection = d3.geo.orthographic() .scale(245) .rotate([0, 0]) .translate([width / 2, height / 2]) .clipAngle(90); var path = d3.geo.path() .projection(projection); //SVG container var svg = d3.select("body").append("svg") .attr("width", width) .attr("height", height); //Adding water svg.append("path") .datum({type: "Sphere"}) .attr("class", "water") .attr("d", path); var countryTooltip = d3.select("body").append("div").attr("class", "countryTooltip"), countryList = d3.select("body").append("select").attr("name", "countries"); The variable
sens is responsible for accuracy when rotating the mouse, and focused used as a trigger for the selected (centered) country. You can read about the projection used on wikipedia: Orthographic projection . The .clipAngle () method determines which part of the sphere we will be displaying (or, more precisely, see), again you can read about it on wikipedia: small-circle clipping . The rest does not seem to need clarification.Next, we load our files using the library queue.js , which allows us to do this asynchronously.
queue() .defer(d3.json, "data/world-110m.json") .defer(d3.tsv, "data/world-110m-country-names.tsv") .await(ready); We now turn to the main function, in our case it is called
ready . First, we add country names to our dropdown list and draw countries on the globe. function ready(error, world, countryData) { var countryById = {}, countries = topojson.feature(world, world.objects.countries).features; //Adding countries to select countryData.forEach(function(d) { countryById[d.id] = d.name; option = countryList.append("option"); option.text(d.name); option.property("value", d.id); }); //Drawing countries on the globe var world = svg.selectAll("path.land") .data(countries) .enter().append("path") .attr("class", "land") .attr("d", path) Let's move on to handling mouse events. Here, the explanations require drag.origin () , it allows us to specify the “original” (valid) starting coordinates when an item is captured, in our case, the latitude and longitude.
//Drag event .call(d3.behavior.drag() .origin(function() { var r = projection.rotate(); return {x: r[0] / sens, y: -r[1] / sens}; }) .on("drag", function() { var rotate = projection.rotate(); projection.rotate([d3.event.x * sens, -d3.event.y * sens, rotate[2]]); svg.selectAll("path.land").attr("d", path); svg.selectAll(".focused").classed("focused", focused = false); })) //Mouse events .on("mouseover", function(d) { countryTooltip.text(countryById[d.id]) .style("left", (d3.event.pageX + 7) + "px") .style("top", (d3.event.pageY - 15) + "px") .style("display", "block") .style("opacity", 1); }) .on("mouseout", function(d) { countryTooltip.style("opacity", 0) .style("display", "none"); }) .on("mousemove", function(d) { countryTooltip.style("left", (d3.event.pageX + 7) + "px") .style("top", (d3.event.pageY - 15) + "px"); }); To implement focusing on the country, we need to write a function that would return geodata for the country by its
id 's. Actually, here it is. function country(cnt, sel) { for(var i = 0, l = cnt.length; i < l; i++) { if(cnt[i].id == sel.value) {return cnt[i];} } }; Now you can go directly to the implementation of focus (centering) on the country selected from the list.
//Country focus on option select d3.select("select").on("change", function() { var rotate = projection.rotate(), focusedCountry = country(countries, this), p = d3.geo.centroid(focusedCountry); svg.selectAll(".focused").classed("focused", focused = false); //Globe rotating (function transition() { d3.transition() .duration(2500) .tween("rotate", function() { var r = d3.interpolate(projection.rotate(), [-p[0], -p[1]]); return function(t) { projection.rotate(r(t)); svg.selectAll("path").attr("d", path) .classed("focused", function(d, i) { return d.id == focusedCountry.id ? focused = d : false; }); }; }) .transition(); })(); }); Here, the whole point is covered in transition.tween () , which allows us to call a given function (rotation) for each interpolated value.
Spinning, spinning ball blue.
That's it - the SVG globe is ready. Sources can be found on GitHub (there you can also ask questions to those who have read-only on Habrahabr), and you can touch the result through the bl.ocks.org service.
Let's look at the benefits of SVG :
- The ability to interact with DOM elements, in particular the
path - Ability to use CSS (as a consequence of the previous paragraph)
- The text is a text, with all the advantages
Animation of planet earth
With the SVG implementation sort of sorted out, let's see how to do something similar on the canvas. Create a simple animation of the rotation of the Earth. Here, much will be similar to the previous example. The code is small, so I will bring it all at once.
var width = 800, height = 500; var projection = d3.geo.orthographic() .scale(245) .rotate([180, 0]) .translate([width / 2, height / 2]) .clipAngle(90); var canvas = d3.select("body").append("canvas") .attr("width", width) .attr("height", height); var c = canvas.node().getContext("2d"); var path = d3.geo.path() .projection(projection) .context(c); function getImage(path, callback) { var img = new Image(); img.src = path; img.onload = callback(null, img); } queue() .defer(d3.json, "data/world-110m.json") .defer(d3.tsv, "data/world-110m-country-names.tsv") .defer(getImage, "data/space.jpg") .await(ready); //Main function function ready(error, world, countryData, space) { var globe = {type: "Sphere"}, land = topojson.feature(world, world.objects.land), borders = topojson.mesh(world, world.objects.countries, function(a, b) { return a !== b; }); //Earth rotating (function transition() { d3.transition() .duration(15000) .ease("linear") .tween("rotate", function() { var r = d3.interpolate(projection.rotate(), [-180, 0]); return function(t) { projection.rotate(r(t)); c.clearRect(0, 0, width, height); c.drawImage(space, 0, 0); c.fillStyle = "#00006B", c.beginPath(), path(globe), c.fill(); c.fillStyle = "#29527A", c.beginPath(), path(land), c.fill(); c.strokeStyle = "#fff", c.lineWidth = .5, c.beginPath(), path(borders), c.stroke(); projection.rotate([180, 0]); }; }) .transition().duration(30).ease("linear") .each("end", transition); })(); }; Rotation is implemented as rotation from point
[180, 0] to point [-180, 0] , which coincide. Thus, the "interpolator", without noticing the trick, will do what we need. Then we start drawing on canvas, having previously cleared it. Draw the background, sphere, continents and borders of countries. We get endless rotation due to the recursive call of the transition function."And yet she spins!"
Well, we created the animation. Sources can be found on GitHub , and you can admire space views through the bl.ocks.org service.
Consider the advantages of Canvas:
- Faster / smoother operation than SVG
- Ability to integrate with animation, video, games and other things that are implemented today with it
Conclusion
So we looked at a couple of interesting examples created using the wonderful d3.js library. I tried to make the examples moderately simple to understand, vivid and quite interesting. In the fight against SVG and Canvas, the friendship eventually won, so the use of this or that technology depends on the type of your project. For example, if your project is related to cartography, it is advisable to use SVG , if you work with multimedia, then Canvas will help you. I hope you were interested. Good luck and success in the further development of d3.js !
Source: https://habr.com/ru/post/186532/
All Articles