Active users on VKontakte and Twitter: rating of Russian regions
As promised, we publish data on the regional activity of Twitter and Vkontakte users. Unlike public opinion polls, this study allows us to trace not the declarative behavior of social network users, but to identify the core of active users who form the information flow in the network. Most users post entries on the social networks VKontakte and Twitter in St. Petersburg and Moscow.
The largest number of active users of the social network VKontakte for May-June 2013 (in absolute numbers) in Moscow (2,000,615), St. Petersburg (1,152,063) and the Sverdlovsk Region (441,109).
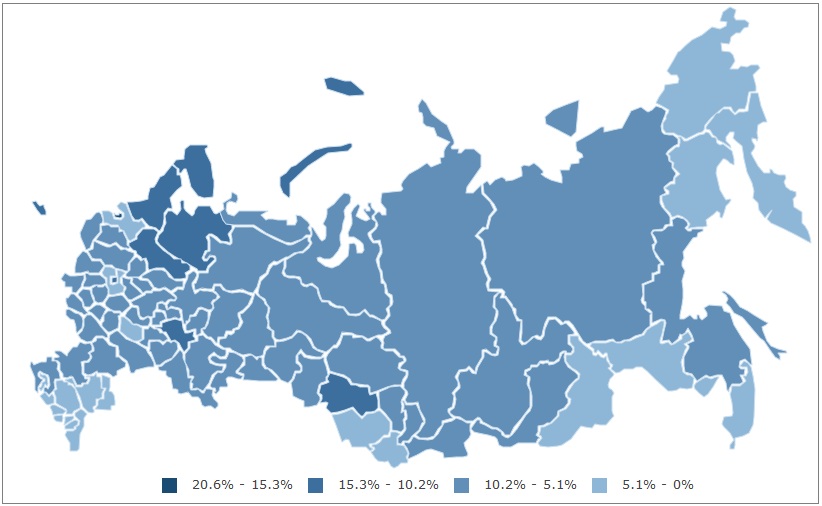
When calculating the coverage of the active audience of users relative to the population of the region, the top three are St. Petersburg (22.9% of the city’s inhabitants), Moscow (16.7% of the city’s inhabitants) Kaliningrad and Murmansk regions (13.9% of the region’s inhabitants).
In general, the audience of active users on the VKontakte network declined in June 2013 compared to May 2013, which is a standard picture during the summer vacation period.
In contrast to the VKontakte audience, Twitter’s active audience increased in June compared to May 2013.
The leading regions in absolute audience reach coincide with the data on the social network VKontakte: Moscow (451,039 active users), St. Petersburg (189,328 active users) and Sverdlovsk region (52,575 active users).
Regarding the population in the region, Moscow and St. Petersburg ranked first among Twitter users (3.8% of urban residents each), Magadan Oblast (2% of the region’s residents) ranked second, Yaroslavl Oblast (1.8% of residents) ranked third. region).
Monitoring of social networks VKontakte and Twitter held in July 2013. Under the active users of the social network are those users who wrote at least one public message for the study period.
')
You can get acquainted with the interactive map of distribution of active users of social networks in the regions of Russia and statistical data for all regions on the pages: Active VKontakte users and Active Twitter users
Only those users who have written at least one public message (post, comment, tweet, republishment, etc.) are counted. Within the framework of our chosen approach, we study social networks as a means of public communication between people, as a tool to influence the formation of public opinion. In the light of this approach, active (“speaking”) users are important for us - those who obviously manifest their position on the topics studied and express their opinions by placing open content (public messages) in social media.
Thus, our approach does not copy the work of accounting systems (such as Internet counters or our own analysis of records of visits to Internet services), intended primarily to take into account the display of promotional materials.
In view of the fact that data collection is carried out continuously (every second), the question arises, for what reporting time intervals to provide information, that is, how we define for ourselves the very concept of an audience of social networks. The capabilities of the system make it possible to make arbitrarily detailed downloads, but for a broad presentation we stopped at the monthly interval. The monthly interval, on the one hand, allows us to track the dynamics, since the audience is not constant, and on the other hand, it is a valid generalization to take into account those users who use networks not daily, but at least once a month.
In contrast to these social centers, we, first, make our assessments not based on the respondents' answers, which are often of a declarative nature, but on the basis of taking into account their actual behavior, that is, we fix a specific behavioral act that we have defined for ourselves as a written public message (post, comment, tweet, etc). For example, according to VTsIOM, in absolute terms, about 27% of respondents said that they use the VKontakte network wciom.ru/index.php?id=459&uid=112476 . According to our measurements, the audience of active VKontakte users in Russia as a whole was 6.3% in May, in June it decreased to 5.6%, and the total number of unique active users in two months was 7.8%. Thus, after analyzing the annual cycle, we will be able to accurately calculate the audience of active network users for the year, based on their actual behavior in the networks.
For the presentation, we took the example of two social networks: the first is VKontakte (a network with a large user audience), and the second is Twitter (the most dynamically developing network). In the near future (until the end of the year) there is a phased connection of other popular social networks.
We collect and analyze not only the number of messages and their authors, but also the messages themselves, thanks to which we can conduct a lot of sociological research using contactless surveys. One of the most interesting studies, the Index of Love, shows in which regions of Russia social media users talk more about love, and in which about hatred.
The study was conducted from June 1 to June 7, 2013 in social networks - VKontakte, Facebook, Twitter, LiveJournal, etc. The Russian-speaking references to love and hate from the first person were analyzed - positive (for example, “I love”, “I love”) and negative ( “I hate”, “annoys me”, etc.). In total, more than 65 million messages from 10 million authors were analyzed.
During the study period, emotions that can be described as “love” or “hate” were cumulatively mentioned in the message flow more than 800 thousand times. In the majority of messages (70%) positive emotions prevailed (“I love”, “I like”, etc.), negative mood (“I hate”, “annoys me”, etc.) was present in a smaller volume of messages. (thirty%). And in the messages containing hate emotions, there is often a negative in relation to momentary stimuli - “I hate when they wake in the morning.”
The Altai Republic turned out to be the most positive region (an index of 4.1 points: the number of messages with positive emotions was 80.4%, with negative ones - 19.6. The Pskov region also hit the top-5 (index 3.9), the Republic of Karelia (3 , 7), Kostroma region (3.7).
You can familiarize yourself with the “Love Index” in all regions of Russia on the interactive map.
VKontakte audience
The largest number of active users of the social network VKontakte for May-June 2013 (in absolute numbers) in Moscow (2,000,615), St. Petersburg (1,152,063) and the Sverdlovsk Region (441,109).
When calculating the coverage of the active audience of users relative to the population of the region, the top three are St. Petersburg (22.9% of the city’s inhabitants), Moscow (16.7% of the city’s inhabitants) Kaliningrad and Murmansk regions (13.9% of the region’s inhabitants).
In general, the audience of active users on the VKontakte network declined in June 2013 compared to May 2013, which is a standard picture during the summer vacation period.
Twitter audience
In contrast to the VKontakte audience, Twitter’s active audience increased in June compared to May 2013.
The leading regions in absolute audience reach coincide with the data on the social network VKontakte: Moscow (451,039 active users), St. Petersburg (189,328 active users) and Sverdlovsk region (52,575 active users).
Regarding the population in the region, Moscow and St. Petersburg ranked first among Twitter users (3.8% of urban residents each), Magadan Oblast (2% of the region’s residents) ranked second, Yaroslavl Oblast (1.8% of residents) ranked third. region).
Monitoring of social networks VKontakte and Twitter held in July 2013. Under the active users of the social network are those users who wrote at least one public message for the study period.
')
You can get acquainted with the interactive map of distribution of active users of social networks in the regions of Russia and statistical data for all regions on the pages: Active VKontakte users and Active Twitter users
The way users are counted
Only those users who have written at least one public message (post, comment, tweet, republishment, etc.) are counted. Within the framework of our chosen approach, we study social networks as a means of public communication between people, as a tool to influence the formation of public opinion. In the light of this approach, active (“speaking”) users are important for us - those who obviously manifest their position on the topics studied and express their opinions by placing open content (public messages) in social media.
Thus, our approach does not copy the work of accounting systems (such as Internet counters or our own analysis of records of visits to Internet services), intended primarily to take into account the display of promotional materials.
Data presentation format
In view of the fact that data collection is carried out continuously (every second), the question arises, for what reporting time intervals to provide information, that is, how we define for ourselves the very concept of an audience of social networks. The capabilities of the system make it possible to make arbitrarily detailed downloads, but for a broad presentation we stopped at the monthly interval. The monthly interval, on the one hand, allows us to track the dynamics, since the audience is not constant, and on the other hand, it is a valid generalization to take into account those users who use networks not daily, but at least once a month.
Comparison with data from sociological survey services
In contrast to these social centers, we, first, make our assessments not based on the respondents' answers, which are often of a declarative nature, but on the basis of taking into account their actual behavior, that is, we fix a specific behavioral act that we have defined for ourselves as a written public message (post, comment, tweet, etc). For example, according to VTsIOM, in absolute terms, about 27% of respondents said that they use the VKontakte network wciom.ru/index.php?id=459&uid=112476 . According to our measurements, the audience of active VKontakte users in Russia as a whole was 6.3% in May, in June it decreased to 5.6%, and the total number of unique active users in two months was 7.8%. Thus, after analyzing the annual cycle, we will be able to accurately calculate the audience of active network users for the year, based on their actual behavior in the networks.
Submitted Networks
For the presentation, we took the example of two social networks: the first is VKontakte (a network with a large user audience), and the second is Twitter (the most dynamically developing network). In the near future (until the end of the year) there is a phased connection of other popular social networks.
Study Example: Love and Hate on the Map of Russia
We collect and analyze not only the number of messages and their authors, but also the messages themselves, thanks to which we can conduct a lot of sociological research using contactless surveys. One of the most interesting studies, the Index of Love, shows in which regions of Russia social media users talk more about love, and in which about hatred.
The study was conducted from June 1 to June 7, 2013 in social networks - VKontakte, Facebook, Twitter, LiveJournal, etc. The Russian-speaking references to love and hate from the first person were analyzed - positive (for example, “I love”, “I love”) and negative ( “I hate”, “annoys me”, etc.). In total, more than 65 million messages from 10 million authors were analyzed.
During the study period, emotions that can be described as “love” or “hate” were cumulatively mentioned in the message flow more than 800 thousand times. In the majority of messages (70%) positive emotions prevailed (“I love”, “I like”, etc.), negative mood (“I hate”, “annoys me”, etc.) was present in a smaller volume of messages. (thirty%). And in the messages containing hate emotions, there is often a negative in relation to momentary stimuli - “I hate when they wake in the morning.”
The Altai Republic turned out to be the most positive region (an index of 4.1 points: the number of messages with positive emotions was 80.4%, with negative ones - 19.6. The Pskov region also hit the top-5 (index 3.9), the Republic of Karelia (3 , 7), Kostroma region (3.7).
You can familiarize yourself with the “Love Index” in all regions of Russia on the interactive map.
Source: https://habr.com/ru/post/186428/
All Articles