Design Yandex. Map as a science and hobby
My name is Andrey Karmatsky, and I supervise the design work of Yandex.Maps. In the spring, I went to Novosibirsk to the Codefest 2013 conference, where I talked about how we design Yandex.Maps. It was a good opportunity to structure the accumulated knowledge in a small story that you want to share with you.
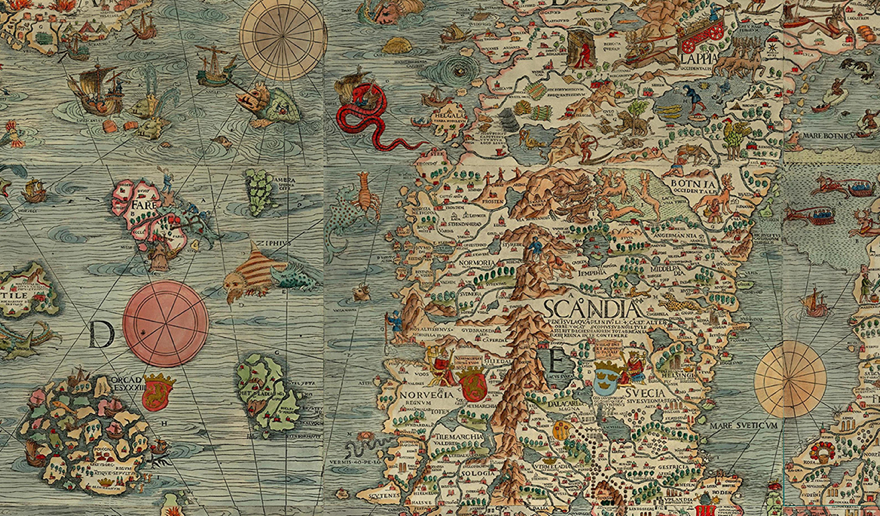
The cards fascinate me with their beauty, behind which lies a great sense - information that has been painstakingly collected and structured.
For example, the Carta Marina brothers Magnus. It may seem that this is just a beautiful illustration. In fact, this is a unique historical document that contains a lot of information and historical facts about northern Europe of the XVI century. To date, only two copies of this card have been preserved.
')
Today, after many, many years, technologies and algorithms allow you to create incredible things in cartography.
Watercolor from Stamen Design.
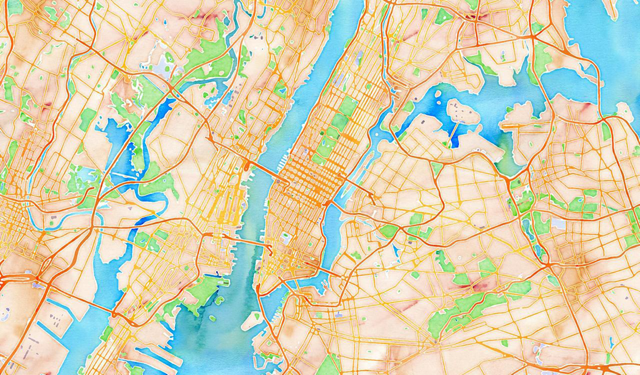
Map tiles by Stamen Design. Data by OpenStreetMap
Some artists also like maps, and they use them to create their paintings or draw pictures in the form of fictional maps. For example, artist Mat Cusick created a series of works from old American geography textbooks.
But the map is not just a picture. Proper presentation of information helps to make important decisions.
The more accurate and more complete the information is, the more accurate the decisions will be. For example, the work card commander.

From the book “The working map of the commander” ID Pombrika and N.A. Shevchenko
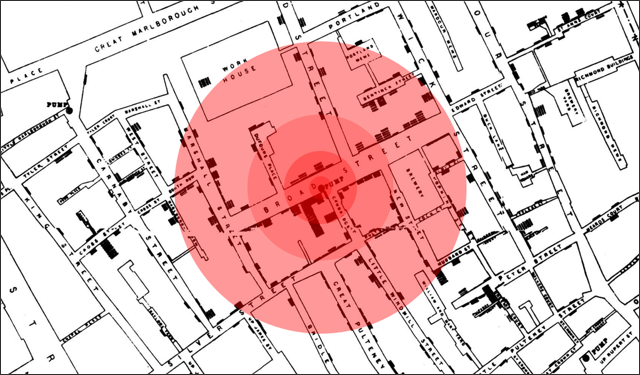
The correct presentation of the map data can save lives. This is well illustrated by the story of a London physician, John Snow, who during a cholera outbreak in 1854 in the Soho district surveyed residents and marked on the map cases of cholera.
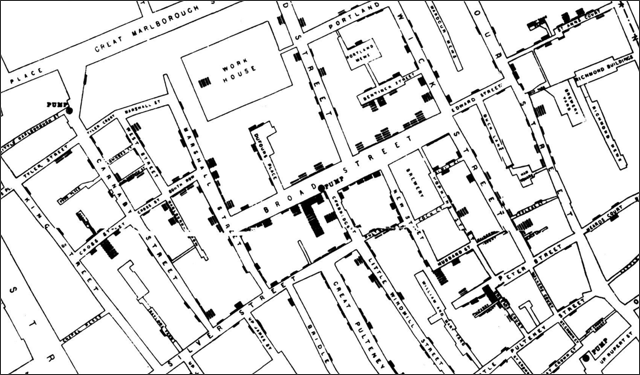
After three days of observation and studying the map, he concluded that the water column on Broad Street was infected. As a result, it was decided to bury her. After that, the cases of diseases have sharply declined. Now this place is a memorial dedicated to John Snow.
And there are a lot of such stories - when a correctly made map helped people.
So why do I like cards? Cartographic design is information design, and information design is:
Some guys explain the meaning of web cartography like this:
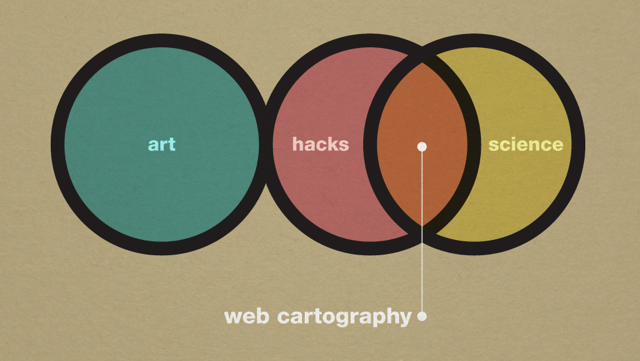
B is very close to what we do. So, the design of Yandex. Map. I'll tell you what we need to know in order to make a good map.
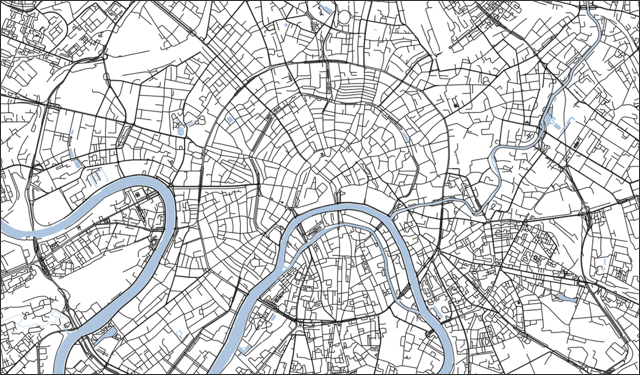
I have already said that the map is data, and without any design, it will look like this.

Just a layer of streets. And if you add a river and a layer of buildings, then so.

And we need to constantly invent something, so that people do not see our Maps like those on these pictures.
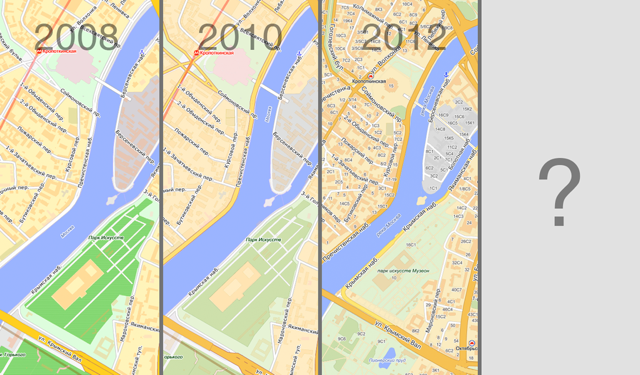
It may seem to an ordinary observer that almost nothing changes in Yandex.Maps. But if you look at time slices, it will become noticeable that we are constantly bringing in something new and experimenting.
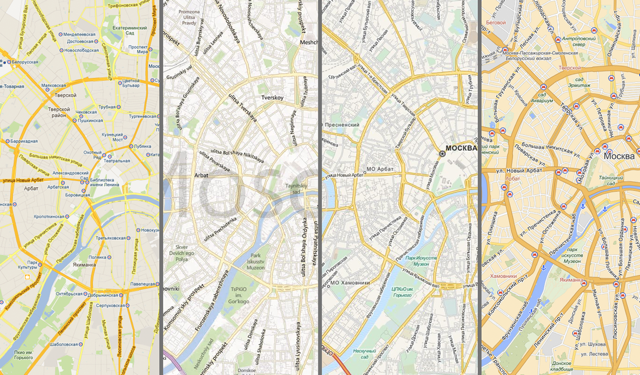
But other guys work and improve their products. They must be observed and watched what they did.
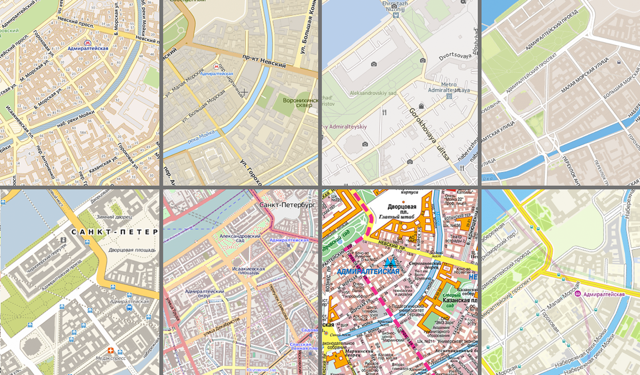
It is important not to forget that maps have evolved on paper and have been “living” on it for many, many years, so a lot of experience can be learned from studying paper maps:

But Yandex.Maps is an interactive product, and simply switching between scales, the user switches several static (paper) maps. This means that our map must be consistent visually, regardless of how much information is displayed on it. Changing the design of the map with the switching scale should be predictable for the user.
In addition, Yandex.Maps are mainly used in two qualities: directly as a map and as a substrate for displaying different layers of information.
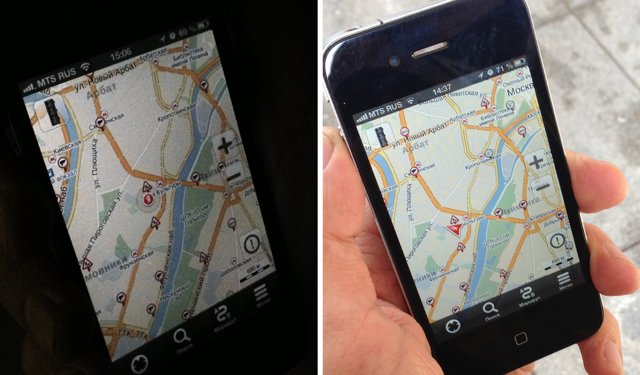
Our map is used on a mobile phone: on a sunny day and at night. And, of course, hundreds of thousands of drivers are looking at her in the car.
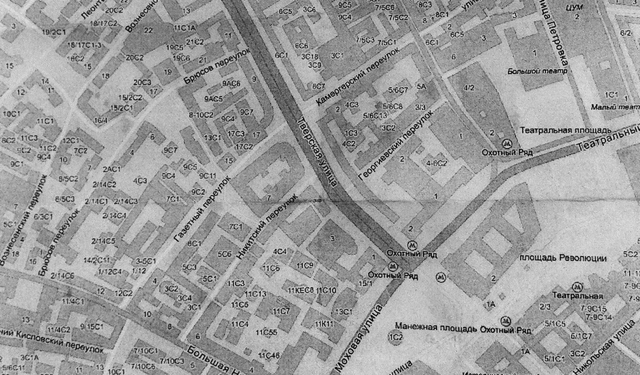
Despite the development of mobile technology, our map is printed. And not always printers print well.
By the way, one of the observations in Moscow is that pedestrians are looking at the printout of the map at the moment when they are coming up the escalator from the subway and are preparing to go through the so-called “last mile”. And there is not very good lighting.
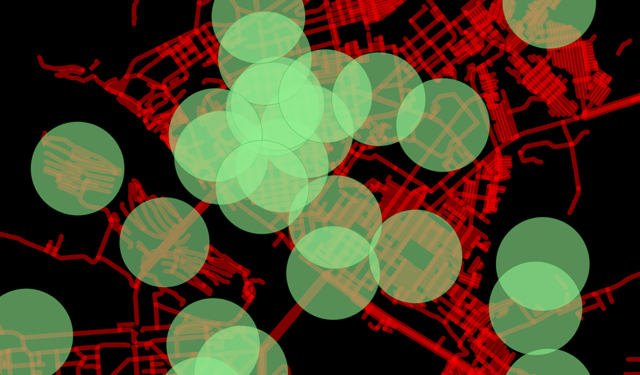
In addition to the environment, it is very important for us to know for whom we are creating our product and how these people will use it. The first thing that comes to mind for solving this problem is determining the territory of interest of users: where they look on the map and how intensely.
The heat map of requests shows well that people are interested in cities and territories along highways.
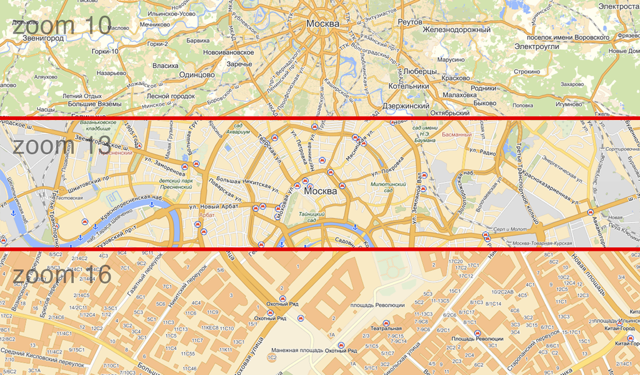
Since we are making an interactive map, it is necessary to take into account that users have different requests on different scales.
If it is very rough, then the scenarios for using different scales are approximately as follows:

If you think a little more, for a better understanding of your users, you can look at the statistics of requests of those of them who use Jams.
It turns out that we have two worlds that intersect somewhere on a medium scale: pedestrians and motorists. This means that the design of the city map needs to be developed on the basis of the needs of these two groups and understanding to whom the scale of the map is more important.
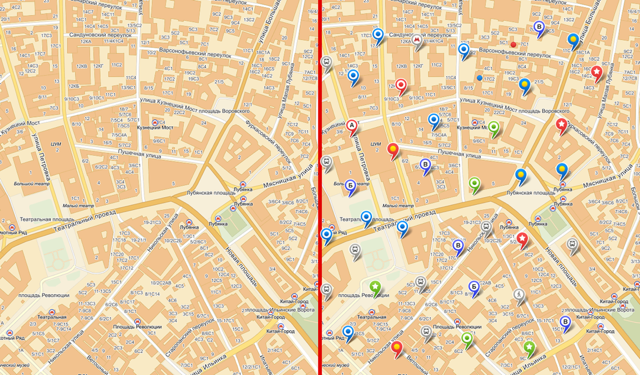
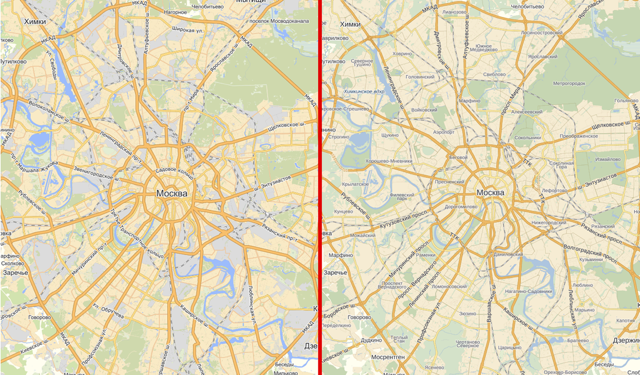
The presence of two different "maps of Moscow" can be illustrated by the picture below.
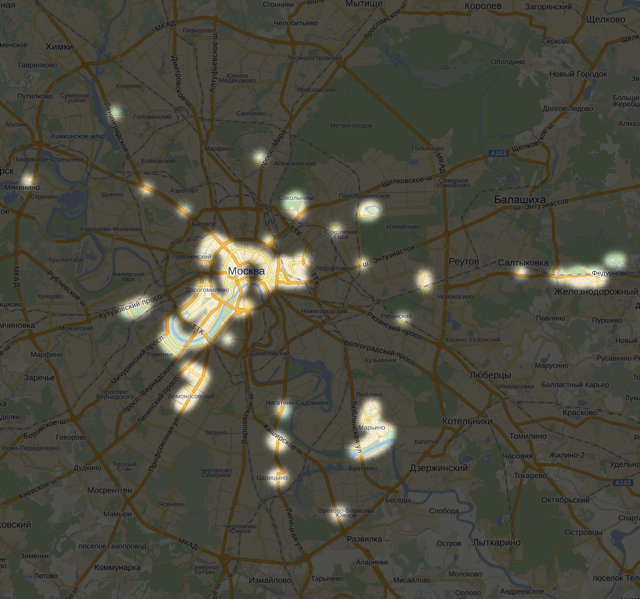
Pedestrians know the neighborhood around the subway well. These are islands with some urban life, weakly connected with each other (this is due to the fact that the metro scheme that does not correspond to the geographical location of stations completely distorts their ideas about the real location of these stations). Motorists move along the corridors of highways and know the road map quite well.
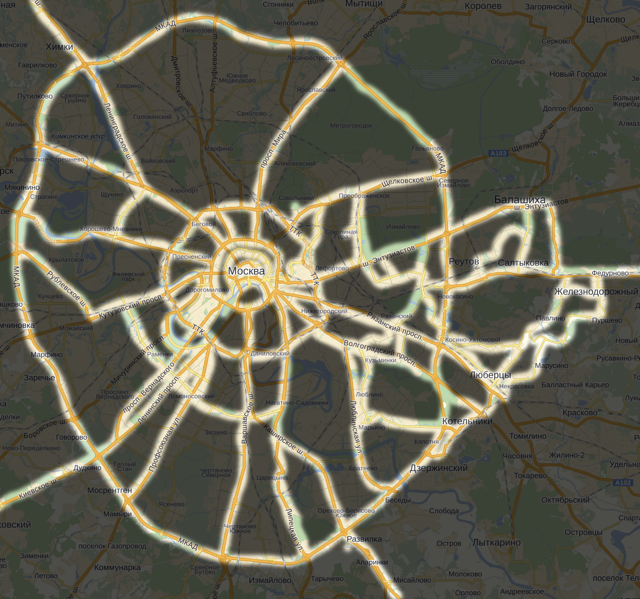
I decided to conduct a little experiment on myself. In the first picture I noted roads on which I feel confident without a map — the main streets where I often drive. Immediately I recalled the routes to work, the streets around the house or near work, and the road to airports or other places where I often went (large stores, for example).
And in the second picture I drew my “pedestrian” Moscow: areas where I do not need a map for orientation.
In smaller cities, where the metropolitan is not so well developed, pedestrians and motorists interfere with each other less. Pedestrians walking on public transport know the city better. Points of attraction for them are mostly areas or squares, and motorists use the streets, also knowing areas well.
The central part of Novosibirsk: districts, subways and streets
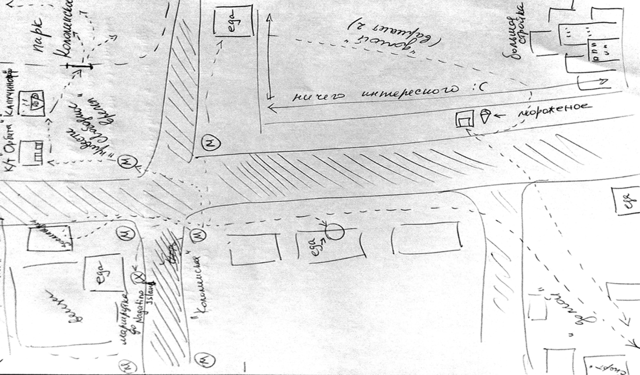
A pedestrian imagines the terrain is not at all as drawn on the map. And the orientation is not the same, and the points of interest are completely different. A mental map of the terrain in people's heads is a very important thing, understanding which helps to make maps more comfortable and more receptive.
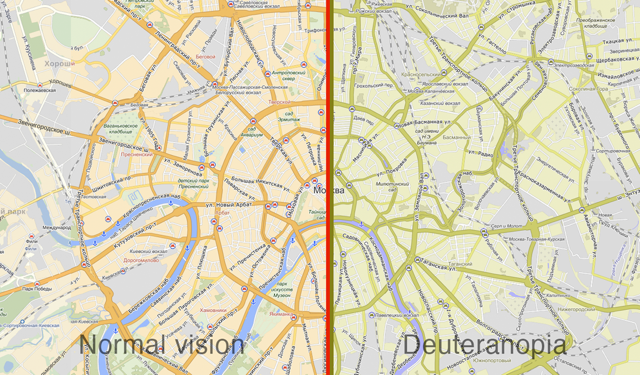
In addition to memory, a person has a vision. Therefore, be sure to take into account the visual abilities of a person. According to various estimates, up to 10% of the male population of the planet have color perception disorders . Among women, they are much less common - only 0.5%.
Card design is not about beauty. He is about meanings. Like any design. It is about how difficult to make simple and convenient. I will illustrate this thesis on the example of street layer design.
The road layer is 1 style, the display categories are no different. It is absolutely impossible to understand and understand the structure of the city.
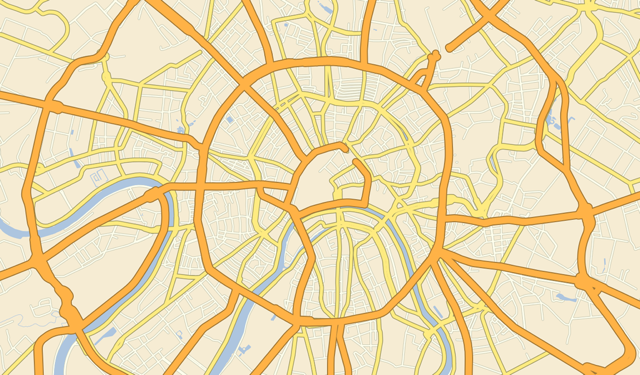
Since the roads are all different - the idea arises that each type of road should have its own visual presentation. And it becomes a little clearer. 7 road types = 7 display types.
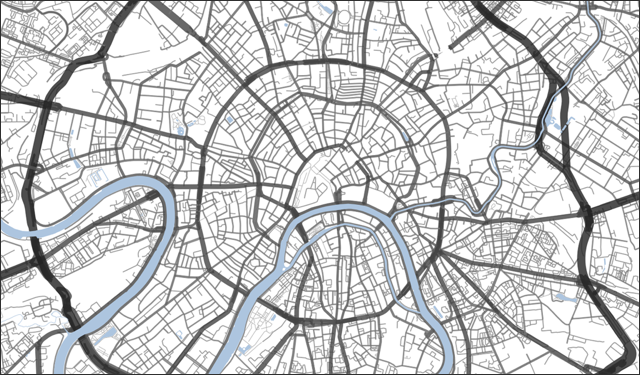
But the user is very difficult to distinguish between the seven types of display - the difference between adjacent ones is too small for him. Therefore, in order to make the map more convenient, we make three of seven styles.
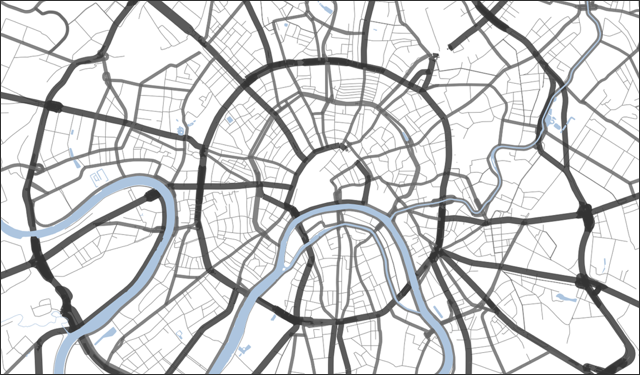
It seems now read easier.
And after we have decided on the meaning and information structure, we can think about a more aesthetic presentation. One of the main principles of Yandex maps is recognizability. Even if we copied the color palette or took a screenshot without specifying Yandex, most people will understand that Yandex.Maps is in front of them.
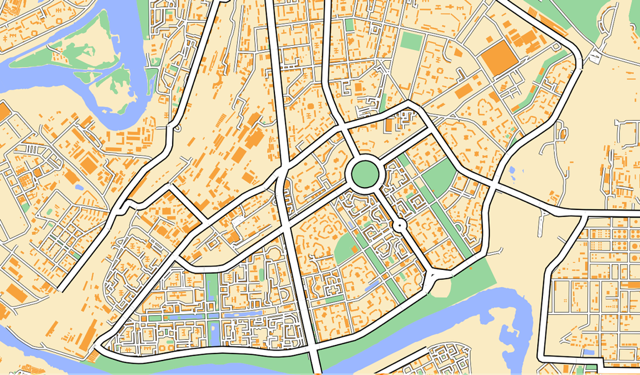
We called our method of displaying roads the “Rule of 3 styles of highways”. We decided to test it first in the design of the People’s Map, and then in the design of the map of Istanbul.
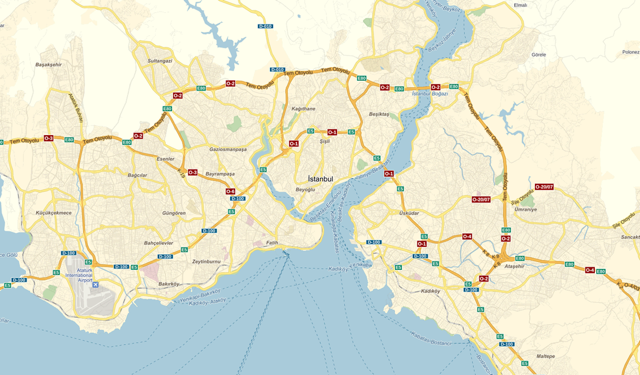
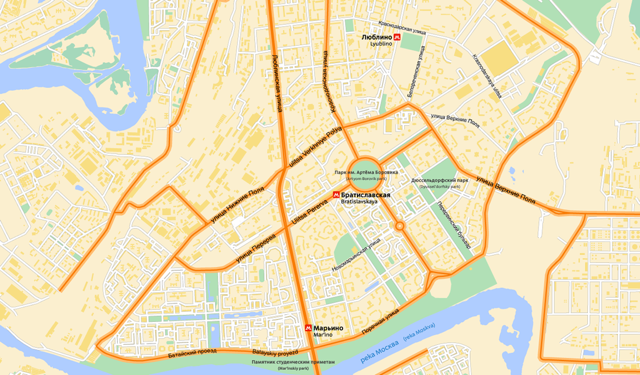
We liked the result, and we applied the rule in the design of the map of Moscow.
Experiments with a new palette of maps were also numerous and interesting. I will show a couple of funny options.
© OpenStreetMap

© OpenStreetMap
Agree, not that. So we began to think about how to return to the warm and recognizable Yandex.Map.
© OpenStreetMap
It is already warmer.
© OpenStreetMap
And finally, here is the concept that we like.

© OpenStreetMap
After making a concept and a series of experiments with a palette, a palette is born, which will be in Maps. I conducted several experiments with this picture: I looked at different monitors, ran out into the street with a mobile phone, looked at it with the eyes of the color makers, and printed it out on several printers. In fact, this is a prototype of the color palette of our Maps.
In addition to the display logic and color design, the map has icons.
Icon - a visual anchor for the card user. The icon should be understandable, readable and sufficiently visible on the colorful background of the map. And in the case when we have several icons, they should form a single visual row.
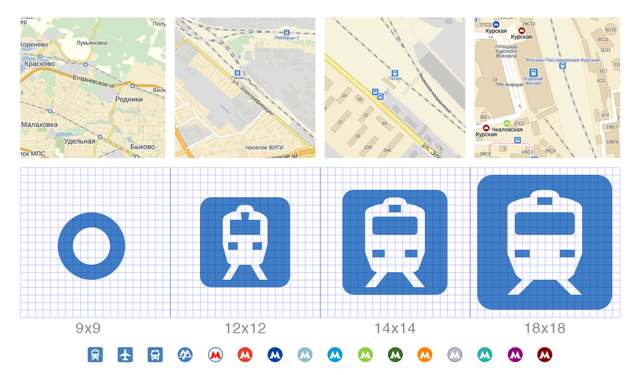
And since we are making an interactive product, where there is a different amount of information at each scale, the icons on Yandex.Maps have several sizes for different scales. For example, for railway stations, we made icons of four sizes.
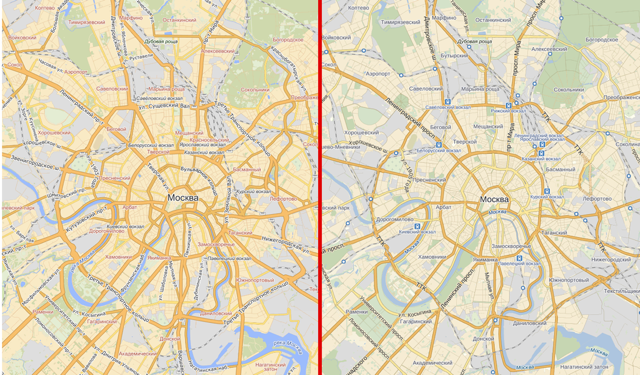
Armed with the knowledge and experimental results obtained, at the end of last summer we decided to change the map of Moscow. So, what we did.
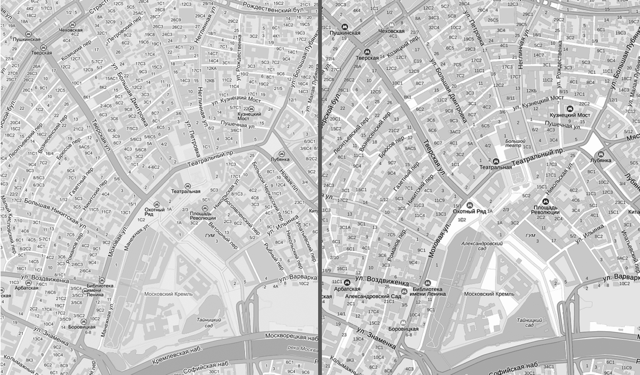
Thanks to the rule of three styles, the highways on one of the most popular scales have become thinner, and the picture is cleaner. We have worked the signatures, a place has appeared for the signatures of the districts - this is important information for orientation.
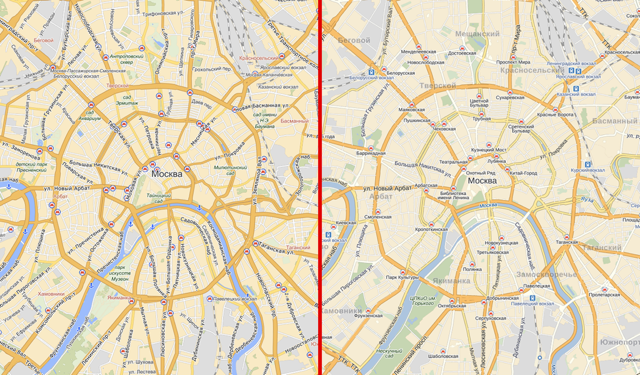
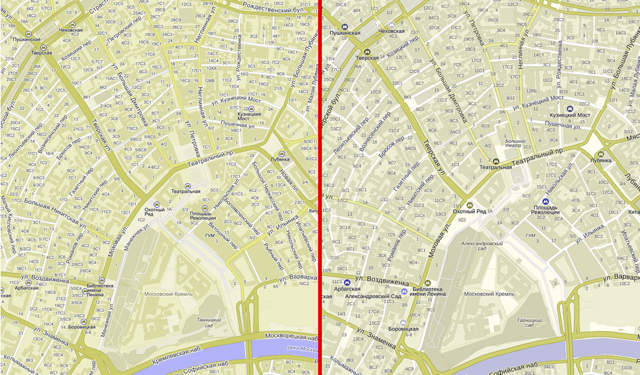
Again, due to masterful work with signatures, the map has become easier to read on the next scale. Also here we have identified the stations as the main transport hubs.
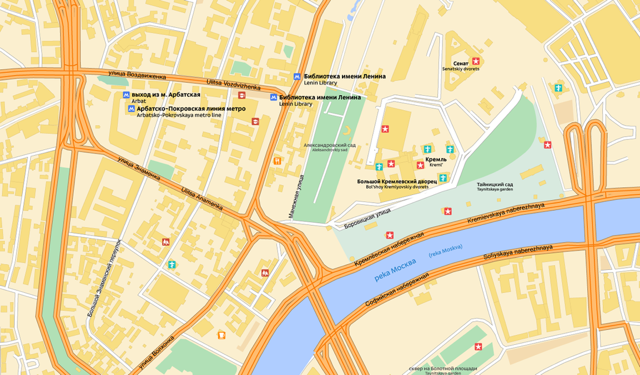
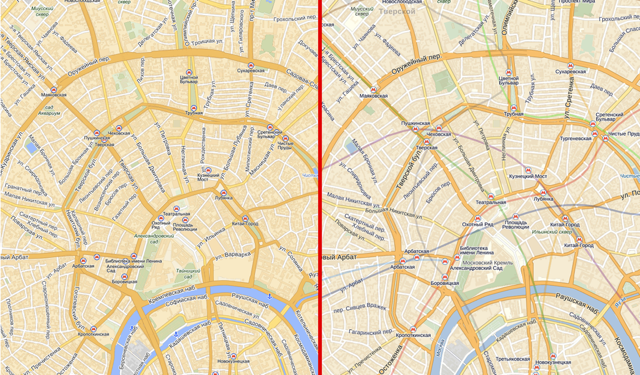
And on this scale, maps at subway stations appeared signatures. We managed to do it in such a way as not to overload the image.
Once we had the subway lines displayed, and then in one of the versions we thought to unload the picture by turning them off. Users did not like it and they immediately let us know about it through feedback. We made the lines smooth and returned them to the map - this is an important orienting information.
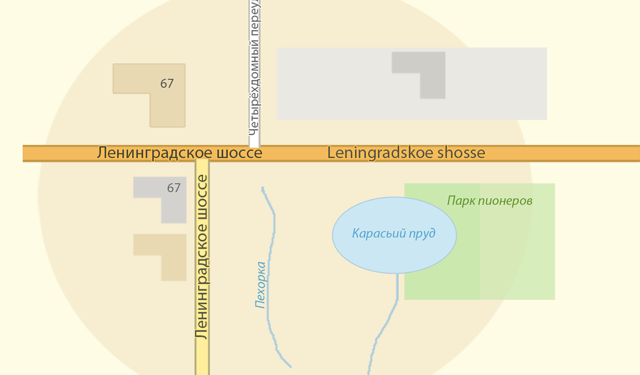
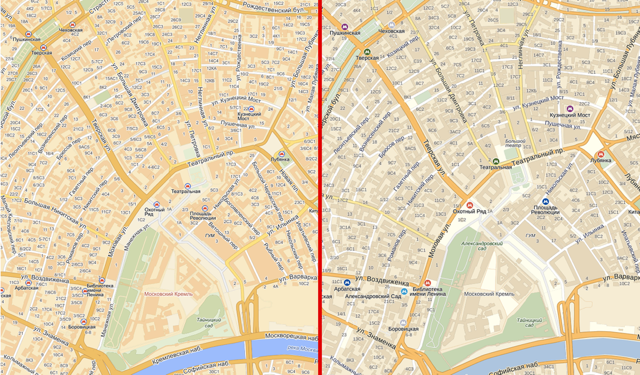
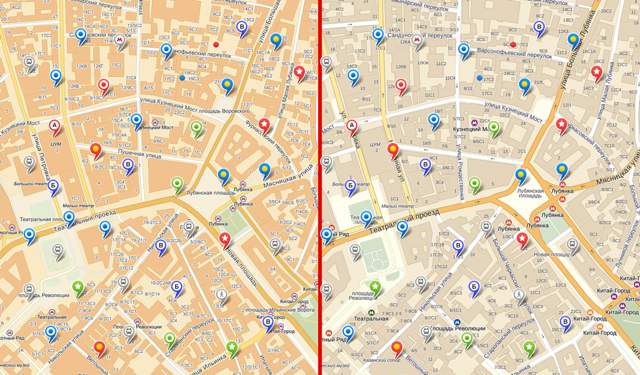
But already on the scale below the metro line they prevent to read house numbers and street names. We solved this problem by drawing the metro icon in the color of the line on which the station is located. Also, due to more successful work with color and signatures, they began to be read better and the rest of the objects made it easier for the user to find with his eyes what he needed.
Now let's check our map. So it looks printed.
And so with a bunch of tags on the map.
Users with a color perception violation have also become a bit easier to perceive. The next step is the design of traffic jams for these guys, this is a big problem now.
Users perceived the changes on the Maps very positively. At first I was very worried: people have a very high level of reflection on changes in card design. The experiences were in vain.
In the course of work on the design, we investigated, observed, tried, made mistakes, argued and discussed. But I do not consider the work completed. Maps are not oil paintings - this is a living product that needs to be constantly developed. We have a lot of ideas and plans. I think we are only somewhere in the middle of the road.
Why do I like cards?
The cards fascinate me with their beauty, behind which lies a great sense - information that has been painstakingly collected and structured.
For example, the Carta Marina brothers Magnus. It may seem that this is just a beautiful illustration. In fact, this is a unique historical document that contains a lot of information and historical facts about northern Europe of the XVI century. To date, only two copies of this card have been preserved.
')
Today, after many, many years, technologies and algorithms allow you to create incredible things in cartography.
Watercolor from Stamen Design.
Map tiles by Stamen Design. Data by OpenStreetMap
Some artists also like maps, and they use them to create their paintings or draw pictures in the form of fictional maps. For example, artist Mat Cusick created a series of works from old American geography textbooks.
But the map is not just a picture. Proper presentation of information helps to make important decisions.
The more accurate and more complete the information is, the more accurate the decisions will be. For example, the work card commander.
From the book “The working map of the commander” ID Pombrika and N.A. Shevchenko
The correct presentation of the map data can save lives. This is well illustrated by the story of a London physician, John Snow, who during a cholera outbreak in 1854 in the Soho district surveyed residents and marked on the map cases of cholera.
After three days of observation and studying the map, he concluded that the water column on Broad Street was infected. As a result, it was decided to bury her. After that, the cases of diseases have sharply declined. Now this place is a memorial dedicated to John Snow.
And there are a lot of such stories - when a correctly made map helped people.
So why do I like cards? Cartographic design is information design, and information design is:
- Complexity We work with large amounts of data. Decisions need to be made not only on which ones are needed, but also on how to use them as much as possible.
- Interdisciplinarity . To develop convenient maps, you need to be not only a designer or a cartographer. You need to be a researcher, a psychologist and an expert in several areas. Sometimes we even have to involve outside experts.
- Experiments This is incredibly cool: not only to do something, but also to see what you end up with and to watch how people use it. Working with cards is a set of experiments and practically unlimited possibilities to create something new.
Some guys explain the meaning of web cartography like this:
B is very close to what we do. So, the design of Yandex. Map. I'll tell you what we need to know in order to make a good map.
Context and environment
I have already said that the map is data, and without any design, it will look like this.
Just a layer of streets. And if you add a river and a layer of buildings, then so.
And we need to constantly invent something, so that people do not see our Maps like those on these pictures.
It may seem to an ordinary observer that almost nothing changes in Yandex.Maps. But if you look at time slices, it will become noticeable that we are constantly bringing in something new and experimenting.
But other guys work and improve their products. They must be observed and watched what they did.
It is important not to forget that maps have evolved on paper and have been “living” on it for many, many years, so a lot of experience can be learned from studying paper maps:
But Yandex.Maps is an interactive product, and simply switching between scales, the user switches several static (paper) maps. This means that our map must be consistent visually, regardless of how much information is displayed on it. Changing the design of the map with the switching scale should be predictable for the user.
In addition, Yandex.Maps are mainly used in two qualities: directly as a map and as a substrate for displaying different layers of information.
Our map is used on a mobile phone: on a sunny day and at night. And, of course, hundreds of thousands of drivers are looking at her in the car.
Despite the development of mobile technology, our map is printed. And not always printers print well.
By the way, one of the observations in Moscow is that pedestrians are looking at the printout of the map at the moment when they are coming up the escalator from the subway and are preparing to go through the so-called “last mile”. And there is not very good lighting.
Users
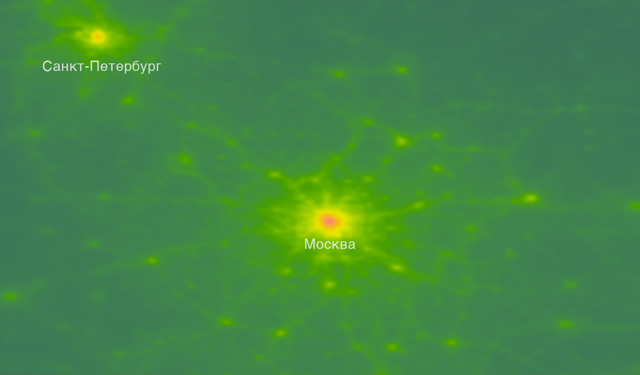
In addition to the environment, it is very important for us to know for whom we are creating our product and how these people will use it. The first thing that comes to mind for solving this problem is determining the territory of interest of users: where they look on the map and how intensely.
The heat map of requests shows well that people are interested in cities and territories along highways.
Since we are making an interactive map, it is necessary to take into account that users have different requests on different scales.
If it is very rough, then the scenarios for using different scales are approximately as follows:
- Man looks at the whole world. He wants to find and recognize the continents in order to find the country he is interested in.
- The person looks at the country (as in the picture above). He is interested in the location of cities and the relationship between them.
- The man looks at the whole city. It is important for him to see the districts and main highways: the main arteries of the highways make major cities recognizable and distinguishable among themselves.
- The man looks at the area. Streets and more local parts of the district are important to him.
- The man looks at the block or looks at the street. He is interested in the “last mile” of his route / search interest.
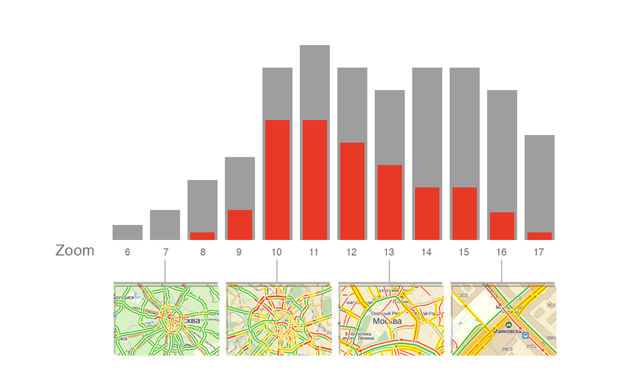
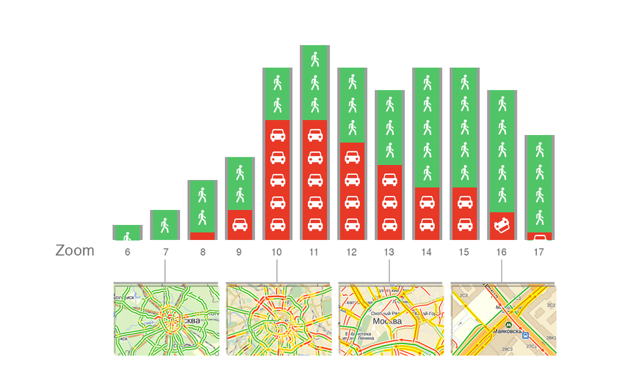
If you think a little more, for a better understanding of your users, you can look at the statistics of requests of those of them who use Jams.
It turns out that we have two worlds that intersect somewhere on a medium scale: pedestrians and motorists. This means that the design of the city map needs to be developed on the basis of the needs of these two groups and understanding to whom the scale of the map is more important.
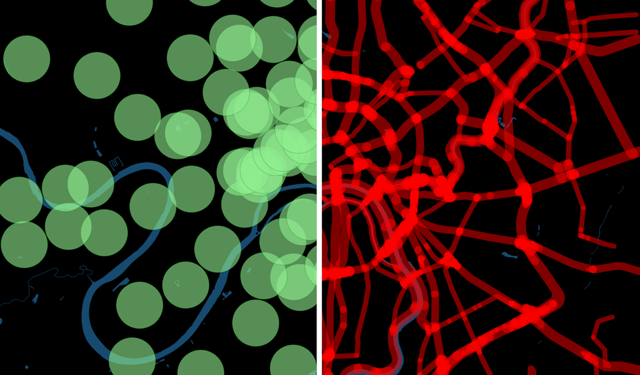
The presence of two different "maps of Moscow" can be illustrated by the picture below.
Pedestrians know the neighborhood around the subway well. These are islands with some urban life, weakly connected with each other (this is due to the fact that the metro scheme that does not correspond to the geographical location of stations completely distorts their ideas about the real location of these stations). Motorists move along the corridors of highways and know the road map quite well.
I decided to conduct a little experiment on myself. In the first picture I noted roads on which I feel confident without a map — the main streets where I often drive. Immediately I recalled the routes to work, the streets around the house or near work, and the road to airports or other places where I often went (large stores, for example).
And in the second picture I drew my “pedestrian” Moscow: areas where I do not need a map for orientation.
In smaller cities, where the metropolitan is not so well developed, pedestrians and motorists interfere with each other less. Pedestrians walking on public transport know the city better. Points of attraction for them are mostly areas or squares, and motorists use the streets, also knowing areas well.
The central part of Novosibirsk: districts, subways and streets
A pedestrian imagines the terrain is not at all as drawn on the map. And the orientation is not the same, and the points of interest are completely different. A mental map of the terrain in people's heads is a very important thing, understanding which helps to make maps more comfortable and more receptive.
In addition to memory, a person has a vision. Therefore, be sure to take into account the visual abilities of a person. According to various estimates, up to 10% of the male population of the planet have color perception disorders . Among women, they are much less common - only 0.5%.
Design
Rule of three trunk styles
Card design is not about beauty. He is about meanings. Like any design. It is about how difficult to make simple and convenient. I will illustrate this thesis on the example of street layer design.
The road layer is 1 style, the display categories are no different. It is absolutely impossible to understand and understand the structure of the city.
Since the roads are all different - the idea arises that each type of road should have its own visual presentation. And it becomes a little clearer. 7 road types = 7 display types.
But the user is very difficult to distinguish between the seven types of display - the difference between adjacent ones is too small for him. Therefore, in order to make the map more convenient, we make three of seven styles.
It seems now read easier.
And after we have decided on the meaning and information structure, we can think about a more aesthetic presentation. One of the main principles of Yandex maps is recognizability. Even if we copied the color palette or took a screenshot without specifying Yandex, most people will understand that Yandex.Maps is in front of them.
We called our method of displaying roads the “Rule of 3 styles of highways”. We decided to test it first in the design of the People’s Map, and then in the design of the map of Istanbul.
We liked the result, and we applied the rule in the design of the map of Moscow.
Color and palette
Experiments with a new palette of maps were also numerous and interesting. I will show a couple of funny options.
© OpenStreetMap
© OpenStreetMap
Agree, not that. So we began to think about how to return to the warm and recognizable Yandex.Map.
© OpenStreetMap
It is already warmer.
© OpenStreetMap
And finally, here is the concept that we like.
© OpenStreetMap
After making a concept and a series of experiments with a palette, a palette is born, which will be in Maps. I conducted several experiments with this picture: I looked at different monitors, ran out into the street with a mobile phone, looked at it with the eyes of the color makers, and printed it out on several printers. In fact, this is a prototype of the color palette of our Maps.
Pictograms
In addition to the display logic and color design, the map has icons.
Icon - a visual anchor for the card user. The icon should be understandable, readable and sufficiently visible on the colorful background of the map. And in the case when we have several icons, they should form a single visual row.
And since we are making an interactive product, where there is a different amount of information at each scale, the icons on Yandex.Maps have several sizes for different scales. For example, for railway stations, we made icons of four sizes.
Moscow map redesign
Armed with the knowledge and experimental results obtained, at the end of last summer we decided to change the map of Moscow. So, what we did.
Thanks to the rule of three styles, the highways on one of the most popular scales have become thinner, and the picture is cleaner. We have worked the signatures, a place has appeared for the signatures of the districts - this is important information for orientation.
Again, due to masterful work with signatures, the map has become easier to read on the next scale. Also here we have identified the stations as the main transport hubs.
And on this scale, maps at subway stations appeared signatures. We managed to do it in such a way as not to overload the image.
Once we had the subway lines displayed, and then in one of the versions we thought to unload the picture by turning them off. Users did not like it and they immediately let us know about it through feedback. We made the lines smooth and returned them to the map - this is an important orienting information.
But already on the scale below the metro line they prevent to read house numbers and street names. We solved this problem by drawing the metro icon in the color of the line on which the station is located. Also, due to more successful work with color and signatures, they began to be read better and the rest of the objects made it easier for the user to find with his eyes what he needed.
Now let's check our map. So it looks printed.
And so with a bunch of tags on the map.
Users with a color perception violation have also become a bit easier to perceive. The next step is the design of traffic jams for these guys, this is a big problem now.
Users perceived the changes on the Maps very positively. At first I was very worried: people have a very high level of reflection on changes in card design. The experiences were in vain.
In the course of work on the design, we investigated, observed, tried, made mistakes, argued and discussed. But I do not consider the work completed. Maps are not oil paintings - this is a living product that needs to be constantly developed. We have a lot of ideas and plans. I think we are only somewhere in the middle of the road.
Source: https://habr.com/ru/post/185952/
All Articles