Comparison of the scientific development of various countries of the world
How to compare the development of science in different countries of the world?
One indicator is the number of published scientific articles. On the SCIMAGO website one can find statistics of publications by countries, which includes the total number of published documents, the number of cited documents (articles, reviews, conference reports), the number of citations.
At the same time, it is strange to simply compare the number of publications in the United States and, for example, in the Czech Republic, in order to compare the level of development of science in these countries. You must use some kind of scaling indicator. The easiest way to use GDP (at purchasing power parity). The relationship between GDP and the number of items is not necessarily linear. We'll have to rob Wikipedia to get GDP for different countries. For this, I will use Ruby with the Nokogiri extension. I will rob a Wikipedia page.
The project code is listed on Github .
')
As a result, we obtain data on GDP, the number of articles and the number of citing the first 50 countries by the number of articles in the form of a csv file.
To process this file, use the environment R. Load the data in R:
We count the number of articles and citations for 1 billion dollars of GDP (a certain indicator of the scientific nature of GDP).
The data are in a separate table in order not to impair the readability of the article.
Table 1. The first approximation .
Interesting to get the data. A bit discouraged. First of all, quite low in the US. We need another indicator, more believable.
Let's try to plot the number of items on GDP.
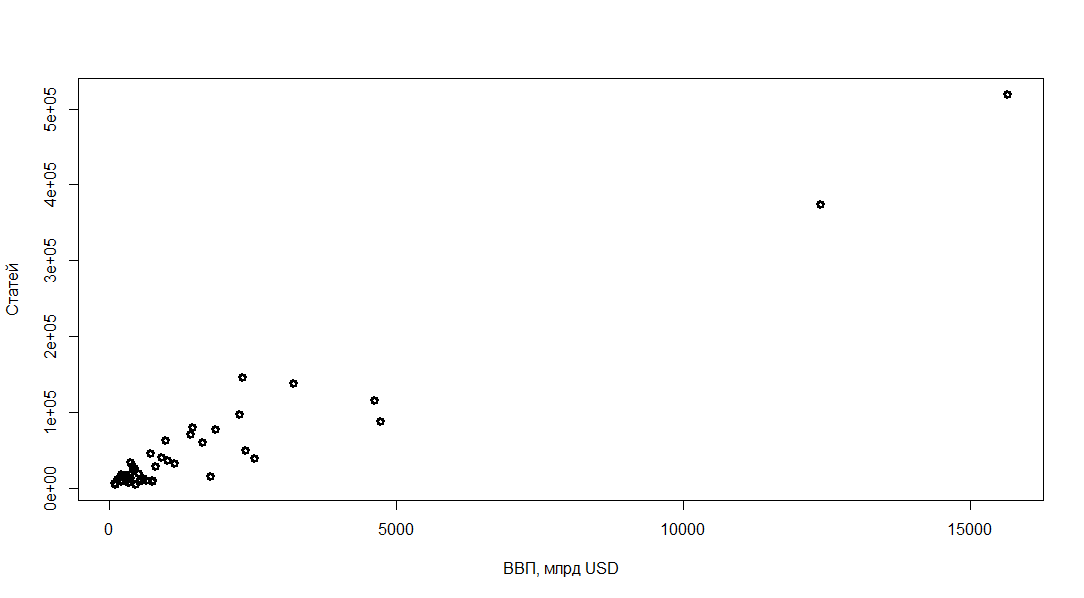
Honestly not. All points are concentrated at the beginning of the graph. Let's try to build a graph in logarithmic coordinates.

Looks better. And we managed to build the dependence of the number of articles on GDP.
We get a correlation of 0.74, which is very good for 50 points. We can predict the number of scientific articles on the country's GDP.
Articles = 140 * GDP ^ 0.79
Now we take as a parameter the development of science (PR1) in the country the ratio of the number of published articles to the predicted number (multiplied by 100). Essentially, the forecast number of items is an average for a given GDP. If the PR is more than 100, then the country pays more attention to science than the world average among countries similar in economic development. As the second parameter (PR2) we take the same indicator, but calculated for citations. The results in table 2 .
According to PR1, Russia occupies 41 place (54 points) among other raw-material countries. According to PR2 (related to the citation of articles) is on the 46th place.
One indicator is the number of published scientific articles. On the SCIMAGO website one can find statistics of publications by countries, which includes the total number of published documents, the number of cited documents (articles, reviews, conference reports), the number of citations.
At the same time, it is strange to simply compare the number of publications in the United States and, for example, in the Czech Republic, in order to compare the level of development of science in these countries. You must use some kind of scaling indicator. The easiest way to use GDP (at purchasing power parity). The relationship between GDP and the number of items is not necessarily linear. We'll have to rob Wikipedia to get GDP for different countries. For this, I will use Ruby with the Nokogiri extension. I will rob a Wikipedia page.
The project code is listed on Github .
')
As a result, we obtain data on GDP, the number of articles and the number of citing the first 50 countries by the number of articles in the form of a csv file.
To process this file, use the environment R. Load the data in R:
dataf = read.csv("test.csv", sep=";", header=F)names(dataf) = c("country", "gdp", "articles", "citations")We count the number of articles and citations for 1 billion dollars of GDP (a certain indicator of the scientific nature of GDP).
dataf$articles_per_gdp = dataf$articles/dataf$gdpdataf$citation_per_gdp = dataf$citations/dataf$gdpThe data are in a separate table in order not to impair the readability of the article.
Table 1. The first approximation .
Interesting to get the data. A bit discouraged. First of all, quite low in the US. We need another indicator, more believable.
Let's try to plot the number of items on GDP.
plot(dataf$articles ~ dataf$gdp, lwd="3", xlab=", USD", ylab=", ")Honestly not. All points are concentrated at the beginning of the graph. Let's try to build a graph in logarithmic coordinates.
plot(log(dataf$articles) ~ log(dataf$gdp), lwd="3", xlab="Log(GDP)", ylab="Log(Articles)")abline(lm(log(dataf$articles) ~ log(dataf$gdp)), lwd=3, col="blue")Looks better. And we managed to build the dependence of the number of articles on GDP.
summary(lm(log(dataf$articles) ~ log(dataf$gdp)))We get a correlation of 0.74, which is very good for 50 points. We can predict the number of scientific articles on the country's GDP.
Articles = 140 * GDP ^ 0.79
Now we take as a parameter the development of science (PR1) in the country the ratio of the number of published articles to the predicted number (multiplied by 100). Essentially, the forecast number of items is an average for a given GDP. If the PR is more than 100, then the country pays more attention to science than the world average among countries similar in economic development. As the second parameter (PR2) we take the same indicator, but calculated for citations. The results in table 2 .
According to PR1, Russia occupies 41 place (54 points) among other raw-material countries. According to PR2 (related to the citation of articles) is on the 46th place.
Source: https://habr.com/ru/post/185864/
All Articles