Statistics of space launches in the USSR and Russia according to Roscosmos
Do Russian rockets fall so often? Still, no one is mistaken who does nothing. The number of launches seems to be growing, and the number of accidents is growing accordingly. Launch statistics are available on the Roscosmos website. Under the cat an attempt to analyze this statistics.
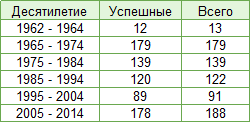
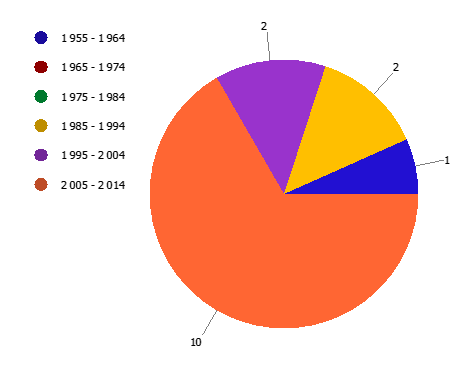
You can collect data from the Roscosmos website, for example, with a parser. From the table I threw the upcoming launch in July. For successful took start, marked as "Successful" and "Partially successful." Accordingly, all the others are unsuccessful. Further, the data were grouped by decades and 5 years. The countdown began in 1955, because around 2005, there were a large number of unsuccessful launches, and I would not like to smear them. It turned out this table:
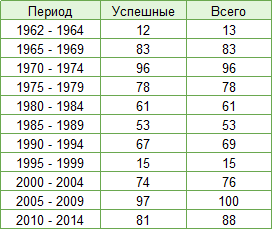
and such
as well as histogram
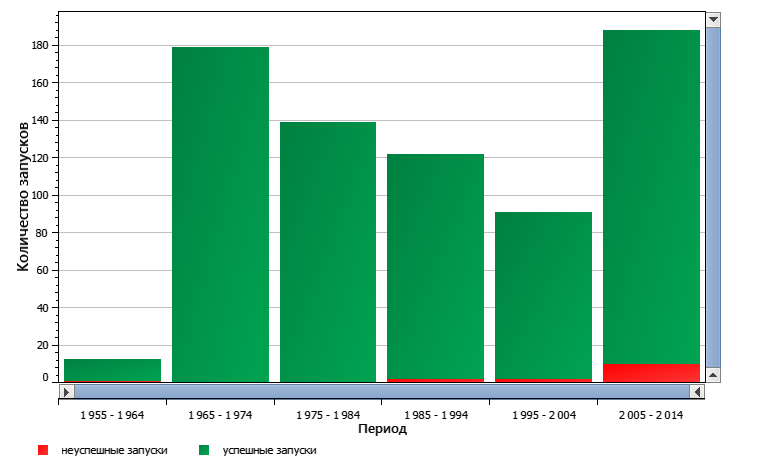
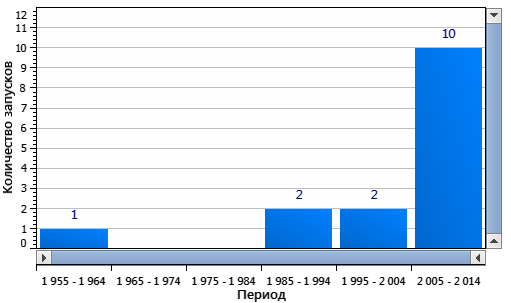
To the naked eye, it can be seen that in recent years the “red” zone on the graph has increased dramatically. If you only build graphs of unsuccessful launches, you get this picture:
You can try to estimate the deviation of the share of unsuccessful launches in recent years. For example, using a linear regression model . I used the data until 2005. From the first table (10 years), the ratio was:
S = 0.994123 * N, where S is the number of successful launches, N is the total
From the second table (5 years) - S = 0.992358 * N
In accordance with the obtained ratios of 188 launches made after 2005, 186.9 and 186.6 launches, respectively, should have been successful. Rounding down we get 186. 178 launches were really successful. Those. 8 launches were emergency "above normal".
I propose to draw conclusions independently.
UPD Laid out the raw data
You can collect data from the Roscosmos website, for example, with a parser. From the table I threw the upcoming launch in July. For successful took start, marked as "Successful" and "Partially successful." Accordingly, all the others are unsuccessful. Further, the data were grouped by decades and 5 years. The countdown began in 1955, because around 2005, there were a large number of unsuccessful launches, and I would not like to smear them. It turned out this table:
and such
as well as histogram
To the naked eye, it can be seen that in recent years the “red” zone on the graph has increased dramatically. If you only build graphs of unsuccessful launches, you get this picture:
You can try to estimate the deviation of the share of unsuccessful launches in recent years. For example, using a linear regression model . I used the data until 2005. From the first table (10 years), the ratio was:
S = 0.994123 * N, where S is the number of successful launches, N is the total
From the second table (5 years) - S = 0.992358 * N
In accordance with the obtained ratios of 188 launches made after 2005, 186.9 and 186.6 launches, respectively, should have been successful. Rounding down we get 186. 178 launches were really successful. Those. 8 launches were emergency "above normal".
I propose to draw conclusions independently.
UPD Laid out the raw data
')
Source: https://habr.com/ru/post/185582/
All Articles