Bresenham and U on guard of the diagonals
What are you looking at now? If you are not from a parallel universe, where everyone is sitting behind vector monitors, then you have a raster image. Look at this strip: /. If you move closer to the monitor, you can see pixel steps that try to pretend to be a vector line. For this purpose, there is a whole bunch of various rasterization algorithms, but I would like to talk about the Bresenham algorithm and the Y algorithm, which find an approximation of the vector segment in raster coordinates.
I encountered the problem of rasterization while working on a procedural generator of building plans. I needed to present the walls of the room in the form of cells of a two-dimensional array. Similar tasks can occur in physical calculations, path finding algorithms, or lighting calculations if space partitioning is used. Who would have thought that acquaintance with rasterization algorithms might come in handy one day?
The principle of operation of the Brezenham algorithm is very simple. Take a segment and its initial x coordinate. To X in the cycle we add one by one in the direction of the end of the segment. At each step, an error is calculated - the distance between the real y coordinate at this location and the nearest grid cell. If the error does not exceed half the height of the cell, then it is filled. That's the whole algorithm.
')
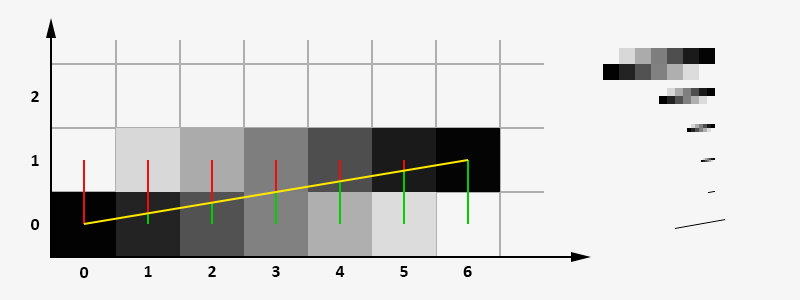
It was the essence of the algorithm, in fact, everything looks as follows. First, the slope coefficient (y1 - y0) / (x1 - x0) is calculated. The error value at the starting point of the segment (0,0) is assumed to be zero and the first cell is filled. In the next step, the error factor is added to the error and its value is analyzed, if the error is less than 0.5 , the cell is filled (x0 + 1, y0) , if it is larger, the cell is filled (x0 + 1, y0 + 1) and one is subtracted from the error value . The picture below shows the yellow line before rasterization, green and red - the distance to the nearest cells. The angular coefficient is one sixth, at the first step the error becomes equal to the angular coefficient, which is less than 0.5 , which means the ordinate remains the same. By the middle of the line, the error crosses the line, the unit is subtracted from it, and the new pixel rises higher. And so on until the end of the segment.

Another nuance. If the projection of the segment on the x- axis is less than the projection on the y- axis or the beginning and end of the segment is interchanged, then the algorithm will not work. To avoid this, you need to check the direction of the vector and its slope, and then, if necessary, interchange the coordinates of the segment, rotate the axes, and, ultimately, reduce everything to one or at least two cases. The main thing to remember while drawing is to return the axes in place.
To optimize the calculations, apply a trick with multiplying all fractional variables by dx = (x1 - x0) . Then, at each step, the error will change to dy = (y1 - y0) instead of the slope and to dx instead of one. You can also change the logic a bit, “move” the error so that the border is at zero, and you can check the error sign, it can be faster.
Something like this might look like code for drawing a raster line using the Brezenham algorithm. Wikipedia pseudocode remade under C #.
void BresenhamLine(int x0, int y0, int x1, int y1) { var steep = Math.Abs(y1 - y0) > Math.Abs(x1 - x0); // // , if (steep) { Swap(ref x0, ref y0); // Swap(ref x1, ref y1); } // , if (x0 > x1) { Swap(ref x0, ref x1); Swap(ref y0, ref y1); } int dx = x1 - x0; int dy = Math.Abs(y1 - y0); int error = dx / 2; // dx, int ystep = (y0 < y1) ? 1 : -1; // y int y = y0; for (int x = x0; x <= x1; x++) { DrawPoint(steep ? y : x, steep ? x : y); // error -= dy; if (error < 0) { y += ystep; error += dx; } } } The Bresenham algorithm has a modification for drawing circles. There, everything works according to a similar principle, something even easier. The calculation is for one octant, and all other pieces of the circle are drawn by symmetry.
Sample code for drawing a circle in C #.
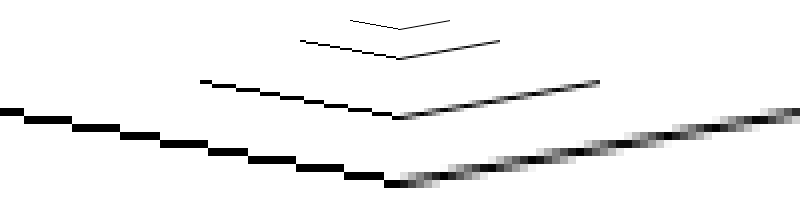
void BresenhamCircle(int x0, int y0, int radius) { int x = radius; int y = 0; int radiusError = 1 - x; while (x >= y) { DrawPoint(x + x0, y + y0); DrawPoint(y + x0, x + y0); DrawPoint(-x + x0, y + y0); DrawPoint(-y + x0, x + y0); DrawPoint(-x + x0, -y + y0); DrawPoint(-y + x0, -x + y0); DrawPoint(x + x0, -y + y0); DrawPoint(y + x0, -x + y0); y++; if (radiusError < 0) { radiusError += 2 * y + 1; } else { x--; radiusError += 2 * (y - x + 1); } } } Now, about Xiaolin's algorithm for drawing smoothed lines. It differs in that at each step the calculation is carried out for the two pixels nearest to the straight line, and they are painted over with different intensity, depending on the distance. The exact intersection of the middle of the pixel gives 100% intensity, if the pixel is at a distance of 0.9 pixels, then the intensity will be 10%. In other words, one hundred percent intensity is divided between pixels, which limit the vector line from two sides.
The image above shows the distances to two adjacent pixels in red and green.
To calculate the error, you can use a variable with a floating point and take the error value from the fractional part.
Approximate code of the smoothed line W Xiaolin in C #.
private void WuLine(int x0, int y0, int x1, int y1) { var steep = Math.Abs(y1 - y0) > Math.Abs(x1 - x0); if (steep) { Swap(ref x0, ref y0); Swap(ref x1, ref y1); } if (x0 > x1) { Swap(ref x0, ref x1); Swap(ref y0, ref y1); } DrawPoint(steep, x0, y0, 1); // steep DrawPoint(steep, x1, y1, 1); // — float dx = x1 - x0; float dy = y1 - y0; float gradient = dy / dx; float y = y0 + gradient; for (var x = x0 + 1; x <= x1 - 1; x++) { DrawPoint(steep, x, (int)y, 1 - (y - (int)y)); DrawPoint(steep, x, (int)y + 1, y - (int)y); y += gradient; } } If you suddenly have to work with grids in the future, think for a while, maybe you reinvent the wheel and in fact you work with pixels, although you don’t know it. Modifications of these algorithms can be used in games to search for cells in front of a unit on the map, calculate the area of impact of a shot or a beautiful arrangement of objects. Or you can simply draw the lines, as in the program on the links below.
Unity Web Player | Windows | Linux | Mac | Sources on GitHub
Left mouse button - Brezenhem, right mouse button - Y, spacebar - clear, Esc - exit.
For Linux users: Make the BresenhamWu file executable with chmod + x BresenhamWu and run.
The Rosetta Code has code in different languages for the Bresenham algorithm and the Y algorithm . Link to Wu Xiaolin's article
Source: https://habr.com/ru/post/185086/
All Articles