Landsat 8 ranges in operation
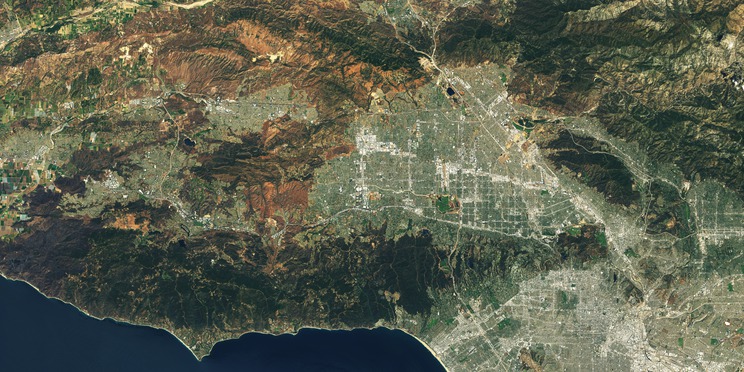
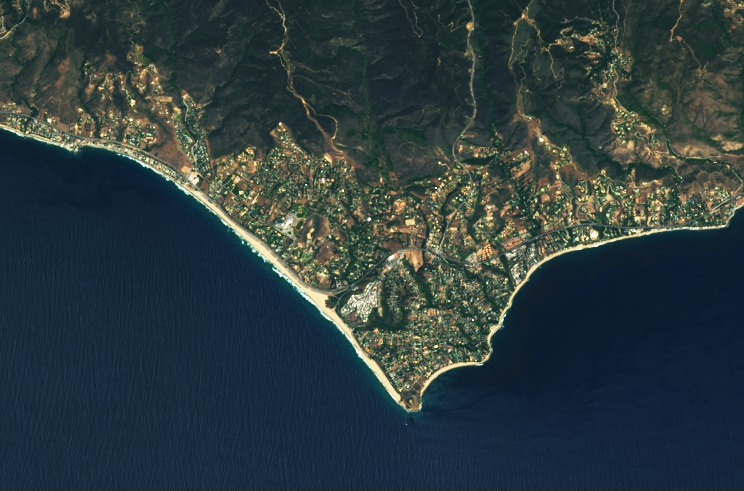
Here is an image of Los Angeles, taken as if by a conventional digital camera (if it had 10 times more megapixels and it was in space). This is a photograph two weeks ago taken from Landsat 8, which was launched by NASA at the end of winter. Landsat 8 has already become one of our favorite data sources, and not just ours: at the State of the map conference last weekend, he jumped into conversations of people involved in a variety of things. In addition to adding fresh, full-color photos from Landsat 8 to the Mapbox Satellite, we also use the multispectral data that the satellite provides. Data from the invisible ranges of the spectrum allow us to analyze many different aspects, starting with surface types, ending with crop growth and natural disasters around the world, sometimes within a few hours. This post describes some of the features of Landsat 8 and allows you to look at the world through its lens.
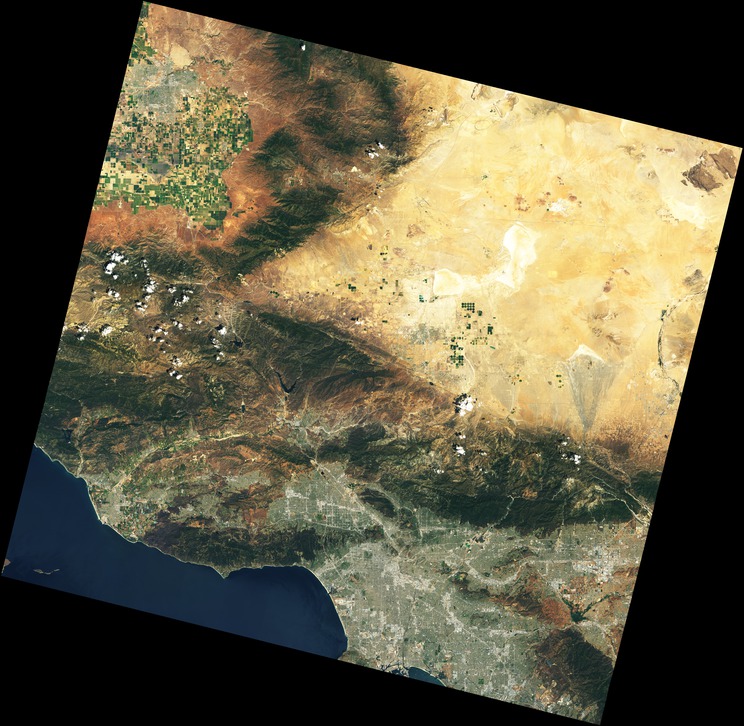
In Landsat 8 terminology, this image includes 4-3-2 ranges. The range is the bandwidth of the electromagnetic spectrum or color, not necessarily visible to the human eye. Landsat designates the red, green, and blue sensors as 4.3 and 2, respectively, so when we combine an image with these sensors, we get a full-color image like the one on top. Here is a complete list of Landsat 8 ranges:
')
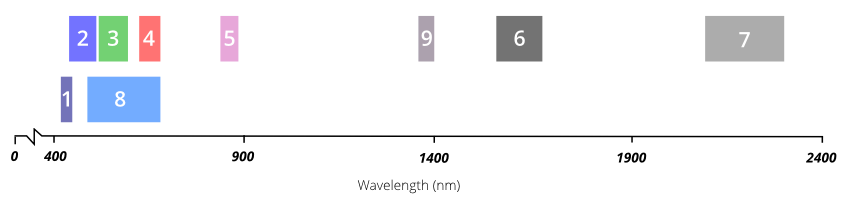
Among the 11 bands, only short-wave (1-4 and 8) correspond to the visible spectrum, the rest are sensitive to the spectral areas that the human eye does not distinguish. The full color image is only half of what Landsat actually sees. To find out why we need all these ranges, let's look at each of them individually.
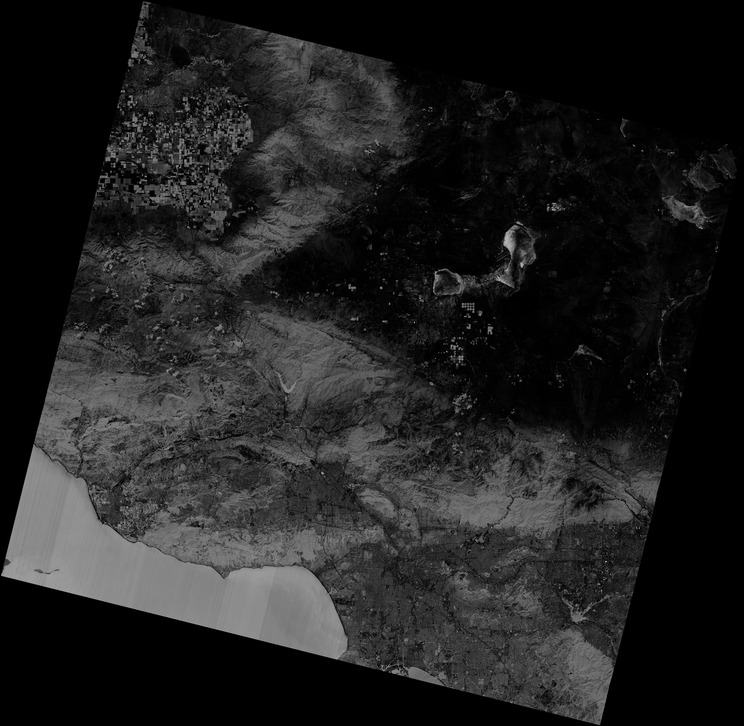
Image in Range 1 minus Range 2. Ocean and living plants reflect more dark purple tones. Most plants produce a substance called epicuticular wax (for example, white bloom on fresh plums), which reflects ultraviolet light.
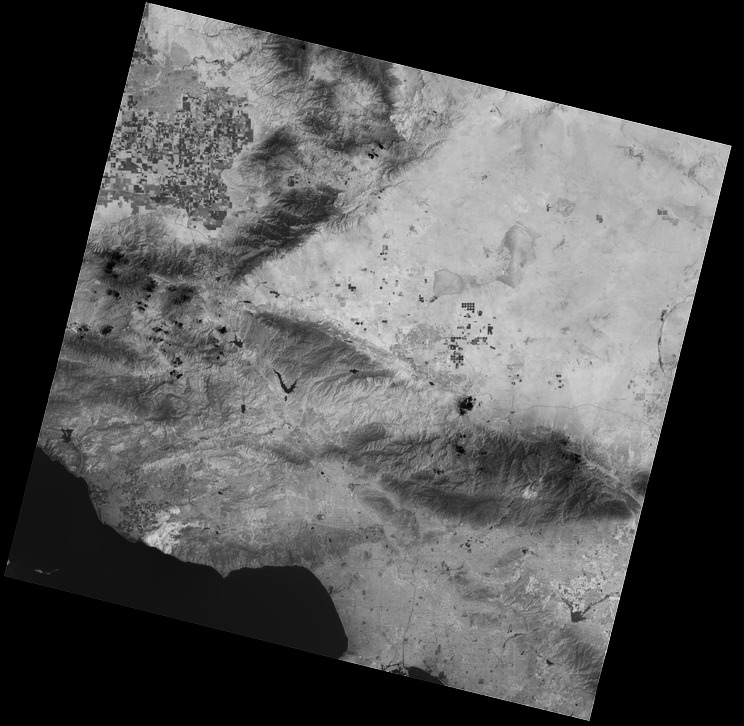
Part of West Los Angeles, from farmland near Oxnard in the west to Hollywood in the east. Like many other urban areas, on this scale is visible mainly in gray tones.
Bright spots are parks or other areas with lots of moist vegetation. At the bottom of the picture is Malibu, so you can bet that the bright spot next to the hills is golf courses. In the west, there is a dark plume of a large fire, which is barely visible in the full-color image.
The trail of fire is now impossible not to notice - strongly reflecting in Range 7 and practically not reflecting in others, it turns red. Previously unclear details of vegetation become clear. It seems that the plants in the canyons to the north of Malibu grow more magnificently than those on the mountain ranges, which is typical of a climate where the presence of water is the main limitation of growth. We also see vegetation distribution in Los Angeles — some areas have more plantings (parks, trees on pavements, lawns) than others.

And now on a full color image on the same scale:
The color version looks blurred because the sensors do not perceive details of that size. But if we combine color information with a detailed panchromatic snapshot, the picture will be clear and colored:
In Range 9, only clouds are visible! Clouds are a real problem for satellite imagery, because of the blurred edges are difficult to see in normal ranges, and images taken through them may have discrepancies with others. With the help of Range 9 it is easy to track.
Notice that the very dark (cold) spots correspond to the clouds from the image in Range 9. Then comes moisturized vegetation, open water and natural vegetation. The trail of a fire near Malibu, covered with coal and dead vegetation, therefore, has a very high temperature. In the city, parks have the lowest temperature, and industrial areas are the hottest. This picture does not show the effect of “urban heat islands”, for the study of which the TIR range is most useful.
Let's create another colorized image using TIR instead of the red channel, SWIR instead of green and green instead of blue (10-7-3).

Urban areas and some soil types are depicted pink. In the full-color picture, wild vegetation is painted in almost uniform green, but here we see the difference between peach, dark red and other colors. The cool coastal breeze is seen as a magenta gradient along the coast. The colored stripes on the sides of the image are explained by the difference in the coverage area of the sensors.
We reviewed only one of the more than 25,000 locations that are already contained in NASA / USGS Landsat 8 archives, indexed, documented and completely free for any use. Every day adds 400 gigabytes of images. The potential of this collection is huge, and I hope that you have found something for yourself that would attract you to study the data of Landsat 8 yourself.
Follow @MapBox on Twitter, where we will publish information about using opensource tools to load and process Landsat 8 data. Feel free to ask questions to Chris (@hrwgc) or me (@vruba).
In Landsat 8 terminology, this image includes 4-3-2 ranges. The range is the bandwidth of the electromagnetic spectrum or color, not necessarily visible to the human eye. Landsat designates the red, green, and blue sensors as 4.3 and 2, respectively, so when we combine an image with these sensors, we get a full-color image like the one on top. Here is a complete list of Landsat 8 ranges:
')
Among the 11 bands, only short-wave (1-4 and 8) correspond to the visible spectrum, the rest are sensitive to the spectral areas that the human eye does not distinguish. The full color image is only half of what Landsat actually sees. To find out why we need all these ranges, let's look at each of them individually.
Ranges
Range 1
sensitive to dark blue and purple colors. Blue color is difficult to dispel from space, as it is well dispersed on dust and water particles in the air, as well as on the air molecules themselves. This is one of the reasons why distant objects (for example, a mountain on the horizon) have a bluish tint, and also why the sky is blue. Just like we see a blue haze when we look at the sky on a sunny day, so Landsat looks at us through the same air. This part of the spectrum is poorly recorded with sufficient accuracy to be of any use, and Range 1 is a unique tool that provides open data at such a resolution. This is one of the things that makes this satellite special. This range is also called coastal or aerosol, according to its two main uses: it shows shallow water and the smallest particles of dust and smoke in the air. The image in this range looks almost the same as in Range 2, but if you increase the contrast, you can see the difference:Image in Range 1 minus Range 2. Ocean and living plants reflect more dark purple tones. Most plants produce a substance called epicuticular wax (for example, white bloom on fresh plums), which reflects ultraviolet light.
Ranges 2, 3 and 4
we have already seen, they represent the visible blue, green and red spectra. But before we go further, let's take this image of Los Angeles, which shows various land-use options for comparison with other bands.Part of West Los Angeles, from farmland near Oxnard in the west to Hollywood in the east. Like many other urban areas, on this scale is visible mainly in gray tones.
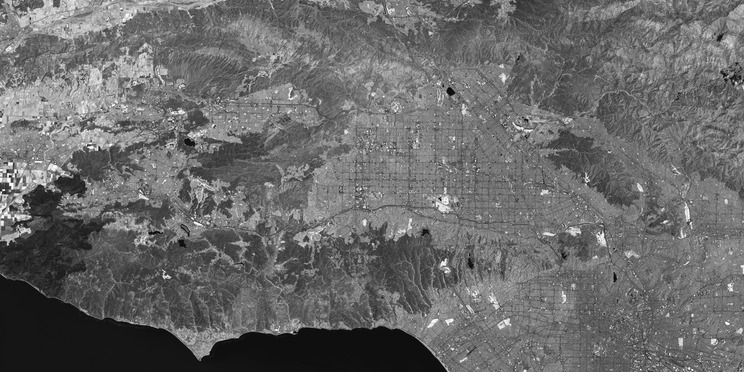
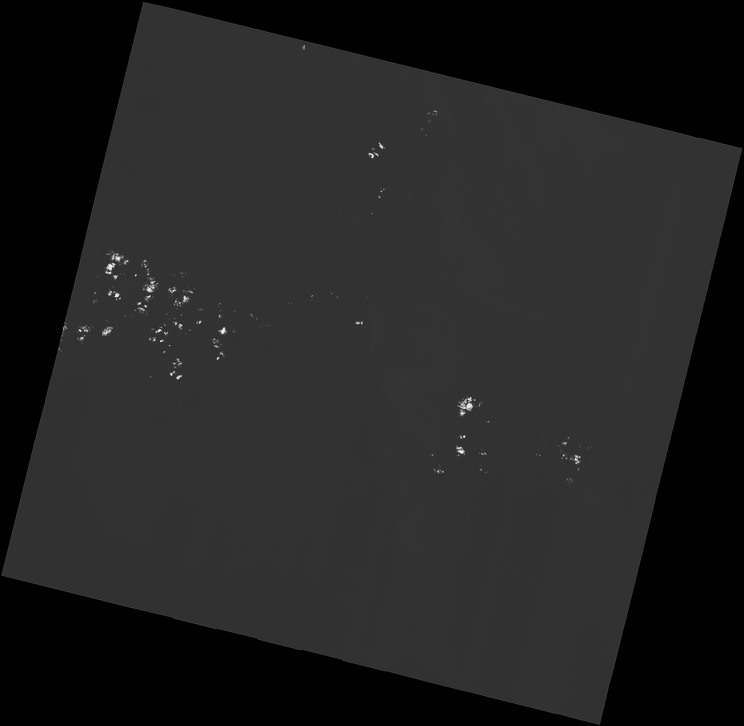
Range 5
measures near infrared spectrum or NIR (Near Infrared). This part of the spectrum is especially important for environmentalists, because the water in the leaves of healthy plants reflects it. Comparing with images of other ranges, we get indices like NDVI ( Normalized Difference Vegetation Index - normalized relative vegetation index - a simple quantitative measure of the photosynthetically active biomass (vegetation index). One of the most common and used indices for solving problems using quantitative estimates of vegetation cover - Approx. Ln. ), Which allow us to measure the health of plants more accurately than if we simply assessed the visible green.Bright spots are parks or other areas with lots of moist vegetation. At the bottom of the picture is Malibu, so you can bet that the bright spot next to the hills is golf courses. In the west, there is a dark plume of a large fire, which is barely visible in the full-color image.
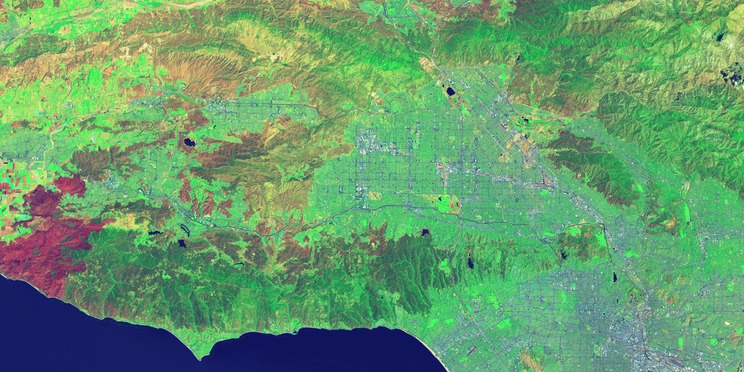
Ranges 6 and 7
cover different parts of shortwave infrared or SWIR (shortwave infrared). They distinguish between dry and wet land, as well as rocks and soils that look similar in other ranges, but differ in SWIR. Take a look at a colored image in which SWIR is used instead of the red channel, NIR instead of green and dark blue instead of blue (technically, this is a combination of ranges 7-5-1):The trail of fire is now impossible not to notice - strongly reflecting in Range 7 and practically not reflecting in others, it turns red. Previously unclear details of vegetation become clear. It seems that the plants in the canyons to the north of Malibu grow more magnificently than those on the mountain ranges, which is typical of a climate where the presence of water is the main limitation of growth. We also see vegetation distribution in Los Angeles — some areas have more plantings (parks, trees on pavements, lawns) than others.
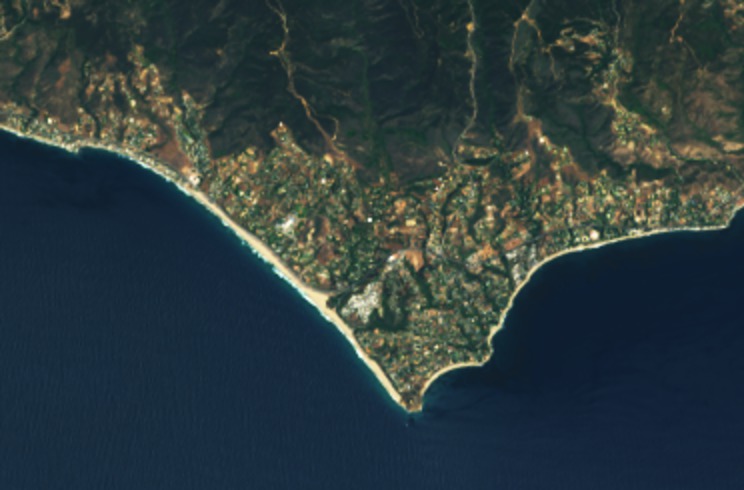
Range 8
- panchromatic. It resembles a black and white film: instead of dividing colors across the spectrum, it collects them all in one channel. Due to this, he perceives more light and gives the clearest picture among all ranges. Its resolution is 15 meters. Let's take a look at the Malibu on a 1: 1 scale in the panchromatic range:And now on a full color image on the same scale:
The color version looks blurred because the sensors do not perceive details of that size. But if we combine color information with a detailed panchromatic snapshot, the picture will be clear and colored:
Range 9
This is one of the most interesting features of Landsat 8. It covers a very narrow band of wavelengths - 1370 ± 10 nanometers. Few of the space tools register this part of the spectrum, since it is almost completely absorbed by the atmosphere. Landsat 8 takes advantage of this. Since the land in this range is barely distinguishable, it means everything that is clearly visible in it, either reflects very well, or is outside the atmosphere. Here is a snapshot of the same place in Range 9:In Range 9, only clouds are visible! Clouds are a real problem for satellite imagery, because of the blurred edges are difficult to see in normal ranges, and images taken through them may have discrepancies with others. With the help of Range 9 it is easy to track.
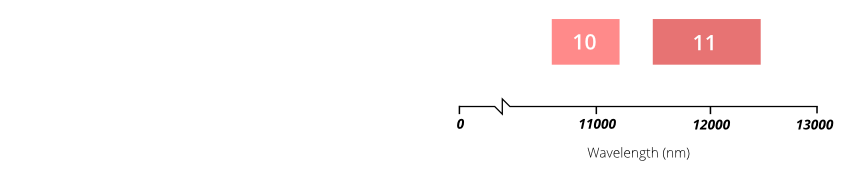
Ranges 10 and 11
This thermal IR or TIR (thermal infrared) - they see the heat. Instead of measuring air temperature, as weather stations do, they measure the surface temperature, which is often much higher. Recent studies have shown that the surface temperature in the deserts can reach 70 degrees Celsius - enough to fry an egg. Fortunately, Los Angeles is rather moderate in this regard:Notice that the very dark (cold) spots correspond to the clouds from the image in Range 9. Then comes moisturized vegetation, open water and natural vegetation. The trail of a fire near Malibu, covered with coal and dead vegetation, therefore, has a very high temperature. In the city, parks have the lowest temperature, and industrial areas are the hottest. This picture does not show the effect of “urban heat islands”, for the study of which the TIR range is most useful.
Let's create another colorized image using TIR instead of the red channel, SWIR instead of green and green instead of blue (10-7-3).
Urban areas and some soil types are depicted pink. In the full-color picture, wild vegetation is painted in almost uniform green, but here we see the difference between peach, dark red and other colors. The cool coastal breeze is seen as a magenta gradient along the coast. The colored stripes on the sides of the image are explained by the difference in the coverage area of the sensors.
And what else?
We reviewed only one of the more than 25,000 locations that are already contained in NASA / USGS Landsat 8 archives, indexed, documented and completely free for any use. Every day adds 400 gigabytes of images. The potential of this collection is huge, and I hope that you have found something for yourself that would attract you to study the data of Landsat 8 yourself.
Follow @MapBox on Twitter, where we will publish information about using opensource tools to load and process Landsat 8 data. Feel free to ask questions to Chris (@hrwgc) or me (@vruba).
Source: https://habr.com/ru/post/183416/
All Articles