Pinboard - we are pumping Pinba to monitor PHP
 There is a useful and necessary tool for monitoring PHP called pinba . It allows you to collect statistics on the execution of PHP-scripts of your project. We implemented a small system that complements Pinba, and called it Pinboard (Pinba board).
Essence of the work
Pinba stores only real-time data for the last few minutes, which is very cool, but not always convenient. Pinboard periodically aggregates this data into its own repository and provides simple means of viewing and analyzing this information, and in the near future, means of simplest monitoring.
Opportunities
Overview of PHP scripts
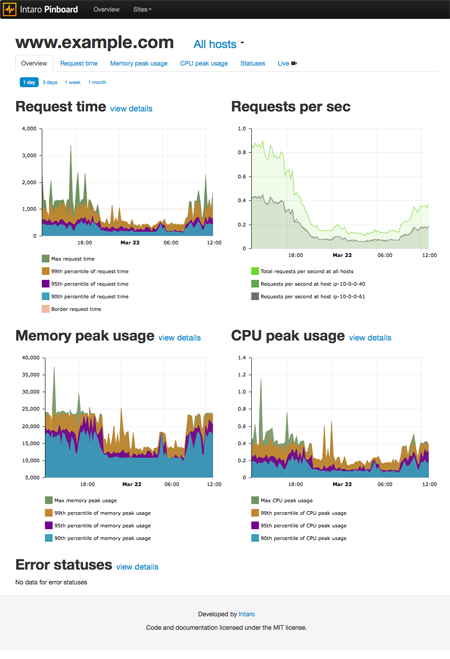 For each host pinba is connected to, you can see the charts:
')
- script execution time;
- used memory;
- requests per second;
- and the number of requests with 5xx statuses.
At the same time, the graphs of the execution time and the used memory are plotted along the percentiles in the form of 4 curves. For example, for runtime, this is:
- maximum execution time of 90% "fastest" requests
- maximum runtime 95% of the “fastest” requests
- maximum execution time of 99% "fastest" requests
- maximum time of all requests
Data can be viewed both for the entire site and for individual servers if the site is served by several servers.
Monitoring the slowest and most "heavy" scripts
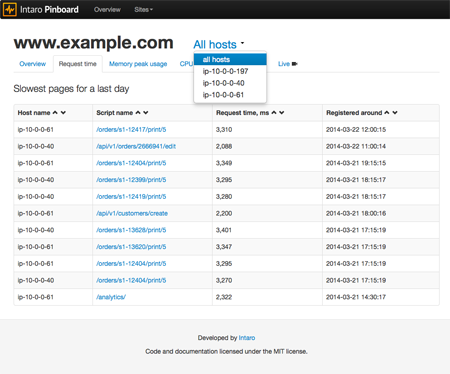 In Pinboard, you can set the maximum allowable values for the execution time of scripts and the memory used by them. All scripts that did not meet the specified limits are recorded in Pinboard and are available in a separate section for viewing. You can specify both general values and individual values for individual sites. All settings are set in yml in this form:
logging: # in seconds long_request_time: global: 1.0 "supersite1.com": 0.8 "superfastsite2.com": 0.3 # max memory usage in kB heavy_request: global: 30000 "coolsite.ru": 5000 "heavysite.ru": 30000 Also, as in the case of overview information, reports can be viewed both for the entire site and for a single server serving the site.
Monitoring requests with errors
Pinboard tracks and records in a separate section the scripts that returned 5xx status. In the near future, we will add the ability to notify by mail about such scripts.
Live mode
 The system has a separate section in which Pinboard displays real-time data from pinba tables. You can see who and what is currently browsing the site. For each request, information on the execution time and used memory is displayed.
As a result
We have connected to Pinboard a significant part of projects that we develop and support. At the moment, our Pinboard captures about 2 million requests per day. The storage period we set per month. During this time, about 2 GB of data is collected.
In the near future we want to add 2 important features:
notification of mail with error pages(done) ;- tag support pinba.
In general, we will welcome suggestions, comments and assistance in the development of the system. The project is published under the MIT license.
Links
Project website: http://intaro.imtqy.com/pinboard/
Github: https://github.com/intaro/pinboard
Documentation: https://github.com/intaro/pinboard/wiki
Source: https://habr.com/ru/post/183104/
All Articles