Implement sampling, caching and drawing photos on a map
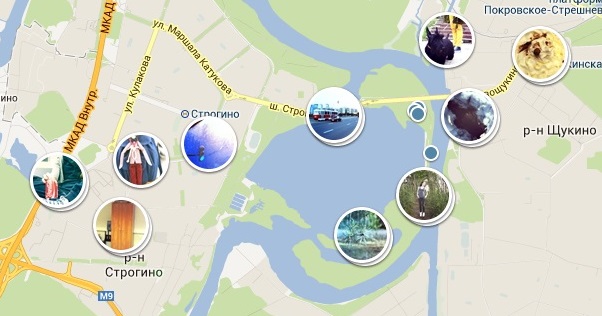
In this article, I decided to describe how the functionality of sampling and displaying photos on a specific part of the map was implemented in our photo service gfranq.com .
Since there were a lot of photos in our service and sending queries to the database every time the viewing window was changed was too resource-intensive, it was logical to split the map into areas where information about already retrieved data would be stored. For obvious reasons, these areas have a rectangular shape (although the option with a hexagonal grid was also considered). Since at large scales the areas become more spherical, the elements of spherical geometry and tools for working with it were also considered.
The following issues were addressed in this article:
- Storing and retrieving photos from the database and placing them in the server cache (SQL, C #, ASP.NET).
- Load the required photos on the client side and put them in the client cache (javascript).
- Recalculate the photos you want to hide or display each time you change the viewport.
- Elements of spherical geometry.
Content
Server part
The following methods of sampling and storage of geo-information in the database were invented:
- Built-in geographic types of SQL Server.
- Normal sample with restrictions.
- Using an extra table.
Further, these methods will be discussed in detail.
Embedded Geotypes
As you know, SQL Server 2008 introduced support for geography and geometry types that allow you to specify geographic (on a sphere) and geometric (on a plane) information, such as points, lines, polygons , etc. . In order to get all the photos enclosed by a rectangle with coordinates ( lngMin latMin ) and ( latMax lngMax ), you can use the following query:
DECLARE @h geography; DECLARE @p geography; SET @rect = geography::STGeomFromText('POLYGON((lngMin latMin, lngMax latMin, lngMax latMax, lngMin latMax, lngMin latMin))', 4326); SELECT TOP @cound id, image75Path, geoTag.Lat as Lat, geoTag.Long as Lng, popularity, width, height FROM Photo WITH (INDEX(IX_Photo_geoTag)) WHERE @rect.STContains(geoTag) = 1 ORDER BY popularity DESC Note that the polygon is counterclockwise and the spatial index IX_Photo_geoTag , which is constructed according to the coordinates (by the way, spatial indexes work on the principle of B-trees ).
However, it turned out that in Microsoft SQL Server 2008 spatial indexes do not work if a column with geotypes can take NULL values, and a composite index cannot contain a column with a geography type, and this question was raised on stackoverflow . Because of this, the performance of such queries (without indexes) becomes very low.
As a solution to this problem, we can suggest the following:
- Since
NULLvalues cannot be used, the default coordinates in this column are (0 0), which indicate a point in the Atlantic Ocean not far from Africa (From there the longitude and latitude begin). However, at this point, as well as nearby, there can be real points, which means that photographs should not be somehow ignored on the map. If we change the point (0 0) to (0 90), then everything will be much better, because latitude 90 indicates actually the edge of the map, which means excluding this latitude when building the grid (ie, build to 89). - Change SQL Server version to 110 using the
ALTER DATABASE database_name SET COMPATIBILITY_LEVEL = 110. This version fixes a bug with indexing NULL geography types, as well as adds support for polygons of different orientations (in the query above, the polygon can be set both against and in a clockwise direction).
Despite the wide possibilities of geographic types (and they allow us to produce not only the simple sample indicated in the example above, but also use distances, various polygons), they were not used in our project.
Normal sample
Selecting photos from the area bounded by the coordinates ( lngMin latMin ) and ( latMax lngMax ) is easy to implement using the following query:
SELECT TOP @Count id, url, ... FROM Photo WHERE latitude > @latMin AND longitude > @lngMin AND latitude < @latMax AND longitude < @lngMax ORDER BY popularity DESC It is worth noting that for the latitude and longitude fields in this case, you can create any indexes (unlike the first option), since they are the usual types of float. However, there are 4 comparisons in this sample.
Using an extra table with hashes
The best solution to the problem of fetching photos from certain areas is to create an additional Zooms table that would hold rows containing area hashes for each zoom, as shown in the figure below.
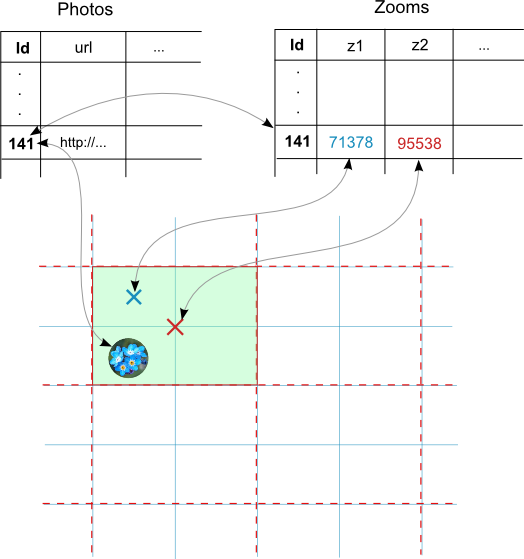
The SQL query thus takes the following form ( zn is the current zoom level):
DECLARE @hash float; SET @hash = (@latMin + 90) + (@lngMin + 180) * 180 + (@latMax + 90) * 64800 + (@lngMax + 180) * 11664000; SELECT TOP @Count id, url, ... FROM Photo WHERE id = (SELECT id FROM Zooms WHERE zn = @hash) The disadvantage of this approach is that the additional table takes up additional space in memory.
Despite the advantage of the latter method, the second version with the usual selection was implemented on the server, since it showed quite good performance.
Caching photos with multi-thread access
After the information has been retrieved from the database in some way, the photos are placed in the server cache as follows using a synchronization object to support multithreading:
private static object SyncObject = new object(); ... List<Photo> photos = (List<Photo>)CachedAreas[hash]; if (photos == null) { // , 1 . lock (SyncObject) { photos = (List<Photo>)CachedAreas[hash]; if (photos == null) { photos = PhotoList.GetAllFromRect(latMin, lngMin, latMax, lngMax, count); // 2 . CachedAreas.Add(hash, photos, null, DateTime.Now.AddSeconds(120), Cache.NoSlidingExpiration, CacheItemPriority.High, null); } } } // CachedAreas[hash] In this section, the server functionality was described for retrieving photos from the database and saving them to the cache. The next section will describe what happens on the client side of the browser.
Client part
For visualization of maps and photos on it was used Google Maps API To begin, the user’s card must be moved to a specific, suitable location corresponding to their geolocation.
Card Initialization
There are two ways to determine a location when initializing a map. The first is to use the features of HTML5, and the second is to use pre-calculated coordinates for all regions.
Locate with HTML5
function detectRegion() { if (navigator.geolocation) { navigator.geolocation.getCurrentPosition(success); } else { map.setZoom(defaultZoom); map.setCenter(defaultPoint); } } function success(position) { ... map.setZoom(defaultZoom); map.setCenter(new google.maps.LatLng(position.coords.latitude, position.coords.longitude)); } The disadvantage of this approach is that not all browsers support this HTML5 function, and the user may not allow access to geo-information on his device.
Positioning using server information
The map is initialized in the next section of the source code, in which bounds are the coordinates of the region (locality, region or country) returned by the server. The definition of the approximate zoom level is calculated using the algorithm provided in the getZoomFromBounds function (borrowed from stackoverflow ).
var northEast = bounds.getNorthEast(); var southWest = bounds.getSouthWest(); var myOptions = { zoom: getZoomFromBounds(northEast, southWest), center: new google.maps.LatLng((northEast.lat() + southWest.lat()) / 2, (northEast.lng() + southWest.lng()) / 2), mapTypeId: google.maps.MapTypeId.ROADMAP, minZoom: 3, maxZoom: 19 } map = new google.maps.Map(document.getElementById("map_canvas"), myOptions); function getZoomFromBounds(ne, sw) { var GLOBE_WIDTH = 256; // a constant in Google's map projection var west = sw.lng(); var east = ne.lng(); var angle = east - west; if (angle < 0) { angle += 360; } return Math.round(Math.log($('#map_canvas').width() * 360 / angle / GLOBE_WIDTH) / Math.LN2); } On the server, the regions are calculated based on the user's IP. For the aggregation of all coordinates of borders for each region, google geocoding api was used , although the use of such information offline is not legitimate, in addition there is a limit to 2500 queries per day. For each city, region and country, a query was formed from our database that returned the desired bounds of viewport and bounds . They differ only for large areas that cannot fully fit into the viewport. Moreover, if the answer was returned with an error, then other requests were used in which the spelling was combined in the native language of the region or English, a part of the {Location}, etc. was removed. http://maps.googleapis.com/maps/api/geocode/xml?address={},{/},{ }&sensor=false
For example, for such a request: http://maps.googleapis.com/maps/api/geocode/xml?address=Russia, Ivanovo% 20region, Ivanovo & sensor = false
... <location> <lat>56.9951313</lat> <lng>40.9796047</lng> </location> <location_type>APPROXIMATE</location_type> <viewport> <southwest> <lat>56.9420231</lat> <lng>40.8765941</lng> </southwest> <northeast> <lat>57.0703221</lat> <lng>41.0876169</lng> </northeast> </viewport> <bounds> <southwest> <lat>56.9420231</lat> <lng>40.8765941</lng> </southwest> <northeast> <lat>57.0703221</lat> <lng>41.0876169</lng> </northeast> </bounds> ... Calculation of partially visible rectangular areas
Calculating the size of caching areas
So, as noted earlier, all photos on both the client and server are cached in rectangular areas, the reference point of which is an arbitrary point (in our case, the point with coordinates (0, 0)), and the size is calculated depending on the current approximation level (zoom) as follows:
// , initMapSizeLat initMapSizeLng var initDefaultDimX = 1000, var initDefaultDimY = 800; // , . var currentDefaultDimX = 1080, var currentDefaultDimY = 500; var initMapSizeLat = 0.0003019; var initMapSizeLng = 0.00067055; // () . var initRatio = 0.75; // // .. initMapSizeLat initMapSizeLng . var initZoomSize = new google.maps.Size( initMapSizeLat / initDefaultDimX * currentDefaultDimX * initRatio, initMapSizeLng / initDefaultDimY * currentDefaultDimY * initRatio); // , ( 2, 1, 2 , - 4). function initZoomSizes() { zoomSizes = []; var coef = 1; for (var i = 21; i >= 0; i--) { zoomSizes[i] = new google.maps.Size(initZoomSize.width * coef, initZoomSize.height * coef); coef *= 2; } } Thus, at each zoom level, the size of a rectangular area over the area is 0.75^2=0.5625 from the current viewing window, if its width = 1080px and height = 500px.
Using Delay on Redrawing
Since redrawing all the photos on the map is not a very fast operation (as will be shown later), it was decided to do it with a certain delay after user input:
google.maps.event.addListener(map, 'bounds_changed', function () { if (boundsChangedInverval != undefined) clearInterval(boundsChangedInverval); var zoom = map.getZoom(); boundsChangedInverval = setTimeout(function () { boundsChanged(); }, prevZoom === zoom ? moveUpdateDelay : zoomUpdateDelay); prevZoom = zoom; }); Calculation of coordinates and hashes of partially visible areas
The calculation of the coordinates and hashes of all the rectangles that overlap the visible window with coordinates ( latMin , lngMin ) and sizes, calculated according to the algorithm described earlier, is performed as follows:

var s = zoomSizes[zoom]; var beginLat = Math.floor((latMin - initPoint.x) / s.width) * s.width + initPoint.x; var beginLng = Math.floor((lngMin - initPoint.y) / s.height) * s.height + initPoint.y; var lat = beginLat; var lng = beginLng; if (lngMax <= beginLng) beginLng = beginLng - 360; while (lat <= maxlat) { lng = beginLng; while (lng <= maxLng) { // lat normalizeLng(lng) . // - , 180 -180. loadIfNeeded(lat, normalizeLng(lng)); lng += s.height; } lat += s.width; } function normalizeLng(lng) { var rtn = lng % 360; if (rtn <= 0) rtn += 360; if (rtn > 180) rtn -= 360; return rtn; } Then for each region, the next function is called, which sends a request to the server if necessary. The hash calculation formula returns a unique value for each region, because the point of reference and dimensions are fixed.
function loadIfNeeded(lat, lng) { var hash = calculateHash(lat, lng, zoom); if (!(hash in items)) { // . } else { // . } } function calculateHash(lat, lng, zoom) { // lat: [-90..90] // lng: [-180..180] return (lat + 90) + ((lng + 180) * 180) + (zoom * 64800); } Redrawing displayed photos
After all photos are loaded or retrieved from the cache, some of them need to be redrawn. With a large accumulation of photos, or rather markers, in one place, some of them should be hidden, but it becomes unclear exactly how many photos are located in this place. To solve this problem, it was decided to support two types of markers: markers that display photographs, and markers that indicate that there are photographs in this place. Also, if all markers are hidden when the borders change, and then re-display them, then flickering will be noticeable. To solve the above problems, the following algorithm was developed:
- Extract all visible photos from client cache to
visMarksarray. The calculation of these areas with photographs has been described above. - Sort received markers by popularity.
- Define overlapping markers using
markerSize,smallMarkerSize,minPhotoDistRatioand thepixelDistancefunction. - Create arrays of large markers with
maxBigVisPhotosCountand small ones withmaxSmlVisPhotosCount. - Identify old markers that need to be hidden and entered into
smlMarksToHideandbigMarksToHideusingrefreshMarkerArrays. - Updating the visibility and depth index of
zIndexfor new markers that need to be displayed usingupdateMarkersVis. - Add photos that have become visible at the current time, to the ribbon above using
addPhotoToRibbon.
function redraw() { isRedrawing = true; var visMarker; var visMarks = []; var visBigMarks2; var visSmlMarks2; var bigMarksToHide = []; var smlMarksToHide = []; var photo; var i, j; var bounds = map.getBounds(); var northEast = bounds.getNorthEast(); var southWest = bounds.getSouthWest(); var latMin = southWest.lat(); var lngMin = southWest.lng(); var latMax = northEast.lat(); var lngMax = northEast.lng(); var ratio = (latMax - latMin) / $("#map_canvas").height(); var zoom = map.getZoom(); visMarks = []; var k = 0; var s = zoomSizes[zoom]; var beginLat = Math.floor((latMin - initPoint.x) / s.width) * s.width + initPoint.x; var beginLng = Math.floor((lngMin - initPoint.y) / s.height) * s.height + initPoint.y; var lat = beginLat; var lng = beginLng; i = 0; if (lngMax <= beginLng) beginLng = beginLng - 360; // . while (lat <= latMax) { lng = beginLng; while (lng <= lngMax) { var hash = calcHash(lat, normLng(lng), zoom); if (!(hash in curItems)) { } else { var item = curItems[hash]; for (photo in item.photos) { if (bounds.contains(item.photos[photo].latLng)) { visMarks[i] = item.photos[photo]; visMarks[i].overlapCount = 0; i++; } } } k++; lng += s.height; } lat += s.width; } // . visMarks.sort(function (a, b) { if (b.priority !== a.priority) { return b.priority - a.priority; } else if (b.popularity !== a.popularity) { return b.popularity - a.popularity; } else { return b.id - a.id; } }); // , . var curInd; var contains; var contains2; var dist; visBigMarks2 = []; visSmlMarks2 = []; for (i = 0; i < visMarks.length; i++) { contains = false; contains2 = false; visMarker = visMarks[i]; for (j = 0; j < visBigMarks2.length; j++) { dist = pixelDistance(visMarker.latLng, visBigMarks2[j].latLng, zoom); if (dist <= markerSize * minPhotoDistRatio) { contains = true; if (contains && contains2) break; } if (dist <= (markerSize + smallMarkerSize) / 2) { contains2 = true; if (contains && contains2) break; } } if (!contains) { if (visBigMarks2.length < maxBigVisPhotosCount) { smlMarksToHide[smlMarksToHide.length] = visMarker; visBigMarks2[visBigMarks2.length] = visMarker; } } else { bigMarksToHide[bigMarksToHide.length] = visMarker; if (!contains2 && visSmlMarks2.length < maxSmlVisPhotosCount) { visSmlMarks2[visSmlMarks2.length] = visMarker; } else { visBigMarks2[j].overlapCount++; } } } // , smlMarksToHide bigMarksToHide . refreshMarkerArrays(visibleSmallMarkers, visSmlMarks2, smlMarksToHide); refreshMarkerArrays(visibleBigMarkers, visBigMarks2, bigMarksToHide); // zIndex. var curZInd = maxBigVisPhotosCount + 1; curZInd = updateMarkersVis(visBigMarks2, bigMarksToHide, true, curZInd); curZInd = 0; curZInd = updateMarkersVis(visSmlMarks2, smlMarksToHide, false, curZInd); visibleBigMarkers = visBigMarks2; visibleSmallMarkers = visSmlMarks2; // . trPhotosOnMap.innerHTML = ''; for (var marker in visBigMarks2) { addPhotoToRibbon(visBigMarks2[marker]); } isRedrawing = false; } function refreshMarkerArrays(oldArr, newArr, toHide) { for (var j = 0; j < oldArr.length; j++) { contains = false; var visMarker = oldArr[j]; for (i = 0; i < newArr.length; i++) { if (newArr[i].id === visMarker.id) { contains = true; break; } } if (!contains) { toHide[toHide.length] = visMarker; } } } function updateMarkersVis(showArr, hideArr, big, curZInd) { var marker; var bounds = map.getBounds(); for (var i = 0; i < showArr.length; i++) { var photo = showArr[i]; if (big) { marker = photo.bigMarker; $('#divOvlpCount' + photo.id).html(photo.overlapCount); } else { marker = photo.smlMarker; } marker.setZIndex(++curZInd); if (marker.getMap() === null) { marker.setMap(map); } } for (i = 0; i < hideArr.length; i++) { marker = big ? hideArr[i].bigMarker : hideArr[i].smlMarker; if (marker.getMap() !== null) { marker.setMap(null); marker.setZIndex(0); if (!bounds.contains(hideArr[i].latLng)) hideArr[i].priority = 0; } } return curZInd; } function addPhotoToRibbon(marker) { var td = createColumn(marker); if (isLatLngValid(marker.latLng)) { trPhotosOnMap.appendChild(td); } else { trPhotosNotOnMap.appendChild(td); if (photoViewMode == 'user') { var img = $("#photo" + marker.id).children()[0]; $('#photo' + marker.id).draggable({ helper: 'clone', appendTo: $('#map_canvas'), stop: function (e) { var mapBoundingRect = document.getElementById("map_canvas").getBoundingClientRect(); var point = new google.maps.Point(e.pageX - mapBoundingRect.left, e.pageY - mapBoundingRect.top); var latLng = overlay.getProjection().fromContainerPixelToLatLng(point); marker.latLng = latLng; marker.priority = ++curPriority; placeMarker(marker); }, containment: 'parent', distance: 5 }); } } } Distance on the map
To get the distance between two points on the map in pixels, use the following function:
var Offset = 268435456; var Radius = 85445659.4471; function pixelDistance(latLng1, latLng2, zoom) { var x1 = lonToX(latLng1.lng()); var y1 = latToY(latLng1.lat()); var x2 = lonToX(latLng2.lng()); var y2 = latToY(latLng2.lat()); return Math.sqrt((x1 - x2) * (x1 - x2) + (y1 - y2) * (y1 - y2)) >> (21 - zoom); } function lonToX(lng) { return Math.round(Offset + Radius * lng * Math.PI / 180); } function latToY(lat) { return Math.round(Offset - Radius * Math.log((1 + Math.sin(lat * Math.PI / 180)) / (1 - Math.sin(lat * Math.PI / 180))) / 2); } This function was also found in the vast stackoverflow.
To style the markers so that they look like circles with photos like VKontakte, the RichMarker plugin was used with the addition of an arbitrary style to the div element.
Conclusion
As it turned out, in order for the photos on the map to be displayed quickly and correctly, it took quite some interesting and non-trivial tasks related to caching and spherical geometry. Despite the fact that not all the methods used were actually used in our project, time was not wasted, since The experience gained may be useful in other projects, and may also be useful for those who have read and understood this article.
')
Source: https://habr.com/ru/post/182532/
All Articles