IT infrastructure health metrics, thresholds and users of IT services
The topic of this article is the determination of threshold values for IT infrastructure health metrics corresponding to the comfortable work of users of IT services. I will look at how to make the thresholds of health metrics (performance, availability, etc.) of the IT infrastructure match what users see as comfortable working with the IT service, and also why all this is needed.
This article is intended for IT service providers, system administrators and anyone who wants to set up monitoring of IT infrastructure and / or performance and availability of IT services, but does not know how to do this.
Introduction
The purpose of any monitoring is to find out about a failure before it affects the work of users, clients, etc. In order for the monitoring system to detect a failure in time and notify the system administrator or the support service about it, you need to:
- Know which metrics need to be monitored.
- Correctly establish threshold values for monitored metrics.
Answers to these questions can be both simple and complex, and depend on what the IT service means to be a failure.
')
Some time ago, HP proposed to classify IT services by level of maturity: IT infrastructure provider, IT services provider, and business partner. We use the proposed classification and consider what is wrong for the first two cases - the IT infrastructure provider and the IT services provider, as well as how in these cases the metrics are determined and the threshold values are set. The third case (business partnership) due to its complexity and globalization will be considered in one of the following articles.
| IT Service Level | What is a crash? |
|---|---|
| IT infrastructure provider | Something is bad in the IT infrastructure |
| IT Service Provider | Users cannot use the IT service to perform their duties. |
| Business partner | Stopped or slows down the business process |
Failure for IT infrastructure provider: Something is bad in IT infrastructure
In the simplest case, a failure is a malfunction in the IT infrastructure. Information about metrics in this case is contained in the MIB (Management Information Base). Thresholds are set in three ways:
- If the metric is measured as a percentage (utilization, availability, etc.), then the method of common sense.
- For most significant metrics there are reference values contained in the recommendations of software and hardware manufacturers. We systematized a significant part of this information and the results can be found on the site http://www.you-expert.ru , section “Examination” .
- If item 1 and item 2 are not possible, then the Baseline Method is used.
Baseline Method
A baseline is a metric or set of metrics that characterize the normal (normal) operation of the IT infrastructure. To build the Baseline, you need to statistically process the measurement results obtained over a long period of time, for example, a month, and get an average value, which is taken as the norm. A value exceeding (in absolute value) the norm, for example, by 10%, 30% or 50% (determined intuitively) is taken as a threshold value corresponding to a “bad” assessment.
There are many ways to calculate and view the Basic Lines. In the simplest monitoring systems, this may be the average value of the metric, displayed as a straight line intersecting the graph of the metric being measured. In professional systems, these are several statistical evaluations (as a rule, percentile) related to time. This means that the values of the Baseline, for example, at 7-00 and 11-00 are two different values. Figures 2 and 3 show examples of Basic Lines automatically computed by ProLAN products. Baseline 20 evaluates metrics at 20-minute intervals and looks like a table. Baseline 60 evaluates metrics at 60-minute intervals and looks like three graphs: average, percentile 75 (25% of the worst values are discarded), percentile of 90 (10% of the worst values are discarded).
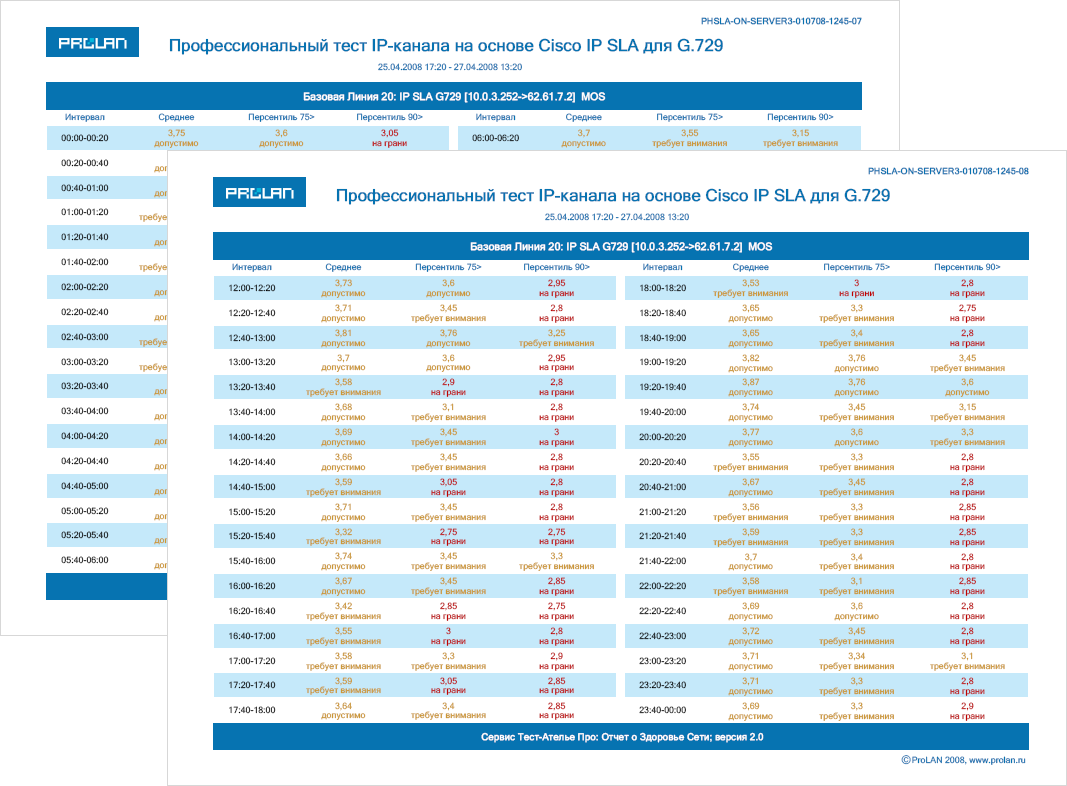
Figure 2. Baseline 20.
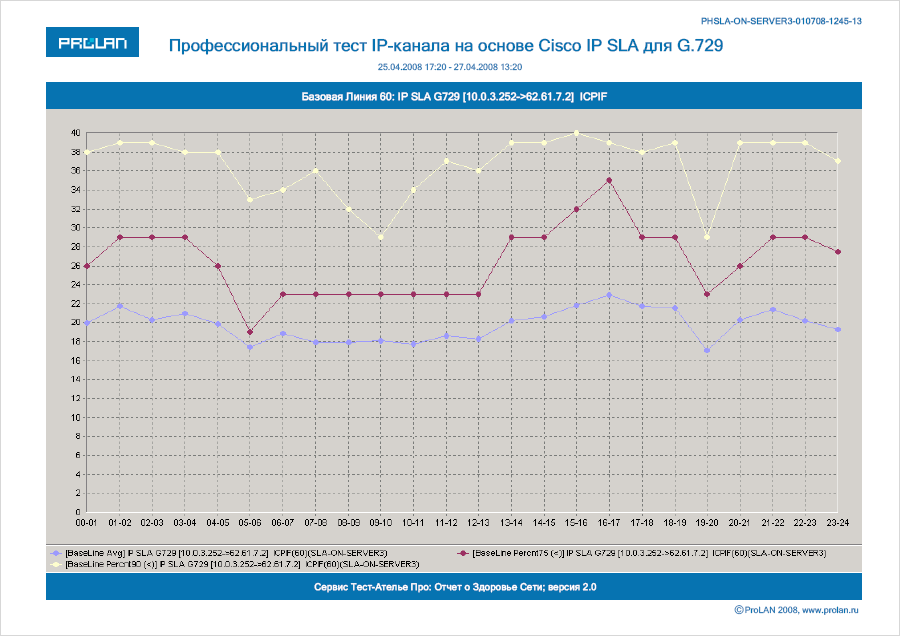
Figure 3. Baseline 60.
Failure for IT service provider: Users cannot use IT service to perform their duties
Compared to a malfunction in the IT infrastructure, this case is more complex and more interesting. Its significance is determined by the fact that the availability of IT services is the main component of the SLA (Service Level Agreement).
Often, in order to simplify your life, IT treats the availability of an IT service as the availability of all involved components of the IT infrastructure. Such a simplification is excusable to a small outsourcer (de facto IT infrastructure provider), but not to a mature IT service provider, since it is objectively wrong. A classic example is ip-telephony. All components of the IT infrastructure that support communication between subscribers can be in good condition and function technically, but the quality of communication is so terrible that it is impossible to use the service (the sound gurgles, the image freezes). Therefore, the availability of an IT service is not a technical metric, and it is not enough to ping equipment to measure it.
It is necessary either to determine at what values of which metrics the service works well, and at what values - not so much, or to measure the response time of business applications (end-to-end response time).
Consider both ways in more detail.
The first way is to measure the end-to-end response time of a business application. In order to measure the response time of business applications, we need special metrics and special measuring tools. You can use GUI robots (we use the AutoIT integrated with the SLA-ON Probe ), network protocol analyzers (for example, Observer Suite from Network Instruments ), software agents installed on the client or server (for example, Level 5 ). Thresholds are set by either the common sense method or the baseline method.
The second way is to establish compliance, when, at what values of which metric the service works well (the user can use it to achieve their goals, perform their duties), and when it is bad (it is impossible to use the service). In this case, not the response time of business applications is controlled, but the technical metrics on which it depends. Monitoring is significantly simplified and cheapened, because instead of poorly scalable GUI robots or expensive analyzers, you can use a regular, even free, monitoring system.
How, in practice, to determine which values of metrics correspond to the comfortable work of users?
Algorithm for determining the pore values corresponding to the comfortable work of users of the IT service
For streaming applications (voice, video), the task of matching the threshold values of technical metrics and user perception (or usability of an IT service) has long been solved. Everyone who works with Cisco equipment (and not only) knows that this equipment allows you to control the subjective MOS (Mean Opinion Score) and ICPIF metrics that are not measured, but calculated (depending on the type of codec) from technical metrics: jitter, delay, packet loss (which are actually measured). For this, the R-Value model is used. Excerpts from the relevant standards and the order of the Ministry of Communications №113 are in the Examinations that support them and other information on the topic can be found at www.you-expert.ru .
But for transactional applications running on top of TCP rather than UDP, there are no such standards. This means that we will have to establish the correspondences between the values of technical metrics and the perception of users. To this end, it is proposed to use the APDEX methodology (see below) and ProLAN solutions.
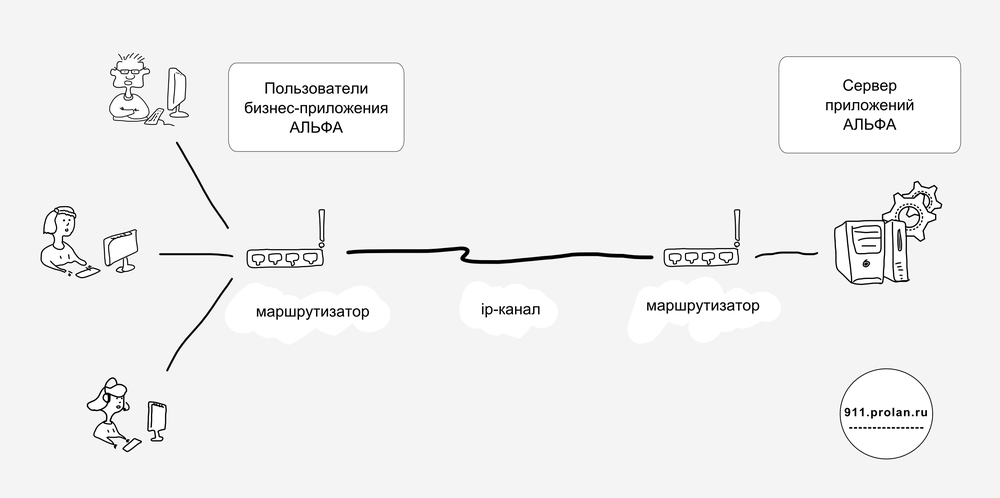
Figure 4. Operation of the ALPHA business application.
Suppose there are two offices separated by a communication channel. At the same time, the ALPHA application server is located in one office, and the users of the ALPHA application are in another, see Figure 4. The name ALPHA is, of course, conditional. Suppose also that we have a ProLAN SLA-ON monitoring system (or some other one) that allows measuring technical health metrics of routers, application server, communication channel, in particular, jitter, delay, packet loss .
And here we are preoccupied with what values of jitter, delay, packet loss we need to register in SLA with the service provider so that users of the ALPHA business application work comfortably. They will also be entered into our monitoring system as thresholds, so that the system administrator or support service, when they are exceeded, can immediately recognize that a failure has occurred (that is, users are unable to perform their duties normally using the provided service - the ALPHA business application) .

Figure 5. Collecting IT health metrics, user information and unsatisfactory ALPHA application
1. To solve this problem, we will install the most appropriate users of the ALPHA Red Button application on computers (USB device, SelfTrace program, EPM-Agent Plus program). SelfTrace will automatically measure when users work with the ALPHA application (they work, that is, they press keys on the keyboard and move the mouse, not just the application openly, but the employee drinks coffee in another department), and transfer the results to the consolidated database See Figure 5.
2. The monitoring system is configured to collect jitter, delay, packet loss metrics, which are also automatically recorded in the consolidated database, and are tied to a common timeline.
3. Users of the ALPHA application are instructed that at the moment when, from their point of view, they cannot comfortably use the ALPHA application to perform their duties, they must press the “red button”. The results of pressing the buttons are also automatically transferred to the consolidated database and are also linked to the overall timeline. Thus, in the consolidated database, the values of jitter, delay, packet loss metrics , time periods of use of the ALPHA application and reports of the unsatisfactory performance of the ALPHA application are tied to one common timeline.
4. We proceed to the actual calculation of threshold values. Run a special application (script) that accesses the consolidated database and calculates the average values of jitter, delay, packet loss metrics:
- at those times when ALPHA users complained about the IT service (they pressed the button);
- at those times when, according to users, everything was fine with the ALPHA.
Note. Partners using commercial ProLAN products can get this script for free.
As a result, for each jitter, delay, packet loss metric , we will have 2 threshold values:
- jitter_satisfied and jitter_frustrated
- delay_satisfied and delay_frustrated
- packet loss_satisfied and packet loss_frustrated
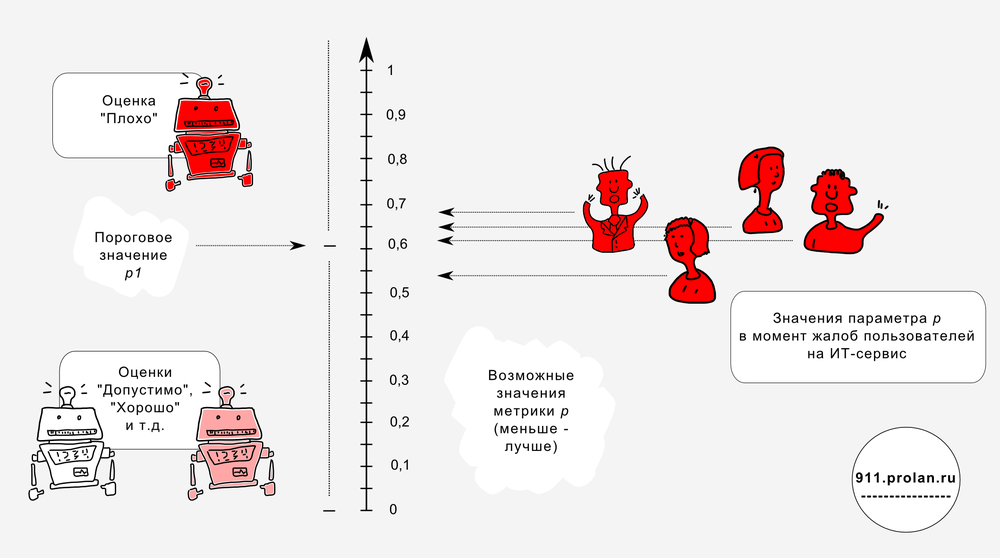
In accordance with the method APDEX metrics with the suffix frustrated is a fourfold threshold value of the corresponding metric. That is, if the value of jitter_frustrated was 200 microseconds, then the threshold value of the jitter metric, corresponding to the comfortable work of ALPHA users, is 50 microseconds.

Figure 6. 2, 7, 11, 12 - jitter values are not taken into account (the user did not work at that time in the ALPHA application). 5, 14 - taken into account to calculate jitter_frustrated. 1, 3, 4, 6, 8, 9, 10, 13, 15 are taken into account to calculate jitter_satisfied.
Problem solved. We received threshold values, the excess of which means a failure from the user's point of view, and therefore the IT service provider (violation of the comfort mode of operation for users of the IT service).
Along the way, another important task is being solved: we determine which metrics are significant in terms of the performance of this service. For example, if it turns out that the values of jitter_satisfied and jitter_frustrated are close, then the jitter metric for comfort with the ALPHA application (for its performance) is not significant. For metrics that characterize the operation of the IP channel, this is not very applicable. But for the health metrics of routers, application servers - this is important.
APDEX technique
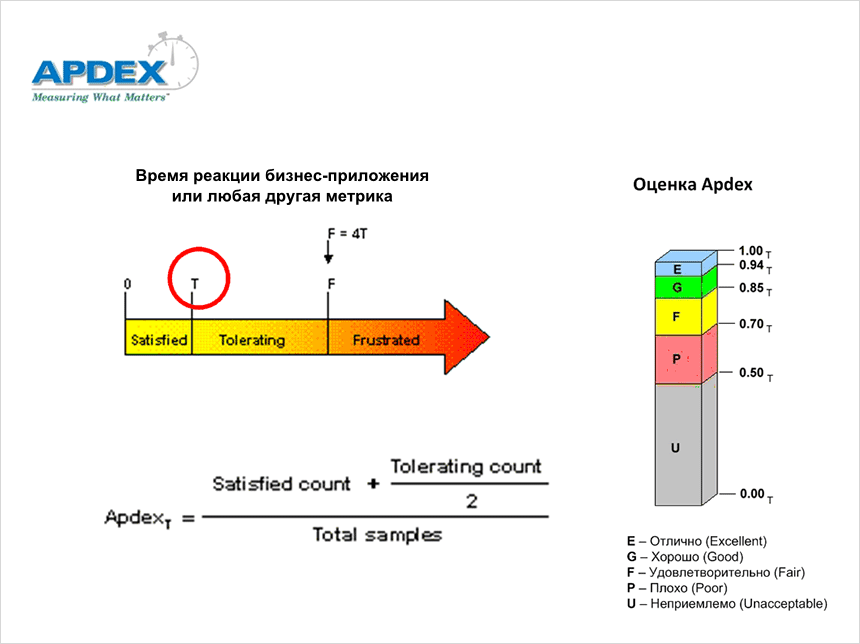
Figure 7. APDEX technique.
In conclusion, a few words about the methodology APDEX.
APDEX (Application Performance Index) is a standard that quantifies user satisfaction with application performance. APDEX technique is as follows. All measurement results (for example, measurement results of the response time of a business application) are divided into three groups.
The first group includes measurements whose values are less than the threshold value T , corresponding to the comfortable work of users. (This is what we need to determine.) The number of such measurements is the value of the variable Satisfied count : users are satisfied.
The second group includes measurements whose values are greater than T , but less than 4 * T. The number of such measurements is the value of the variable Tolerating count : users are not very happy, but are willing to endure.
All other measurements are entered in the third group - Frustrated : users complain. The total number of measurements is the value of the Total samples variable. The APDEX value is calculated using the formula shown in Figure 7.
Post scriptum
Amazing fact. The sales volume of monitoring systems in huge Russia is almost 30 times less than in small Germany. For the number 30 I will not vouch, but the order is exactly like that. For a long time it was not clear to me what it is connected with, until recently I did not have a conversation with the CIO of a very large retailer. I asked what they monitor IT infrastructure. He called one of the products Open Source. I ask: “Well, how, arranges?” “Yes,” he says. - Engineers are happy. Users are just not happy, they periodically complain that everything slows them down, and sometimes letters do not come. And according to our data, everything is working fine. Don't you know what that could be? ”
Source: https://habr.com/ru/post/182504/
All Articles