Statistics salary expectations from HeadHunter
Any topics related to salary, cause a lively interest. My topic “ How to understand how much you are worth, or salary clusters in action! »About how to independently collect statistics on wages, scored almost a hundred comments and received a positive rating from readers.
Today I will tell you how we automated the visualization of such statistics by creating a new service “Salary Expectations Statistics”. It is currently available only to employers, and we will start the service for applicants (with statistics on salary offers) later.

Under the cut the details of the feature and how we developed it.
The question of the size of the salary is one of the most difficult when hiring employees. Underpaid, you can not find a suitable person or find an employee with too low competencies. The other side of the coin - you can overpay, having spent, in fact, extra money, which on an annualized basis, including taxes, will make a considerable amount.
It is possible to establish the very “tasty”, but at the same time adequate salary with the help of statistical information and salary surveys from consulting companies, recruitment agencies and job sites. Unfortunately, most of the existing tools on the market have one serious drawback: they are not focused on a specific job. Roughly speaking, they measure the average temperature in a hospital. Our service lacks this service.
The team approached the task with the understanding that we were sitting on a mountain of information. Still, 10,000,000 resumes are quite a large amount of data for analysis on various sections. We implemented this analysis in real time on the vacancy creation form:

The statistics is based on the expected salaries indicated by applicants in the resume. When the employer, when publishing a vacancy, enters the proposed salary, then to the right of the input field, a chart showing the distribution of applicants by expected salary is shown. It highlights the range of applicants who may potentially be interested in a vacancy with such a salary (applicants who indicated the expected salary, similar to the one offered in the vacancy). When updating data, the graph is rebuilt using unobtrusive animation, which focuses the user's attention at the moment of recalculation on the graph.
We started developing this feature on two fronts at the same time: the designers worked on the appearance, and the developers - on the backend and test visualization of the displayed data.
From the point of view of development, the main risk was the possibility of a lack of data, because quite often we need to count statistics on rare specialties, and even in small towns. As a test, we tried to make visualization for the position “manager in the shoe store”:

There was enough data, but there appeared an understanding that such “fences” are not very suitable for analysis - it is necessary either to do anti-aliasing, or to present the data in the form of a histogram. Our designers, meanwhile, have already made the first sketches of the future interface (we don’t pay attention to the currency - this is just a “fish”):
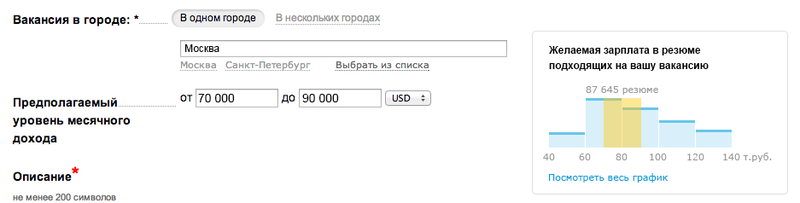
We realized that on the histogram it is very difficult to display a range of salaries so that it is understandable to the user. Therefore, there was another option that turned out to be closer to the final one:
It remains to focus the user's attention on the salary fields and remove information noise:
We did some of the frontend with the Raphaël JS library, which allowed us to support even fairly old browsers (Firefox 3.0+, Safari 3.0+, Chrome 5.0+, Opera 9.5+ and Internet Explorer 6.0+) and avoid problems with the implementation of SVG and VML for Internet Explorer .
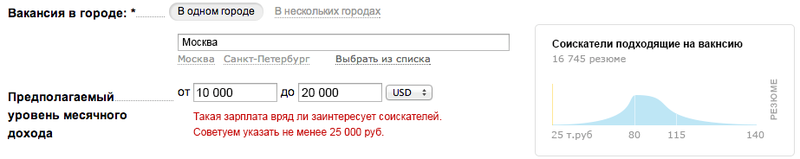
In the process of demos, we realized that it would be nice to give the user a text prompt about the salary range, which he indicated:

These messages allow you to solve the problems that I described at the beginning of the article.
')
At once I want to say that the statistics of salary expectations for employers when creating a vacancy is only the first step towards the standardization of the salary market. We have a lot of ideas where such statistics would be useful (including to applicants), so stay tuned!
PS You can write your constructive suggestions and comments in lichku or b.volfson (dog) hh.ru, to me by e-mail, well, you can troll in the comments :)
Today I will tell you how we automated the visualization of such statistics by creating a new service “Salary Expectations Statistics”. It is currently available only to employers, and we will start the service for applicants (with statistics on salary offers) later.
Under the cut the details of the feature and how we developed it.
What problem we solve
The question of the size of the salary is one of the most difficult when hiring employees. Underpaid, you can not find a suitable person or find an employee with too low competencies. The other side of the coin - you can overpay, having spent, in fact, extra money, which on an annualized basis, including taxes, will make a considerable amount.
It is possible to establish the very “tasty”, but at the same time adequate salary with the help of statistical information and salary surveys from consulting companies, recruitment agencies and job sites. Unfortunately, most of the existing tools on the market have one serious drawback: they are not focused on a specific job. Roughly speaking, they measure the average temperature in a hospital. Our service lacks this service.
The team approached the task with the understanding that we were sitting on a mountain of information. Still, 10,000,000 resumes are quite a large amount of data for analysis on various sections. We implemented this analysis in real time on the vacancy creation form:
The statistics is based on the expected salaries indicated by applicants in the resume. When the employer, when publishing a vacancy, enters the proposed salary, then to the right of the input field, a chart showing the distribution of applicants by expected salary is shown. It highlights the range of applicants who may potentially be interested in a vacancy with such a salary (applicants who indicated the expected salary, similar to the one offered in the vacancy). When updating data, the graph is rebuilt using unobtrusive animation, which focuses the user's attention at the moment of recalculation on the graph.
Process of creation
We started developing this feature on two fronts at the same time: the designers worked on the appearance, and the developers - on the backend and test visualization of the displayed data.
From the point of view of development, the main risk was the possibility of a lack of data, because quite often we need to count statistics on rare specialties, and even in small towns. As a test, we tried to make visualization for the position “manager in the shoe store”:
There was enough data, but there appeared an understanding that such “fences” are not very suitable for analysis - it is necessary either to do anti-aliasing, or to present the data in the form of a histogram. Our designers, meanwhile, have already made the first sketches of the future interface (we don’t pay attention to the currency - this is just a “fish”):
We realized that on the histogram it is very difficult to display a range of salaries so that it is understandable to the user. Therefore, there was another option that turned out to be closer to the final one:
It remains to focus the user's attention on the salary fields and remove information noise:
We did some of the frontend with the Raphaël JS library, which allowed us to support even fairly old browsers (Firefox 3.0+, Safari 3.0+, Chrome 5.0+, Opera 9.5+ and Internet Explorer 6.0+) and avoid problems with the implementation of SVG and VML for Internet Explorer .
We make salary fields even smarter
In the process of demos, we realized that it would be nice to give the user a text prompt about the salary range, which he indicated:
These messages allow you to solve the problems that I described at the beginning of the article.
')
To be done
At once I want to say that the statistics of salary expectations for employers when creating a vacancy is only the first step towards the standardization of the salary market. We have a lot of ideas where such statistics would be useful (including to applicants), so stay tuned!
PS You can write your constructive suggestions and comments in lichku or b.volfson (dog) hh.ru, to me by e-mail, well, you can troll in the comments :)
Source: https://habr.com/ru/post/182324/
All Articles