7 methods of project portfolio analysis
A project portfolio is a collection of projects, programs and sub-portfolios managed to achieve strategic goals. Goals can be different, but they boil down more often to one thing - to earn more. How to understand what to refuse, or what projects are needed? Of course, analysis is needed. Under habrakatom several analytical techniques related to portfolio management. One and a half of the excavator will not be divided into three projects, but the money can be calculated.
In portfolio management, it is customary to choose between two approaches: stage-gate or portfolio-review. In the first case, Go / Kill-decision is made when the project moves from phase to phase. In the second case, the fate of each project is determined by considering the entire portfolio (projects compete with each other). The second case is more typical for companies whose projects are not 2-3, but 20-30.
')
In order to find out if our portfolio is good or bad, we should consider, generally speaking, two economies - with and without a portfolio. An economy without a portfolio of projects, a basic one, is a “bundle” of existing products that are already sold and provide the company with cash. Investment economy is an enterprise economy with a portfolio of projects, each of which:

Thus, there is the following approach: investment economy = basic economy + project portfolio. A basic economy may not be the only one, but have, say, three scenarios (narrowing, preserving, expanding a business), and in one of the approaches to the analysis we will need it. Now more to the point. In total, 7 types of analysis will be considered, each of which answers some questions.
It is not a secret that a business, spending investments, and “turning” operations, generates cash flows.
The effectiveness of this process is easy to demonstrate with a “financial profile” chart that displays cash flows from investments and operations.

Transactions are sales minus the cost of goods produced. Investments are (usually) equipment costs and initial product development. Cumulative DCF in this graph is the accumulated amount of discounted cash flows from portfolio projects .
This schedule is useful. It not only shows NPV , but also shows the portfolio payback period (discounted). That is, he says, taking into account how much our money is worth (and the cost of money is a percentage) - when will we pay for the portfolio, and what contribution does it make to the value of the business?
But this is all trivial for a portfolio of projects. Much more interesting is the relationship between the projects in the portfolio.
Immediately begin with the schedule:
Such a diagram already reflects well the relationship between projects. In this case, for 4 projects, it is difficult to build a cool analytics, but on 10 projects you can already see how the increase in investments affects the profitability (NPV-to-investment ratio) of projects, and what part the project revenue takes in this delta.
The more projects in the upper left corner, the better for the portfolio. Thus, looking at the “investment card”, one can understand that there are no good projects in the current portfolio ... or, on the contrary, that everyone is good. And why.
Common threads are reusable components. These are not only technological components, but also a business process (and customer impressions), and project management, and certainly people and organizations. Why do we need common thread analysis? To repeat the success of some projects in others. How to search for projects for which there can be common threads? For this (there is such a book) it is recommended to draw up the following schedule, where along the X axis is the relative size of projects by costs, and by Y is the number of projects falling within the range. In the same book they say that most often the bimodal distribution is observed:

Why this is so is a whole separate topic for conversation, and I tend to explain it more with the psychology of management. But not the point. The main thing is the peaks in which we can look for common threads. However, no one forbids to search for threads in any other way.
Now a little about the risks. Generally speaking, everyone knows that the factors, or input parameters for portfolio evaluation, may vary within certain limits. There is a visual representation in the form of a so-called. “Tornado charts”, which shows how risky a portfolio is and which factors should be given the most attention.

In this case, we can see what factorshave led us to what kind of wood can “degrease” us. And they should be insured against them, they should be managed, they should be given the most attention.
We have already mentioned that a business can expand, remain, narrow ... in all these cases, projects can behave differently. Those projects that do not grow with the business may be called into question - are they really needed? An example of such an analysis will be on the link below, but its essence boils down to comparing the indicators of projects on each of the business development scenarios. Projects that give a positive contribution in any of the layouts are definitely needed. Such information is very useful.
Here sometimes say zamylennaya word "balanced." In the case of a project portfolio, this is when it meets strategic objectives. All himself and entirely. The level of its balance depends on the set strategic goals. An example of such an analysis will be on the link below, but the problem here is what. Imagine that a strategic goal is more products. Then the portfolios will differ only by product. If more money - just for the money. If strat. the goals themselves are "balanced" with each other, then the portfolio will be possible to pick up.
This is the development of the 90s of Russian economists. If we imagine that each of the projects can completely fail with a certain probability, spending a certain amount, bringing with success another (amount), then it is possible at a given level of risk on the one hand, and on the other - the level of costs - to find the most effective portfolio projects. This seems to be what it should be, right? Although the risk metric is certainly controversial ...

Excel with examples here .
And here there is an example of a report, in which more detail about balance, and about scenario analysis.
The relationship between the tools at first glance and no. However, it all depends on the purpose of your analysis. Ultimately, the pre-set goals will determine which of the tools is the most important for you and which is the least. If you are not faced with the task of choice, then you need to effectively manage your portfolio, and common threads will help you with this. If you have limited money, then the profile and Risk-Efficiency-Cost analysis will help you. If you do not have enough projects - see the investment map, balance projects. If in doubt about the future - see the scenarios.
The result is a strategic decision - the portfolio that, given the constraints given, will give you the best NPV.
PS Please report errors found in lichku. I will promptly rule.
Stage gate is good, but it's not all
In portfolio management, it is customary to choose between two approaches: stage-gate or portfolio-review. In the first case, Go / Kill-decision is made when the project moves from phase to phase. In the second case, the fate of each project is determined by considering the entire portfolio (projects compete with each other). The second case is more typical for companies whose projects are not 2-3, but 20-30.
What tasks are facing analysis
- Understand how much a portfolio will require and how much it will bring
- How risky is the portfolio
- How will projects behave in the event of a change in business?
- Finally, what projects are missing and which ones are superfluous?
')
Bases of analysis
In order to find out if our portfolio is good or bad, we should consider, generally speaking, two economies - with and without a portfolio. An economy without a portfolio of projects, a basic one, is a “bundle” of existing products that are already sold and provide the company with cash. Investment economy is an enterprise economy with a portfolio of projects, each of which:
- Creates and sells product (s)
- Upgrades one or more production facilities (for example, if devices are made, then lean implementation can reduce the amount of materials)
- Creates product (s) while upgrading object (s)
Thus, there is the following approach: investment economy = basic economy + project portfolio. A basic economy may not be the only one, but have, say, three scenarios (narrowing, preserving, expanding a business), and in one of the approaches to the analysis we will need it. Now more to the point. In total, 7 types of analysis will be considered, each of which answers some questions.
1. Financial profile
It is not a secret that a business, spending investments, and “turning” operations, generates cash flows.
The effectiveness of this process is easy to demonstrate with a “financial profile” chart that displays cash flows from investments and operations.
Transactions are sales minus the cost of goods produced. Investments are (usually) equipment costs and initial product development. Cumulative DCF in this graph is the accumulated amount of discounted cash flows from portfolio projects .
This schedule is useful. It not only shows NPV , but also shows the portfolio payback period (discounted). That is, he says, taking into account how much our money is worth (and the cost of money is a percentage) - when will we pay for the portfolio, and what contribution does it make to the value of the business?
But this is all trivial for a portfolio of projects. Much more interesting is the relationship between the projects in the portfolio.
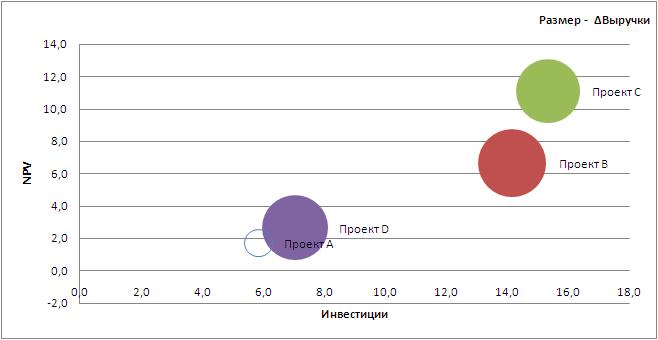
2. Investment map
Immediately begin with the schedule:
Such a diagram already reflects well the relationship between projects. In this case, for 4 projects, it is difficult to build a cool analytics, but on 10 projects you can already see how the increase in investments affects the profitability (NPV-to-investment ratio) of projects, and what part the project revenue takes in this delta.
The more projects in the upper left corner, the better for the portfolio. Thus, looking at the “investment card”, one can understand that there are no good projects in the current portfolio ... or, on the contrary, that everyone is good. And why.
3. Common threads
Common threads are reusable components. These are not only technological components, but also a business process (and customer impressions), and project management, and certainly people and organizations. Why do we need common thread analysis? To repeat the success of some projects in others. How to search for projects for which there can be common threads? For this (there is such a book) it is recommended to draw up the following schedule, where along the X axis is the relative size of projects by costs, and by Y is the number of projects falling within the range. In the same book they say that most often the bimodal distribution is observed:
Why this is so is a whole separate topic for conversation, and I tend to explain it more with the psychology of management. But not the point. The main thing is the peaks in which we can look for common threads. However, no one forbids to search for threads in any other way.
4. Sensitivity analysis
Now a little about the risks. Generally speaking, everyone knows that the factors, or input parameters for portfolio evaluation, may vary within certain limits. There is a visual representation in the form of a so-called. “Tornado charts”, which shows how risky a portfolio is and which factors should be given the most attention.
In this case, we can see what factors
5. Test on business scenarios
We have already mentioned that a business can expand, remain, narrow ... in all these cases, projects can behave differently. Those projects that do not grow with the business may be called into question - are they really needed? An example of such an analysis will be on the link below, but its essence boils down to comparing the indicators of projects on each of the business development scenarios. Projects that give a positive contribution in any of the layouts are definitely needed. Such information is very useful.
6. Portfolio Balance
Here sometimes say zamylennaya word "balanced." In the case of a project portfolio, this is when it meets strategic objectives. All himself and entirely. The level of its balance depends on the set strategic goals. An example of such an analysis will be on the link below, but the problem here is what. Imagine that a strategic goal is more products. Then the portfolios will differ only by product. If more money - just for the money. If strat. the goals themselves are "balanced" with each other, then the portfolio will be possible to pick up.
7. Risk-Efficiency-Cost Analysis
This is the development of the 90s of Russian economists. If we imagine that each of the projects can completely fail with a certain probability, spending a certain amount, bringing with success another (amount), then it is possible at a given level of risk on the one hand, and on the other - the level of costs - to find the most effective portfolio projects. This seems to be what it should be, right? Although the risk metric is certainly controversial ...
Excel is not there?
Excel with examples here .
And here there is an example of a report, in which more detail about balance, and about scenario analysis.
And what is the relationship then?
The relationship between the tools at first glance and no. However, it all depends on the purpose of your analysis. Ultimately, the pre-set goals will determine which of the tools is the most important for you and which is the least. If you are not faced with the task of choice, then you need to effectively manage your portfolio, and common threads will help you with this. If you have limited money, then the profile and Risk-Efficiency-Cost analysis will help you. If you do not have enough projects - see the investment map, balance projects. If in doubt about the future - see the scenarios.
Eventually
The result is a strategic decision - the portfolio that, given the constraints given, will give you the best NPV.
PS Please report errors found in lichku. I will promptly rule.
Source: https://habr.com/ru/post/182276/
All Articles