Visualize “if” in the Visual Studio debugger from BugAid
Following the post Visualization lists in the Visual Studio debugger or a new word from “BugAid For Visual Studio” to clean up the topic, I would like to consider the possibility of extending BugAid to visualize the evaluation of an expression in an if statement.
Suppose there is something like this code:
')
and often in the debugger, the programmer wants to know what kind of error was detected: in other words, which function returned true and which function returned false .
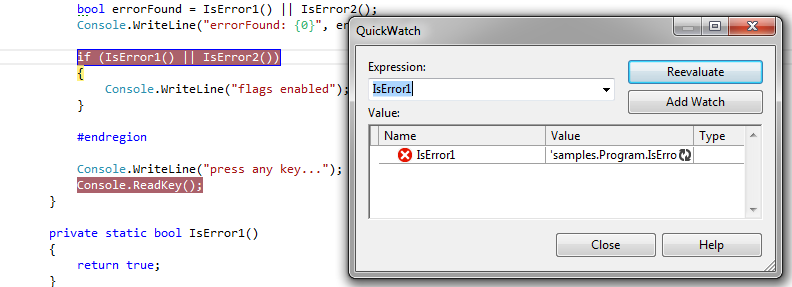
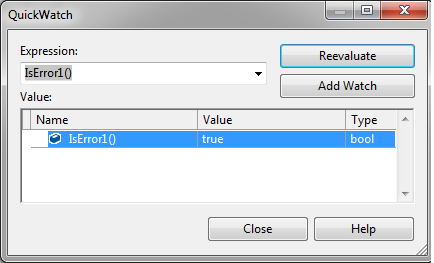
You can of course click on the function call, open QuickWatch and see:
and then finish brackets
Total I counted 6 clicks.
Now the same thing with the help of the extension.
Attention: the extensions should work in " Full mode " mode (enabled through the menu).
only 2 clicks (due to automatic addition of brackets)!
Further, if we pass the line c if with the help of the “Step Over (F10)” command, a bug icon will appear.
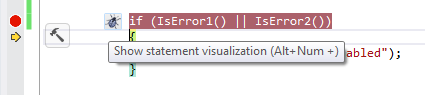
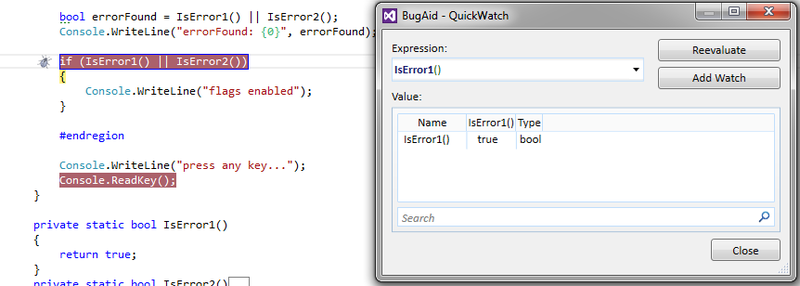
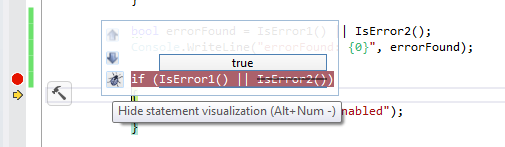
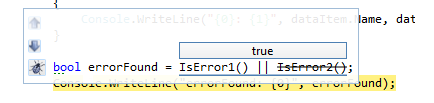
click on the icon and visualize the calculation of the expression:
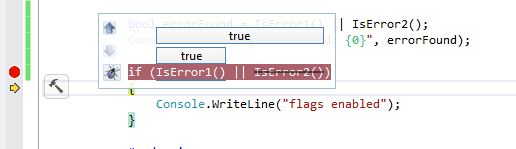
click on the arrow and visualize it in a slightly different form:
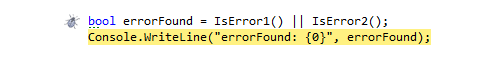
all the same for simple expression evaluation:
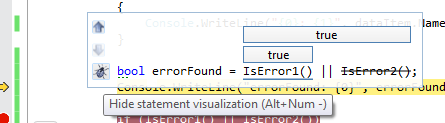
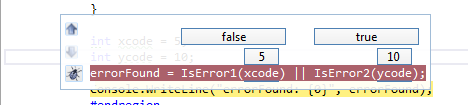
Let's complicate a bit (add parameters to functions):
and so on .
as it turns out that all this is written using the "CLR profiler API" .
thank,
Igor
update :
- expansion paid
- is in the " beta " state
- there is a two month free period of use
Suppose there is something like this code:
if (IsError1() || IsError2()) { // // ... } ')
and often in the debugger, the programmer wants to know what kind of error was detected: in other words, which function returned true and which function returned false .
You can of course click on the function call, open QuickWatch and see:
and then finish brackets
Total I counted 6 clicks.
Now the same thing with the help of the extension.
Attention: the extensions should work in " Full mode " mode (enabled through the menu).
only 2 clicks (due to automatic addition of brackets)!
Further, if we pass the line c if with the help of the “Step Over (F10)” command, a bug icon will appear.
click on the icon and visualize the calculation of the expression:
click on the arrow and visualize it in a slightly different form:
all the same for simple expression evaluation:
Let's complicate a bit (add parameters to functions):
bool errorFound = IsError1(xcode) || IsError2(ycode); and so on .
as it turns out that all this is written using the "CLR profiler API" .
thank,
Igor
update :
- expansion paid
- is in the " beta " state
- there is a two month free period of use
Source: https://habr.com/ru/post/182238/
All Articles