LabVIEW and heart rate variability (+ sources)
Good day to all! I study at a technical college and develop software and hardware for processing and recording biomedical signals and data. Since I started doing this about three years ago, at present, some developments have accumulated, one of which I would like to introduce you to.
One of the most common biomedical signals is electrocardiosignal. It is his treatment involved our faculty. This signal is relatively easy to get. Currently, only two electrodes applied to the human body are enough to see the electrocardiogram. In our work, we used three electrodes according to the standard Einthoven scheme:

The work began with the construction of the hardware of the device. The entire circuit was assembled on a breadboard. The circuit includes the following components: biopotential amplifier AD620, microcontroller - Atmega16, Sigma-Delta ADC AD7739 (8 channels, 24 bits, 16 are actually used). At the beginning of the work, it was possible to see what data ADC issues only through the sound file editor using filtering.
On senior courses, as a student, I studied the program for the controller, where the ADC was initialized, receiving samples and transmitting them to the port. A system of commands, books on microcontrollers, a game with LEDs ... Then gradually, with the leader, they began to set mini-tasks for this device.
Once it was decided to visualize the signal and make its further processing. Since the members of our department have experience in LabVIEW, we decided to also try to use it.
')
Let us proceed directly to the software itself, which was the result of the work. Once I asked an experienced LabVIEW developer how much time he spends writing software, and he replied that you could write a program from two weeks to infinity. And indeed, you always want to fix something in its final version - there is no limit to perfection!
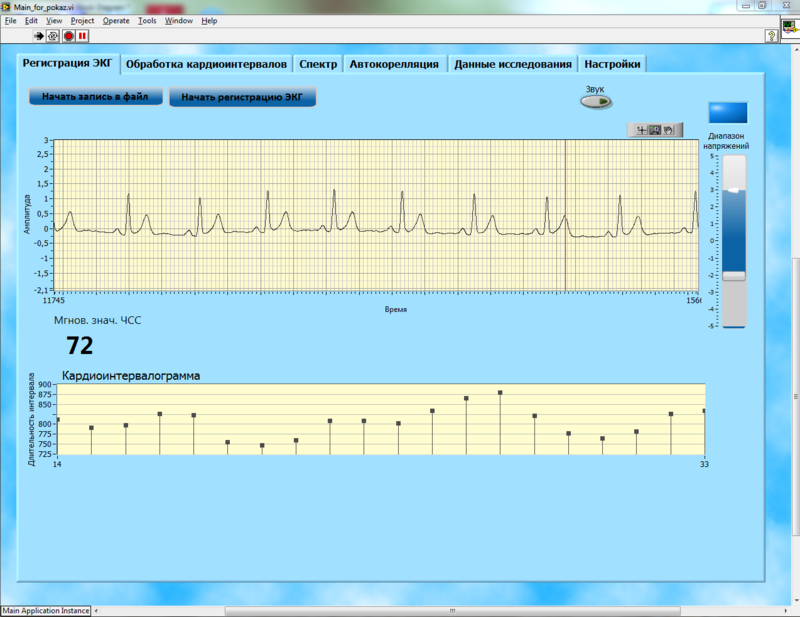
The program for the analysis of heart rate variability includes two main modes: ECG-signal registration and its subsequent analysis. In the first mode, ECG and rhythmograms are recorded and data is recorded in parallel to a file. So it looks on the front panel:
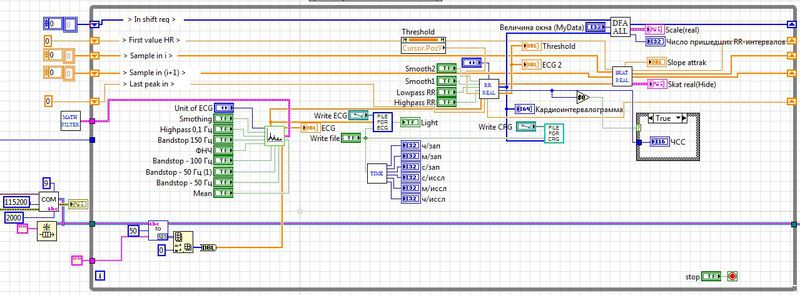
and block diagram:
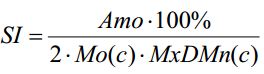
The rhythmogram processing mode is much more complicated than the registration itself. And it includes several components. First, the statistical characteristics of rhythmograms, such as HR, MxDMn, Mn, Mx, SDNN, CV, D, RRcp, RMSSD, PNN50, SI, are calculated. In fact, these parameters are the standard deviation, the variance, max and min, which are often used in statistics. Just some of them are named differently, and some are slightly complicated in the calculation. For example, SI (stress index) is an index of tension of regulatory systems, calculated on the basis of a histogram formed by the method of variation pulsometry. The formula for it is as follows:
where Amo is the amplitude of the histogram mode, Mo is the histogram mode, MxDMn is the difference between the largest and smallest RR intervals.
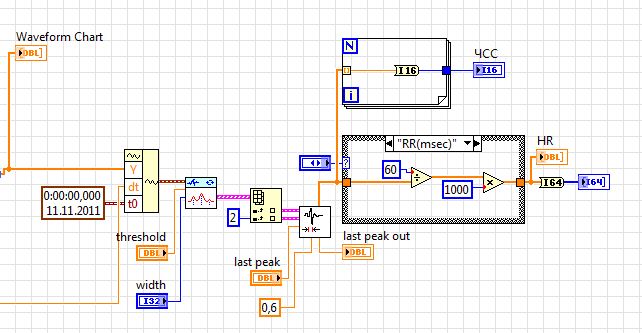
A histogram is a graphic image of grouped values of cardiac intervals, where temporal values are plotted along the abscissa, their number as a percentage along the abscissa [1]. To construct the histogram, the General Histogram function was used. In fact, all these many different parameters are nothing more than statistical processing of the heart rhythm. A heart rhythm or rhythmogram is an array of values of the durations of RR-intervals, i.e. temporal distance between the two largest peaks of the ECG. To determine cardiocycles, one can take not only RR, but also other teeth. This is what a block diagram looks like for isolating a heart rhythm from an ECG.
And this is the front panel of the tab of the analysis of statistical characteristics:
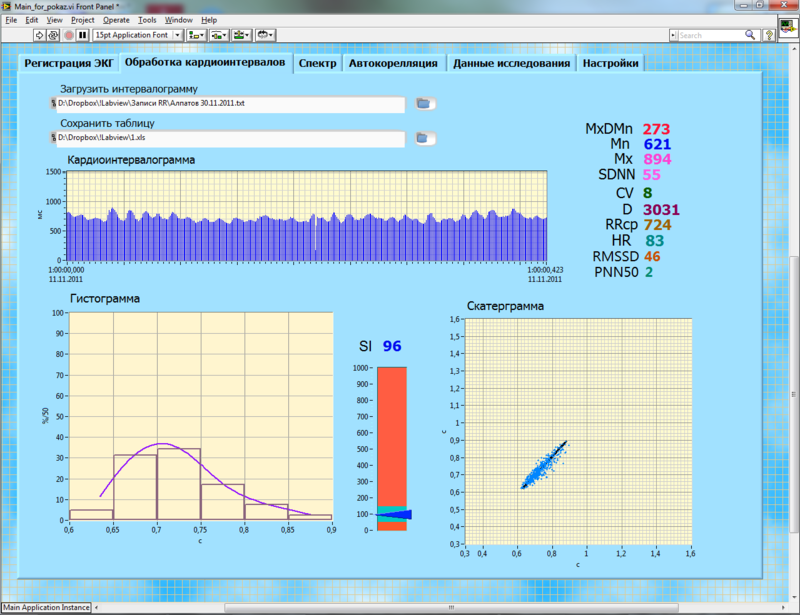
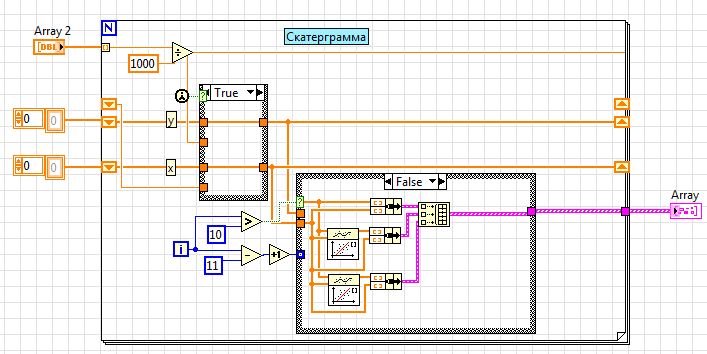
Along with the above characteristics, a scattergram is displayed in the same window, representing the implementation of the correlation rhythmography method. This is a method of graphical representation of the dynamic range of cardiointervals in the form of a “cloud” by building a series of points in a rectangular coordinate system. In this case, each current RR-interval is plotted along the ordinate axis, and each subsequent RR-interval is deposited [2]. The block diagram is as follows:
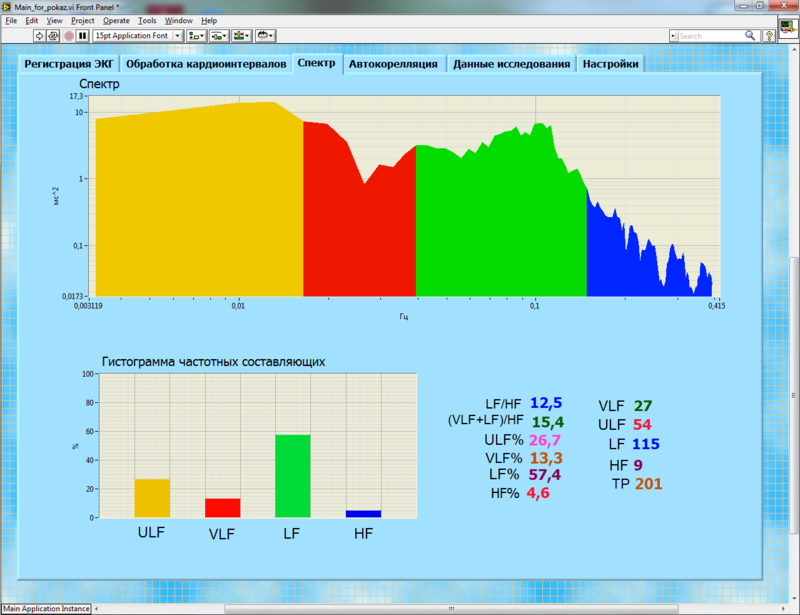
A lot of time was spent on the implementation of the spectral analysis of the heart rhythm. When spectral analysis assesses the contribution of certain periodic components in the dynamics of changes in heart rate. For this purpose, the so-called spectral power of oscillations corresponding to each identified period is estimated. Spectral methods are used almost exclusively to analyze short sections of the rhythmogram - from 2 to 5 minutes [3]. The boundaries of each period in domestic medical practice were recently standardized at one of the largest meetings of specialists in this field. There are specific values for each frequency range. Front panel of spectral analysis:
The autocorrelation function (ACF) graphically represents the statistical relationship of each subsequent RR interval with the previous ones and reflects the degree of centralization of the control of the regulation processes. When creating the ACF, the Correlation Coefficient function from the Probability and Statistics palette was used.

General view of the block diagram for the analysis of rhythmograms:

The pairing of the PC with the hardware is implemented in the VISA library. The maximum port speed was set at 115200. The electrocardiogram spectrum, according to the latest literature data, can reach maximum frequencies in the region of 500 Hz. But we set up digital filters to limit the width of the spectrum from 0 to 100 Hz.
The device is fully functional and performs ECG registration in real time with simultaneous visualization of data, recording the results of the study and patient data to a file.
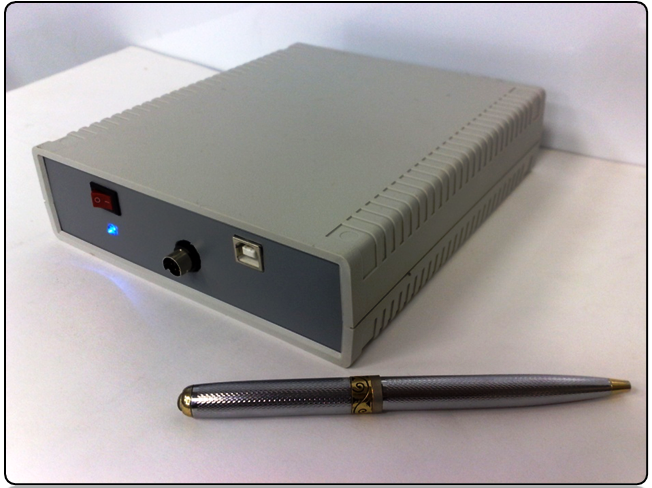
Recently, we have included in the program data analysis using nonlinear techniques . I would also like to note that some components of this treatment serve us to assess the emotional state of the subject. The appearance of the device is as follows:
System video:
Sub-source code
1. The clinical significance of the study of heart rate variability and methods of its evaluation.
2. Dembo A.G., Zemtsovsky E.V. Sports Cardiology: A Guide for Doctors. ─ L .: Medicine, 1989. - 464 p.
3. Belyaev K.R. Methods for analyzing heart variability.
4. Analysis of heart rate variability using different electrocardiographic systems (guidelines)
5. Standards for heart rate variability of the Working Group of the European Heart Society and the North American Society for Stimulation and Electrophysiology
One of the most common biomedical signals is electrocardiosignal. It is his treatment involved our faculty. This signal is relatively easy to get. Currently, only two electrodes applied to the human body are enough to see the electrocardiogram. In our work, we used three electrodes according to the standard Einthoven scheme:
The work began with the construction of the hardware of the device. The entire circuit was assembled on a breadboard. The circuit includes the following components: biopotential amplifier AD620, microcontroller - Atmega16, Sigma-Delta ADC AD7739 (8 channels, 24 bits, 16 are actually used). At the beginning of the work, it was possible to see what data ADC issues only through the sound file editor using filtering.
On senior courses, as a student, I studied the program for the controller, where the ADC was initialized, receiving samples and transmitting them to the port. A system of commands, books on microcontrollers, a game with LEDs ... Then gradually, with the leader, they began to set mini-tasks for this device.
Once it was decided to visualize the signal and make its further processing. Since the members of our department have experience in LabVIEW, we decided to also try to use it.
')
Heart Rate Analysis Software
Let us proceed directly to the software itself, which was the result of the work. Once I asked an experienced LabVIEW developer how much time he spends writing software, and he replied that you could write a program from two weeks to infinity. And indeed, you always want to fix something in its final version - there is no limit to perfection!
The program for the analysis of heart rate variability includes two main modes: ECG-signal registration and its subsequent analysis. In the first mode, ECG and rhythmograms are recorded and data is recorded in parallel to a file. So it looks on the front panel:
and block diagram:
The rhythmogram processing mode is much more complicated than the registration itself. And it includes several components. First, the statistical characteristics of rhythmograms, such as HR, MxDMn, Mn, Mx, SDNN, CV, D, RRcp, RMSSD, PNN50, SI, are calculated. In fact, these parameters are the standard deviation, the variance, max and min, which are often used in statistics. Just some of them are named differently, and some are slightly complicated in the calculation. For example, SI (stress index) is an index of tension of regulatory systems, calculated on the basis of a histogram formed by the method of variation pulsometry. The formula for it is as follows:
where Amo is the amplitude of the histogram mode, Mo is the histogram mode, MxDMn is the difference between the largest and smallest RR intervals.
A histogram is a graphic image of grouped values of cardiac intervals, where temporal values are plotted along the abscissa, their number as a percentage along the abscissa [1]. To construct the histogram, the General Histogram function was used. In fact, all these many different parameters are nothing more than statistical processing of the heart rhythm. A heart rhythm or rhythmogram is an array of values of the durations of RR-intervals, i.e. temporal distance between the two largest peaks of the ECG. To determine cardiocycles, one can take not only RR, but also other teeth. This is what a block diagram looks like for isolating a heart rhythm from an ECG.
And this is the front panel of the tab of the analysis of statistical characteristics:
Along with the above characteristics, a scattergram is displayed in the same window, representing the implementation of the correlation rhythmography method. This is a method of graphical representation of the dynamic range of cardiointervals in the form of a “cloud” by building a series of points in a rectangular coordinate system. In this case, each current RR-interval is plotted along the ordinate axis, and each subsequent RR-interval is deposited [2]. The block diagram is as follows:
A lot of time was spent on the implementation of the spectral analysis of the heart rhythm. When spectral analysis assesses the contribution of certain periodic components in the dynamics of changes in heart rate. For this purpose, the so-called spectral power of oscillations corresponding to each identified period is estimated. Spectral methods are used almost exclusively to analyze short sections of the rhythmogram - from 2 to 5 minutes [3]. The boundaries of each period in domestic medical practice were recently standardized at one of the largest meetings of specialists in this field. There are specific values for each frequency range. Front panel of spectral analysis:
The autocorrelation function (ACF) graphically represents the statistical relationship of each subsequent RR interval with the previous ones and reflects the degree of centralization of the control of the regulation processes. When creating the ACF, the Correlation Coefficient function from the Probability and Statistics palette was used.
General view of the block diagram for the analysis of rhythmograms:
The pairing of the PC with the hardware is implemented in the VISA library. The maximum port speed was set at 115200. The electrocardiogram spectrum, according to the latest literature data, can reach maximum frequencies in the region of 500 Hz. But we set up digital filters to limit the width of the spectrum from 0 to 100 Hz.
The device is fully functional and performs ECG registration in real time with simultaneous visualization of data, recording the results of the study and patient data to a file.
Recently, we have included in the program data analysis using nonlinear techniques . I would also like to note that some components of this treatment serve us to assess the emotional state of the subject. The appearance of the device is as follows:
System video:
Sub-source code
Literature
1. The clinical significance of the study of heart rate variability and methods of its evaluation.
2. Dembo A.G., Zemtsovsky E.V. Sports Cardiology: A Guide for Doctors. ─ L .: Medicine, 1989. - 464 p.
3. Belyaev K.R. Methods for analyzing heart variability.
4. Analysis of heart rate variability using different electrocardiographic systems (guidelines)
5. Standards for heart rate variability of the Working Group of the European Heart Society and the North American Society for Stimulation and Electrophysiology
Source: https://habr.com/ru/post/181834/
All Articles