LibCanvas: On the way to the stars
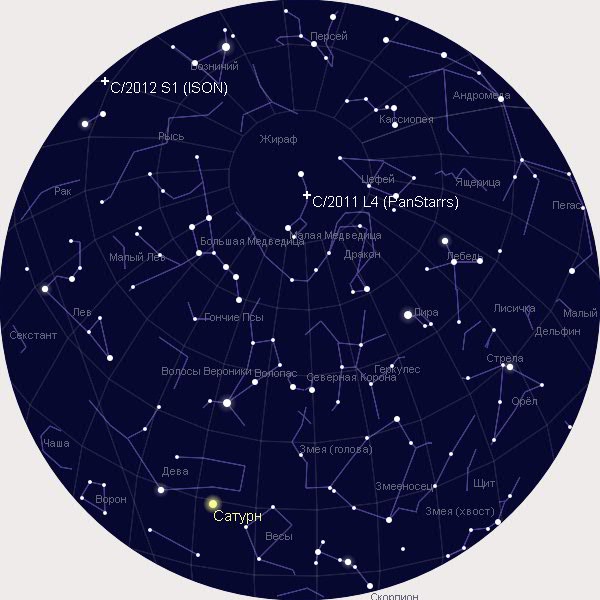
Six months ago, I decided to write an online application "Star Map". I think many of us have ever seen this very map of the starry sky, and it probably attracted our attention.
I thought it would be interesting to do something like this on JS. It was decided to use in part the ready-made library LibCanvas because of its thoughtful syntax, which was important when writing bulk applications.
The first problem I encountered is quite a large number of stars that need to be displayed with high precision - there are about 6,000. Here I decided to generate an array for js from a text file of the stars catalog.
Actually there was a question; Should I always use LibCanvas? The fact is that in the project besides the map itself, a collage of the visible dimensions of the planets should be drawn, which involved writing a separate library and for this task I decided not to use LibCanvas.
')
The project required repeated use of different mathematical functions, so it was decided to write a library of these same functions.
Actually, here is the result .
There respectively:
Object database is mainly located here.
Also here are the elements of the orbits of the planets and comets.
I decided to highlight the planets in yellow (adapt to reality). To calculate the positions of the planets and wrote the library
Here I also had to work a little, and as a result I wrote a couple of functions for displaying a collage.
Also below was a table with the coordinates of the planets.
Code display planets in the head file:
I decided not to suffer, and did not draw the moon along with the phase, because the load is already high.
To display the position of the Moon, I took the ready-made algorithm of Jan Meeus, who found it on the outskirts of the Internet, so I decided to change it a bit and repost to: github
Here I still stand at a crossroads, because it is difficult to say how much this function is needed: as a rule, comets and asteroids are too weak to be observed. Therefore, I made only a section for the brightest comets. Actually the library was written to calculate the position of the comet in a parabolic orbit: github
The main problem is the slowness of the program, especially with fast scrolling. It’s hard to do something here, it’s probably worth cutting back on algorithms, but this is my opinion ... In fact, I rarely use magnification, so I rarely feel this bug.
The program is located here: http://astrokot.ru/planetarium/dev/planetarium.html
I thought it would be interesting to do something like this on JS. It was decided to use in part the ready-made library LibCanvas because of its thoughtful syntax, which was important when writing bulk applications.
The first problem I encountered is quite a large number of stars that need to be displayed with high precision - there are about 6,000. Here I decided to generate an array for js from a text file of the stars catalog.
When to use LibCanvas?
Actually there was a question; Should I always use LibCanvas? The fact is that in the project besides the map itself, a collage of the visible dimensions of the planets should be drawn, which involved writing a separate library and for this task I decided not to use LibCanvas.
')
Library of Mathematical and Astronomical Functions
The project required repeated use of different mathematical functions, so it was decided to write a library of these same functions.
Actually, here is the result .
There respectively:
- Trigonometric functions with a degree argument
- Functions to convert the Julian day to the Gregorian date
- Translation functions of horizontal / equatorial coordinates
- Atmospheric refraction calculation
- Others (names of months, getting current time, etc.)
Data catalogs
Object database is mainly located here.
Also here are the elements of the orbits of the planets and comets.
Star Display
for (var i = 0; i < (stars.length); i++){ var decr=stars[i][1]; // var tr=sr-stars[i][0]; // var zl=atmospheric_refraction(equatorial_to_horizontal(decr, tr, phi)[1]);// var mag=Math.round(stars[i][2]/100); // if (zl<90 && mag<magmax){// , var r_star=k1*1+k2*(magmax-mag); var Az=equatorial_to_horizontal(decr, tr, phi)[0]; // var cor1=to_xy(zl,Az); var x=(cor1[0]*1).toFixed(0); // var y=(cor1[1]*1).toFixed(0); // /* */ if (mag<1.5){ var circl3 = new LC.Circle( x,y,r_star*2); ct.fill(circl3, ct .createRadialGradient( new LC.Circle(x, y, 1), new LC.Circle(x, y, r_star*2)) .addColorStop({ '0.0': 'rgba(200,200,200,0.4)', '1.0': 'rgba(200,200,200,0)' })); var circl = new LC.Circle( x,y,r_star*0.8); // ct.fill(circl, '#FFF');// }else{ /* */ var circl = new LC.Circle( x,y,r_star); // ct.fill(circl, '#FFF');// } m++; } } Planets
Map views
I decided to highlight the planets in yellow (adapt to reality). To calculate the positions of the planets and wrote the library
Collage mappings
Here I also had to work a little, and as a result I wrote a couple of functions for displaying a collage.
Also below was a table with the coordinates of the planets.
Code display planets in the head file:
//============================================================================================================ for (var i = 0; i < (planets.length); i++){ var tyu=planetposition(planets[i][0], planets[i][1], jdn, planets[i][3], planets[i][4], planets[i][5], planets[i][6], planets[i][7], planets[i][8],planets[i][9],planets[i][10]) if (i==0){ sundelta=tyu[1] } if (planetinfo1==1){ // " " res+="<tr><td>"+planets[i][8]+"</td><td>"+deltafloor(tyu[1])+"</td><td>"+alphafloor(tyu[0])+"</td><td>"+(tyu[3]).toFixed(3)+"</td><td>"+(tyu[2]).toFixed(1)+"</td><td>"+(2*tyu[4]).toFixed(1)+"</td></tr>"; } var zl=atmospheric_refraction(equatorial_to_horizontal(tyu[1], sr-15*tyu[0], phi)[1]);// if (i==0){ sunz=zl } //alert(tyu) if (i>0){ draw(ctx, tyu[4], i,tyu[3],planets[i][8], date); } if (zl<90){ var Az=equatorial_to_horizontal(tyu[1], sr-15*tyu[0], phi)[0]; // var cor1=to_xy(zl,Az); var x=(cor1[0]*1).toFixed(0);// var y=(cor1[1]*1).toFixed(0);// var R=Math.round((9-1*tyu[2])*kp2); if (R>10){ R=10 var R1=20*R if (planets[i][8]==''){ // R=7 sunx=x suny=y } }else{ var R1=kp1*R } var circl = new LC.Circle( x,y,R); // var circl2 = new LC.Circle( x,y,R1); // ct.fill(circl, 'rgba('+planets[i][11][0]+','+planets[i][11][1]+','+planets[i][11][2]+',1)'); // // ct.text({ text: planets[i][8], padding: [ 1*y, 1*x], size:15, color:'rgba('+planets[i][11][0]+','+planets[i][11][1]+','+planets[i][11][2]+',1)' }); //alert(planets[i][11][0]) // ----- ct.fill(circl2, ct .createRadialGradient( new LC.Circle(x, y, 1), new LC.Circle(x, y, R1)) .addColorStop({ '0.0': 'rgba('+planets[i][11][0]+','+planets[i][11][1]+','+planets[i][11][2]+',0.85)', '1.0': 'rgba('+planets[i][11][0]+','+planets[i][11][1]+','+planets[i][11][2]+',0)' }));/**/ //---------- } } Moon
I decided not to suffer, and did not draw the moon along with the phase, because the load is already high.
To display the position of the Moon, I took the ready-made algorithm of Jan Meeus, who found it on the outskirts of the Internet, so I decided to change it a bit and repost to: github
Comets and asteroids
Here I still stand at a crossroads, because it is difficult to say how much this function is needed: as a rule, comets and asteroids are too weak to be observed. Therefore, I made only a section for the brightest comets. Actually the library was written to calculate the position of the comet in a parabolic orbit: github
Problems and solutions
The main problem is the slowness of the program, especially with fast scrolling. It’s hard to do something here, it’s probably worth cutting back on algorithms, but this is my opinion ... In fact, I rarely use magnification, so I rarely feel this bug.
The program is located here: http://astrokot.ru/planetarium/dev/planetarium.html
Source: https://habr.com/ru/post/181554/
All Articles