How to make your application fast: profile optimization C ++
Profile optimization is a very interesting way to optimize application code at runtime (in the Visual C development team, this method is called POGO or PGO, from the English Profile Guided Optimization). For the first time, profile optimization was applied in the late 90s by research teams in Visual C and Microsoft. Then it was calculated for the Itanium architecture. Then PGO was incorporated into Visual Studio C / C ++ 2005. Today, this is the main optimization process that significantly improves the performance of Microsoft applications and other developers.
This post will explain how to create faster and more high-performance native applications. First, let's take a closer look at PGO, and then look at an example (NBody simulation), how with a few simple steps you can apply this optimization process in your applications. To work, use the source code from the example . To build a project, you will need DirectX SDK .
Traditional compilers work with optimization based on static source files. They analyze the text of the source file, but do not take into account the data entered by users, which is simply impossible to know from the code. Consider this pseudocode:

When working with the function whichBranchIsTaken, the compiler does not know how often the parameter “a” will be less than the parameter “b”, and how many times the condition “if” will be applied (that is, the compiler cannot predict branching). When working with devirtualization functions and switchCaseExpansion, the compiler does not know enough about the values of * p and i, which makes it impossible to optimize devirtualization and parameter extensions. These problems will appear even brighter if we substitute this code fragment into different modules (for example, different object files), since the traditional compilation functions cannot be optimized for operation within the original modules.
The basic compiler and linker model is not so bad, but it lacks two main possibilities for optimization. Firstly, it does not use information that could be obtained from the analysis of all source files (traditional compilers optimize only individual object files). Secondly, it does not optimize based on the expected or profile response of the application. The first flaw can be fixed with the compiler switch ( / GL ) or the linker switch ( / LTCG ), which performs the full optimization of the program and is necessary for the profile optimization of the application. After optimization of the full program is enabled, you can apply profile optimization. Let us dwell on it in more detail.
PGO is a compiler optimization process in a runtime environment that uses profile data collected during the execution of important or demanding high-performance user scripts in order to optimize the application. Profile optimization has several advantages over traditional static optimization, since it takes into account how the application will behave in a working environment. This allows the optimizer to optimize for speed (for frequent user scenarios) or optimize for size (for rare scenarios). As a result, the code becomes more concise, which ultimately improves application performance.
')

Currently, PGO can only be used on classic desktop applications and is supported on x86 and x64 platforms. PGO is a process consisting of three stages, as shown in the figure above.
PGO users often mistakenly believe that all three phases (instrumentation, training and optimization) should be carried out each time a project is built. In fact, the first two phases can be eliminated when building subsequent versions, and the code can undergo significant changes compared to the version obtained after the application learning phase. In large teams, one developer may be responsible for conducting the PGO and maintaining the training database (.pgd) in the source code repository. Other developers can synchronize their code repositories with this database and use training files to build PGO-optimized versions of applications. After a certain number of recompilations, the application will be finally optimized.
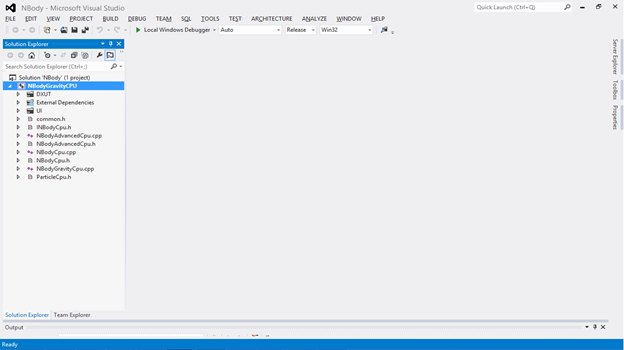
Now, when we know a little more about profile optimization, let's consider its application on a concrete example. Profile optimization of the application can be done using Visual Studio or the developer’s command line. Below is an example of working in Visual Studio with an application under the conditional name "Nbody Simulation". If you want to learn more about PGO on the command line, refer to these articles . To get started, load the solution in Visual Studio and select the build configuration to work with (i.e. “Release”).
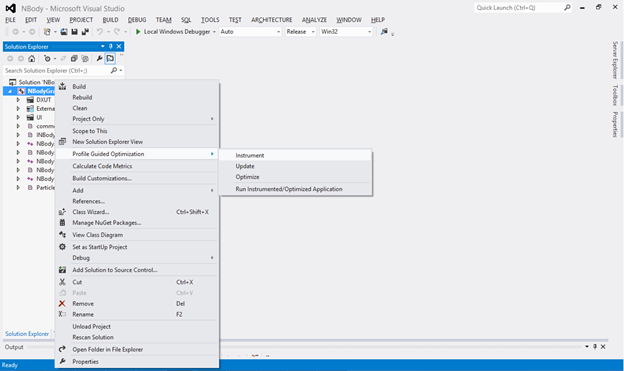
As mentioned above, PGO consists of three stages: instrumentation, training, and optimization. To create an instrumented version of the application, right-click on the project name (“NBodyGravityCPU”) and select the “Instrument” section in the “Profile Guided Optimization” menu.
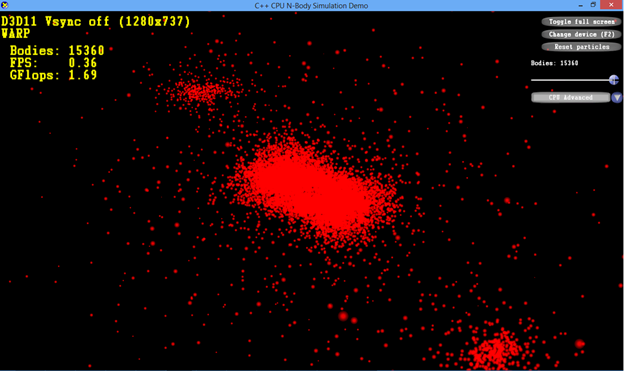
Visual Studio will build an instrumented version of the application. After that, you can proceed to the learning phase. Run the instrumented version of the application. To do this, go to the Profile Guided Optimization menu and select Run Instrumented / Optimized Application. In our case, the application runs with the largest code body (15360), since a stable user script will be implemented that requires high performance. After the two main performance indicators of the application - FPS (frames per second) and GFlop - take stable values, you can close the application. At this point, the learning phase will be completed, and the resulting data will be saved in a .pgc file. By default, the .pgc file will be included in your build configuration, i.e. directory "Release". For example, as a result of this training, an NBodyGravityCPU! 1.pgc file is created.
NBody Simulation is a very simple application created solely to illustrate the PGO process. In fact, there may be many variations of application learning scenarios. In particular, it is possible to conduct training in several stages, separated by time. To record such learning scenarios, it is best to use the pgosweep command in the developer’s command line after the instrumented version has already been created (for example, in Visual Studio).

During the last phase of PGO, an optimized version of the application is created. In the Profile Guided Optimization menu, select Optimize. An optimized version of the application will be created. In the output log of PGO-building you will see a summary of the operation.
As mentioned above, the information from the .pgc files obtained during the learning phase is included in the .pgd database, which is then used by the internal compiler optimization matrix. In most cases (with the exception of small fast applications), the speed / size optimization criterion is determined by the ratio of dynamic instructions for a particular function. Functions with a large number of instructions (so-called "hot") are optimized for speed, and with a small number of instructions (so-called "cold") for size.
This is almost all you need to start profile optimization in your applications. Try PGO for your applications and see the results! And be sure to check out the Developer Tools blog, maybe you will find some interesting solutions there!
The author of the post - Ankit Asthana ( Ankit Asthana ) - Program Manager for the internal compiler Microsoft Visual C + +.
This post will explain how to create faster and more high-performance native applications. First, let's take a closer look at PGO, and then look at an example (NBody simulation), how with a few simple steps you can apply this optimization process in your applications. To work, use the source code from the example . To build a project, you will need DirectX SDK .
How to make a native application faster
Traditional compilers work with optimization based on static source files. They analyze the text of the source file, but do not take into account the data entered by users, which is simply impossible to know from the code. Consider this pseudocode:
When working with the function whichBranchIsTaken, the compiler does not know how often the parameter “a” will be less than the parameter “b”, and how many times the condition “if” will be applied (that is, the compiler cannot predict branching). When working with devirtualization functions and switchCaseExpansion, the compiler does not know enough about the values of * p and i, which makes it impossible to optimize devirtualization and parameter extensions. These problems will appear even brighter if we substitute this code fragment into different modules (for example, different object files), since the traditional compilation functions cannot be optimized for operation within the original modules.
The basic compiler and linker model is not so bad, but it lacks two main possibilities for optimization. Firstly, it does not use information that could be obtained from the analysis of all source files (traditional compilers optimize only individual object files). Secondly, it does not optimize based on the expected or profile response of the application. The first flaw can be fixed with the compiler switch ( / GL ) or the linker switch ( / LTCG ), which performs the full optimization of the program and is necessary for the profile optimization of the application. After optimization of the full program is enabled, you can apply profile optimization. Let us dwell on it in more detail.
PGO is a compiler optimization process in a runtime environment that uses profile data collected during the execution of important or demanding high-performance user scripts in order to optimize the application. Profile optimization has several advantages over traditional static optimization, since it takes into account how the application will behave in a working environment. This allows the optimizer to optimize for speed (for frequent user scenarios) or optimize for size (for rare scenarios). As a result, the code becomes more concise, which ultimately improves application performance.
')
Currently, PGO can only be used on classic desktop applications and is supported on x86 and x64 platforms. PGO is a process consisting of three stages, as shown in the figure above.
- The first stage is usually called the phase of instrumentation . During this phase, an application is assembled with a given set of compilation flags. During the build process, the internal compiler adds test instructions (probes) to the generated code that are used to record the training data needed in the next step. In total, three types of probes are added (function entry, transition, and values). A function entry probe measures how often a function was requested. The transition probe allows you to know how many times a particular branch of code has been reached. Thus, during the learning phase, the compiler receives information about how often “a> b” is in the code fragment whichBranchisTaken in a given learning scenario. Probe values allows you to get data to build a histogram of values. For example, a value probe added to the switchCaseExpansion code snippet will provide data for constructing a histogram of values for the switch case index variable i. Having received information about what values the variable “i” will take during the training, the compiler will be able to optimize for the most frequent values, as well as functions such as switchCaseExpansion. Thus, at the end of the phase, we will have an instrumented version of the application (with probes) and an empty database file (.pgd), into which the information obtained during the next phase will be entered.
- The learning phase . During this phase, the user launches the instrumented version of the application and plays standard user scripts that require high performance. At the output, we have .pgc files containing information related to various user scripts. In the process of learning, information passes through probes added during the first phase. At the output, we get the pgc-files appname! # (Where appname corresponds to the name of the application, and # - one plus the number of pgc-files appname! # In the output build directory).
- The last phase of PGO is optimization . During this phase, an optimized version of the application is created. In addition, the information from the pgc files obtained during the training phase is entered in the background into the database (the .pgd file) created during the instrumentation. The internal compiler then uses this database to further optimize the code and build an even more advanced version of the application.
PGO users often mistakenly believe that all three phases (instrumentation, training and optimization) should be carried out each time a project is built. In fact, the first two phases can be eliminated when building subsequent versions, and the code can undergo significant changes compared to the version obtained after the application learning phase. In large teams, one developer may be responsible for conducting the PGO and maintaining the training database (.pgd) in the source code repository. Other developers can synchronize their code repositories with this database and use training files to build PGO-optimized versions of applications. After a certain number of recompilations, the application will be finally optimized.
Application profile optimization
Now, when we know a little more about profile optimization, let's consider its application on a concrete example. Profile optimization of the application can be done using Visual Studio or the developer’s command line. Below is an example of working in Visual Studio with an application under the conditional name "Nbody Simulation". If you want to learn more about PGO on the command line, refer to these articles . To get started, load the solution in Visual Studio and select the build configuration to work with (i.e. “Release”).
As mentioned above, PGO consists of three stages: instrumentation, training, and optimization. To create an instrumented version of the application, right-click on the project name (“NBodyGravityCPU”) and select the “Instrument” section in the “Profile Guided Optimization” menu.
Visual Studio will build an instrumented version of the application. After that, you can proceed to the learning phase. Run the instrumented version of the application. To do this, go to the Profile Guided Optimization menu and select Run Instrumented / Optimized Application. In our case, the application runs with the largest code body (15360), since a stable user script will be implemented that requires high performance. After the two main performance indicators of the application - FPS (frames per second) and GFlop - take stable values, you can close the application. At this point, the learning phase will be completed, and the resulting data will be saved in a .pgc file. By default, the .pgc file will be included in your build configuration, i.e. directory "Release". For example, as a result of this training, an NBodyGravityCPU! 1.pgc file is created.
NBody Simulation is a very simple application created solely to illustrate the PGO process. In fact, there may be many variations of application learning scenarios. In particular, it is possible to conduct training in several stages, separated by time. To record such learning scenarios, it is best to use the pgosweep command in the developer’s command line after the instrumented version has already been created (for example, in Visual Studio).
During the last phase of PGO, an optimized version of the application is created. In the Profile Guided Optimization menu, select Optimize. An optimized version of the application will be created. In the output log of PGO-building you will see a summary of the operation.
As mentioned above, the information from the .pgc files obtained during the learning phase is included in the .pgd database, which is then used by the internal compiler optimization matrix. In most cases (with the exception of small fast applications), the speed / size optimization criterion is determined by the ratio of dynamic instructions for a particular function. Functions with a large number of instructions (so-called "hot") are optimized for speed, and with a small number of instructions (so-called "cold") for size.
This is almost all you need to start profile optimization in your applications. Try PGO for your applications and see the results! And be sure to check out the Developer Tools blog, maybe you will find some interesting solutions there!
The author of the post - Ankit Asthana ( Ankit Asthana ) - Program Manager for the internal compiler Microsoft Visual C + +.
Source: https://habr.com/ru/post/180777/
All Articles