Monitoring the performance and availability of IT services without GUI robots and RUM
In this article, we will look at how to organize monitoring of the performance and availability of IT services without using GUI robots and Real User Monitoring (RUM) systems.
The solution, which will be described below, is intended for those to whom the products of Real User Monitoring class costing several hundred thousand dollars are too expensive, and the understanding that analysis of calls to the Service Desk and user surveys is not enough has already come.
Problem
Often, “monitoring” the performance and availability of IT services (hereinafter referred to as IT services quality) comes down to analyzing user requests at the Service Desk and / or conducting a survey: evaluate the quality of service from 1 to 5, which problems you encountered (select from the list ) etc. Effectively managing the quality of the provision of IT services is thus very difficult.
Note. According to theory, an incident should be considered any decline in the quality of IT service. However, in practice, users do not register all cases of a decline in the quality of service, but only those that they perceived as critical for carrying out business tasks. In addition, before contacting support, users often try to solve or work around a problem on their own, search for a solution on the Internet, consult with colleagues, etc., and often they succeed. About incidents resolved by the user independently, support is also not known.
')
For a small outsourcer with a small number of customers this may be enough. But the more customers and the more complex the IT service, the harder it becomes to track its quality with just reviews or customer support calls. The information obtained in this way is incomplete, many small problems in the operation of an IT service remain unknown to its supplier.
Methods of monitoring the quality of IT services
More advanced methods for monitoring IT service quality are:
- IT infrastructure monitoring;
- monitoring the response time of a business application (primarily with GUI robots);
- Real User Monitoring (RUM).
We characterize each of them.
The first method is based on the idea that the health of the IT infrastructure correlates with the availability of the service. In general, this is true, but for effective use requires the correct setting of the threshold values of the monitoring system. Setting monitoring system thresholds is generally the main difficulty in using a monitoring system. If the monitoring system is not set up, you can effectively track only the availability of IT infrastructure elements by ping, which, of course, is not identical with the ability to actually use the service. All elements of the infrastructure of IP-telephony can be accessed by ping, and it is impossible to use the connection - the sound gurgles, the image freezes.
Today, GUI robots are most often used to monitor the response time of business applications. GUI robots mimic user behavior in the user interface. This is a fairly effective tool for monitoring the availability of IT services, but with two “buts”. Firstly, GUI robots are a poorly scalable solution, and secondly, they radically simplify user actions. For example, GUI-robot most likely will not be able to emulate a complex transaction.
The second disadvantage is devoid of Real User Monitoring (RUM) - passive monitoring of real user actions. Most often, network traffic analyzers are used for this. This is really a monitoring of all user actions, but there are several hundred thousand dollars worth of products of this class. If you have funds for RUM and you are ready to spend them on it, use RUM. If not, the solution without RUM is described below.
Concept
Today it is the case that the customer service (first of all, receiving and processing requests for incidents and service requests) is handled by the support service, and proactive monitoring is done by the system administrator (system administrators). The system administrator ensures that no incidents occur, and the support service works with incidents that have already occurred, in an effort to restore the quality of service as quickly as possible.
The ultimate goal of both (proactive monitoring and incident management) is to ensure that the quality of the IT service is maintained at a high level and the users are satisfied.
In its work, the system administrator uses (or does not use) the monitoring system. As a rule, the monitoring system monitors the state and health of the IT infrastructure and the performance of business applications. But the monitoring system is arranged (or should be arranged) so that it can track anything — not only the health of the IT infrastructure and the performance of business applications. Just add the appropriate module.
So why not instruct the monitoring system to track user satisfaction?
After all, in the end, IT infrastructure monitoring is needed only insofar as the health of the IT infrastructure is ensured by the provision of IT services to the client. The money is paid by the client, not by computers and routers.
Note. The purpose of monitoring the quality of an IT service from the point of view of a service provider is not to monitor the abstract quality of service as such, but to ensure user satisfaction with the quality of service.
User Satisfaction Monitoring
Users report to the IT service (in fact, the Service Desk) only those cases of dissatisfaction, which seem to them critical for their functionality and at the same time intractable (we will leave brackets out of inadequate personalities and big bosses).
We will do so that users complain about any minor difficulties in the course of working with the IT service. But we cannot accept such appeals — let's call them complaints — support service — there will be a lot of them (if you put the case right), and the support desk will be overwhelmed by them.
Therefore, complaints will not be accepted by the support service, but by the monitoring system.
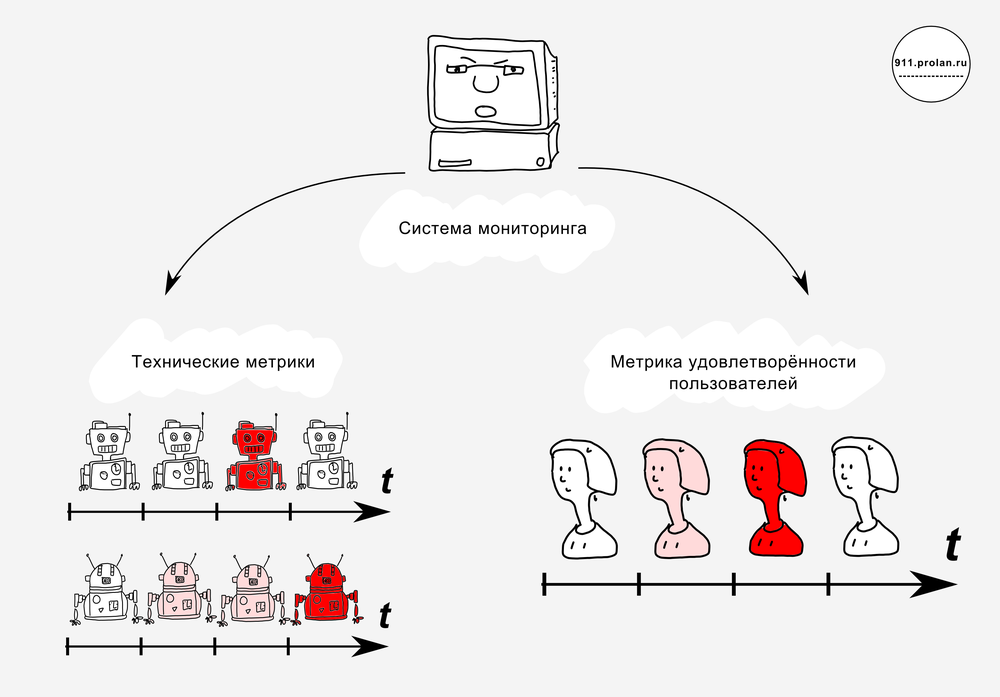
The monitoring system will be:
- track complaints as another metric, along with health metrics of servers, communication channels, etc .;
- evaluate this new metric or metrics on an n-point scale;
- when exceeding the allowed values, inform the support service (creating an entry in the Service Desk-system and informing the service staff, for example, by e-mail).
Through the reporting system it will be possible to conduct a retrospective analysis, identify services that cause particular dissatisfaction, etc.
Decision
Sending a complaint
The user does not like to communicate with the IT service. We minimize the difficulty of sending a complaint: let it be sent fully automatically by pressing a button or a shortcut key.
At the moment of a temporary decline in the quality of service (when the service hangs, but it is known in advance that it will hang up in a couple of minutes), the user, as a rule, has nothing to do. His business operations are interrupted, but he doesn't seem to need any support, because by the time the reaction follows, everything will be working. The user would not mind expressing his indignation and improving the work of the service, but does not know how to do it. He swears loudly at the whole department: “The dog hovered again!” Or he experiences this drama in himself. Let's give him a red button . Now, when the service again blunts, he will first press the button, and then he will swear at the whole department.
The Red Button is the EPM-Agent Plus software agent. It is installed on users' computers or a terminal server. A device is attached to the software agent - a hardware push-button connected via USB. It is on her and the user presses when there are problems with the service. If for some people the button looks old-fashioned, you can get by pressing the key combination - this will be equivalent to pressing the hardware button.

Note. Why do we need a hardware button? Beautiful. If the supplier and recipient of the IT service are different companies, the supplier will immediately understand how to use this beautiful red piece for marketing purposes.
EPM-Agent Plus can do the following. By pressing a button (hardware or key combination), it determines the business application used and the business operation, takes a screenshot of the screen, adds the values of environment variables and user credentials, and sends all this as a HelpMe message to the Information Aggregator (not in Service Desk!) .
Note. Generally speaking, the Red Button is able not only to send complaints, but also to record incidents. Therefore, it has two modes of operation. At the first click of a button, a dialog box is opened that is required to register the incident. Most actions are performed automatically, but the type of incident must be explicitly indicated, and for this you need a dialog box. In the second mode, the window does not open, the program runs fully automatically. This mode is used to send complaints. In order to be able to use the button for two purposes at once, the modes are triggered by different button presses: the first is short, ordinary, the second is long, about two seconds (like turning on the phone).
Aggregation of complaints
The HelpMe message is a SOAP package. HelpMe messages are collected (aggregated) in the Information Aggregator.
The Information Aggregator is a monitoring system of ProLAN SLA-ON. In addition to the monitoring system itself, the Information Aggregator includes:
- expert system
- consolidated database
- reporting tool
The information aggregator receives the complaint (HelpMe message) and writes it to the consolidated database. All complaints are gathered together and there is still something to be done with them - not just the same way we collected them.
Note. Along with the full-featured ProLAN SLA-ON, you can use the free QuTester Plus for some purposes. QuTester Plus is a package that includes both the monitoring system and the Red Button. The functionality, of course, is curtailed, but there are no time limits. Full-featured ProLAN SLA-ON and Red Button, in turn, have a free trial period of 30 days. In general, a one or two order solution is cheaper than Real User Monitoring class products.
User complaint and satisfaction
Each complaint is a signal of user dissatisfaction, and the content of a HelpMe Message allows you to determine which service dissatisfaction refers to, where the user is geographically located, from which department he is, what position he occupies, etc.
We have already learned much more about the attitude of users to our service than if they used only data from the support service and questioning. But how to understand the mass of complaints coming from everywhere?
We group the complaints according to the signs that interest us - for example, like this:
| / | User Directory | |||
|---|---|---|---|---|
| Handbook of operations | / | Tops - Moscow | Sellers - Peter | All - Sochi |
| Work in 1C | Metric 1: Complaints tops from Moscow to work 1C | Metric 4: Complaints from sellers from St. Petersburg to work 1C and SAP CRM | Metric 6: Complaints of all users from Sochi to work 1C and SAP CRM | |
| Work in SAP CRM | Metric 2: Complaints tops from Moscow to work SAP CRM | |||
| the Internet | Metric 3: Complaints tops from Moscow to work online | Metric 5: Complaints from sellers from St. Petersburg and all users from Sochi to work online | ||
Now these groups of complaints are metrics that are monitored by the monitoring system. If a complaint of a user from the Sellers - Peter group arrives at SAP, it will be taken into account by Metric 4, a complaint by a Sochi user on 1C - Metric 6. With the help of user satisfaction metrics, the monitoring system tracks the quality of IT service. Each metric is automatically evaluated on a five-point scale: “good”, “acceptable”, “needs attention”, “on the verge”, “bad”. For example, no more than 2 complaints per day (or per hour, or per minute) from Sochi to SAP work are “good,” more than 2 are “permissible”, more than 3 are “need attention”, etc.
| Quality Assessment (color "indicator") | > / < | Threshold |
|---|---|---|
| Bad (red) | > | 7 |
| On the brink (flashing red) | > | five |
| Requires attention (yellow) | > | 3 |
| Valid (flashing yellow) | > | 2 |
| Good (green) | < | 2 |
“Needs Attention” - The Quality Assessment Threshold for sending an Aggregated Incident Snapshot to the Service Desk.
The dynamics of metrics, which means user satisfaction, can be seen in real time. Green squares - “good”, flashing green - “acceptable”, yellow appeared - “needs attention”.
Reports
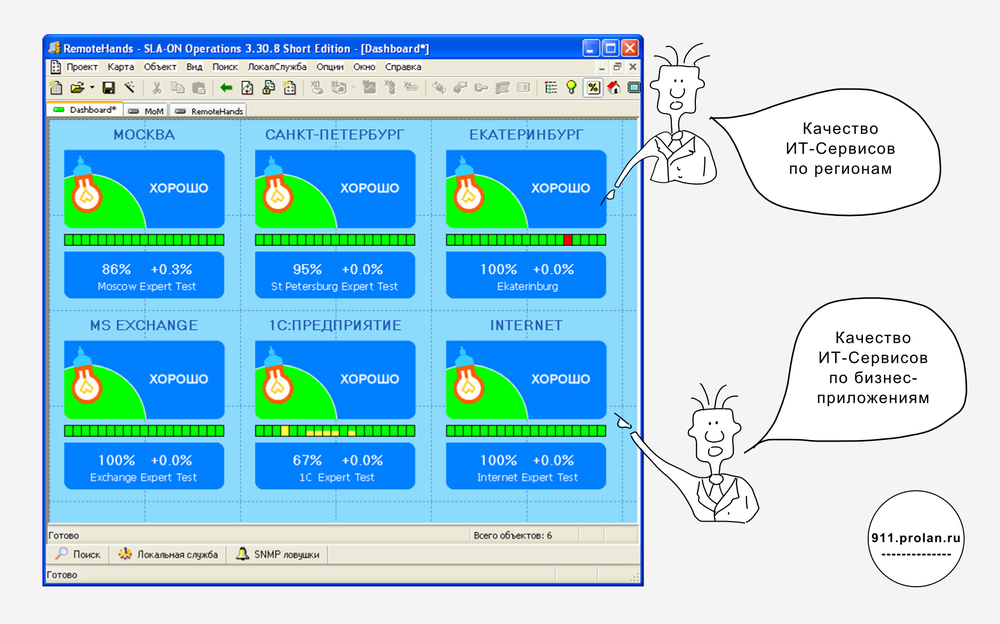
Raw data and expert assessments can be monitored in real time. Expert assessments in the form of colored traffic lights can be mapped onto a geographical map or a business process diagram. Based on raw data and expert assessments, operational and tactical reports can be generated. Operational reports allow you to see user satisfaction with the quality of IT services in various profiles (analysts), for example, at sales offices. Tactical reports allow you to see the change in user satisfaction with the quality of IT service over long time intervals (trends), Base Lines in various sections, etc.
Aggregated Incident Pictures
It is not enough just to estimate the number of complaints received by a particular service from certain users. It is necessary to make so that the staff responsible for maintaining the quality of the IT service can quickly find out about the fall in the quality of service and rectify the situation, even if none of the users registered the incident in the Service Desk.
To do this, as soon as the assessment of a metric falls to the value “requires attention,” the monitoring system automatically generates an Aggregated Incident Snapshot and logs a new incident in the Service Desk. All related complaints are also attached to the Aggregated Incident Image (HelpMe Messages). Having received the Aggregated Incident Snapshot, the help desk works with it as with a normal incident.
Note 1. Integration of the monitoring of the quality of IT services with the monitoring of the health of the IT infrastructure and the performance of business applications simplifies the task of diagnosing the causes of quality decline.
Note 2. The theory allows and even encourages the registration of incidents in the help desk not from users, but from automated event management systems. This refers to a monitoring system that monitors the health of the IT infrastructure, and when violations are detected (for example, the server does not respond or the website is unavailable) it forms an automatic request to the support service. We do the same thing (automatically register the incident with the help of the monitoring system), but if problems are found not in the IT infrastructure, but in user satisfaction.
Scope and limitations
Obviously, asking users to constantly complain about minor problems (even simplifying this task as much as possible) is not a good idea. Why should users do the work of IT Services — if people report problems, but nothing improves, they will stop doing it. Therefore, an appeal to users with a request to press a button should be, firstly, justified, and secondly, be temporary (1-3 months maximum). It is logical to do this, for example, in the following cases:
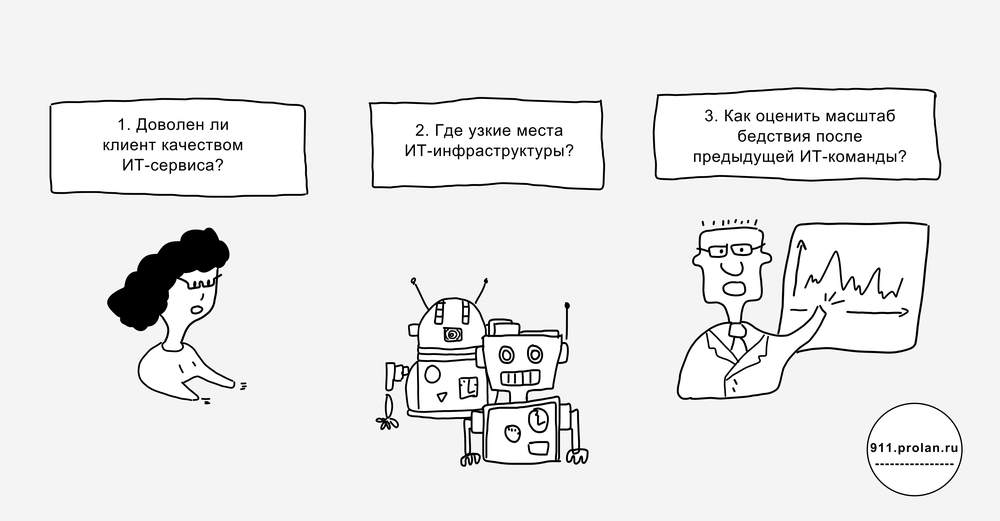
- Conduct an audit of the quality of IT services (annual maintenance). And if there were problems that we do not know about; "We ask you to evaluate the quality of the service received," etc.
- Upon completion of the introduction of new services. Systematization of complaints will allow to localize the flaws in business applications and / or problems in the IT Infrastructure. "A new business application is being introduced, we ask you to help us evaluate the quality of the work of contractors."
- When changing the CIO or IT team. To assess the magnitude of a disaster in numbers.
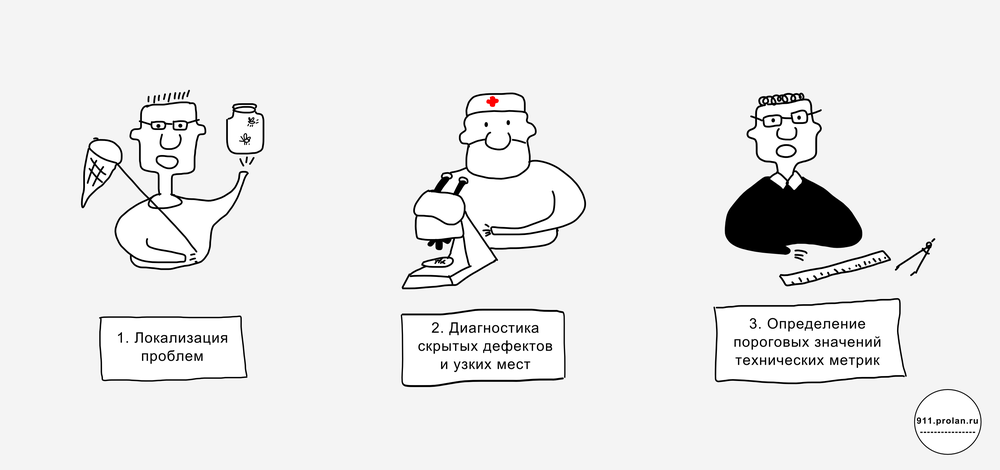
Basic goals:
- Localization of problems, which allows for more efficient use of more accurate diagnostic tools, such as the network protocol analyzer.
- Diagnose hidden defects and bottlenecks (of which IT does not know). To eliminate them and users no longer complained.
- Determination of threshold values of technical metrics (utilization, number of errors, delays), corresponding to the comfortable work of users. To monitor the performance and availability of IT Services using existing IT Infrastructure monitoring systems and without involving users. This is a very important topic that we will try to cover in a separate article.
findings

- By the "monitoring" through the support service and the survey take place:
- Cases of deterioration in service quality, ignored by the user;
- Cases of deterioration in the quality of service, resolved by the user independently;
- All other cases where the user did not want to fill out a questionnaire about the quality of the service and did not turn to support.
- Concept
- Monitoring the quality of IT services for an IT service provider is monitoring user satisfaction with the quality of IT services.
- To see more, you need to motivate users to complain about minor disruptions in the operation of IT services.
- Decision
- Users send complaints by pressing the button ( Red Button ).
- Complaints are not received by people (support service), but by an IT system (ProLAN SLA-ON monitoring system).
- People work not with individual complaints, but with reports and Aggregated Incidents.
- Scope and limitations
- The purpose of any monitoring is to find out about the problem before it affects the users' work. Therefore, monitoring with user complaints should not be used as a permanent solution.
- The goals of monitoring with the help of user complaints are localization of problems, diagnostics of hidden defects and bottlenecks, determination of compliance of technical metrics with the users' comfortable work.
- The use of monitoring with the help of users' complaints - an audit of the quality of IT services, the introduction of new services, a change in the CIO or IT team.
Source: https://habr.com/ru/post/180431/
All Articles