Frequency of mailings sent: often not always better!
Recently, I often hear opinions that “ The volume of sending letters is the key to success in email marketing!”. In essence, they mean that sending additional email leads to more active subscribers, making more money, and, in general, better (regardless of what “better” means for you).
Their arguments are simple:
After all, if you have an address database of 10,000 addresses and each time you send an email to them, you will receive 100 orders, then by sending an email to these addresses twice a month, and not one, you expect to receive 100 orders more , right? Money in your pocket! Why not go for it?
Of course, the reasoning is correct. But not everything is so simple.
')
Maybe you can increase the frequency of your mailings for sales growth, but maybe you can not. And here's why: Subscriber activity (opening, clicks) depends on the frequency of sending newsletters . The more you send, the fewer subscribers open your newsletters and click on links in them. So there must be an equilibrium point at which a certain frequency of distribution maximizes the activity of the subscriber (and, consequently, your sales).
Ok, the first thing we have to show is that frequency and activity negatively correlate , i.e. the more often you send a newsletter, the fewer subscribers are active with each subsequent campaign. For this study, I used the rate of clicks in the mailings instead of the level of discoveries, because This is a more honest indicator and it is more closely related to sales for online stores.
Mailchimp has many users and we can study the effect of the frequency of sending on the activity of subscribers, but for some users the frequency of sending does not change. They, like a clockwork, send mailings with the same frequency, so their data is useless in this study. Also, it would be wrong to combine data from different users, because They send newsletters to various databases with different subscribers, who have different expectations about the various content of mailings. We want to avoid such differences.
Therefore, in the end, I formed the procedure that I used in my research:
Still reading?
The result of the study was striking: in each case in which we obtained statistically significant results, a negative slope of the regression line was noted. In other words, for all users who have a good mailing history, the rule applies: the more often we send mailings, the less clicks we get in each of them .
For example, here are the results for two users, X and Y:
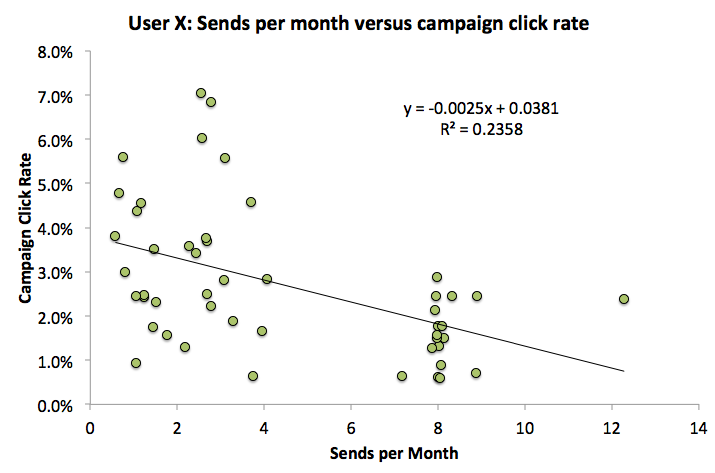
We send more, we get less activity.
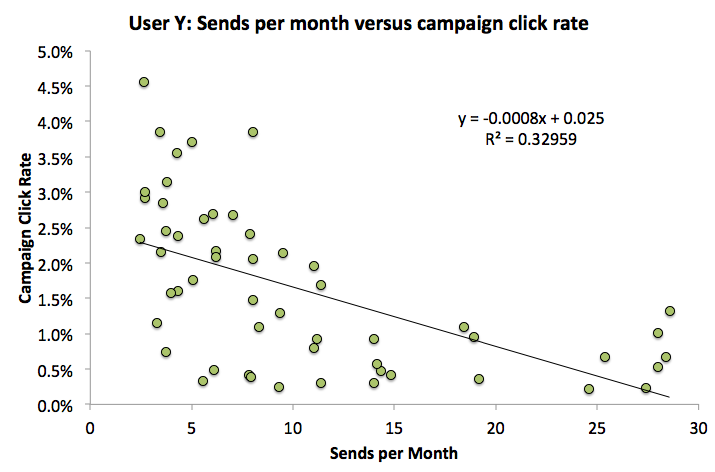
Another example of a decrease in activity in the mailing list.
[From translator]
Here in the original article there is an example of Obama's email marketing campaign , which is used by supporters of sending as many emails as possible. But, as rightly noted, if you need to maximize the result to a specific point (in this case, it is an election), then everything is OK, but for periodic emails without a specific end date, this is absolutely unacceptable. And that's why.
[/ From translator]
In light of the negative correlation data between the frequency of sending and the activity of subscribers, we can find out how many times a month a customer must send his newsletter using the technology that hotels, airlines, car rentals and others use in their pricing inventory.
The graphs above for users X and Y are very similar to the demand curves in the economy, where demand falls and the price rises. Therefore, we can introduce such a thing as “ elasticity of activity versus frequency ”. Consider user Y data as an example. For a separate newsletter, we have:
Therefore, ceteris paribus, the total number of clicks I plan to receive per month, based on my frequency of distribution, can be modeled as:
We need to maximize the number of clicks per month. This function is convex up and quadratic . This means that by taking the first derivative and equating it to 0, we can get the optimal distribution frequency.
we get:
In the general case, the optimal frequency of sending can be calculated from the curve of the dependence of the activity of subscribers on the frequency of sending a mailing.
as:
For everyone who is scared by the math, we'll just formulate the idea. Smoothly increase the frequency of sending mailings, looking at the indicator of the total number of clicks collected per month from all mailings. As soon as you skip the optimal value of the frequency of mailings, this indicator will begin to decrease and each next “extra” list of monthly will decrease it more and more. Just roll back one value (frequency of mailings per month) back and stop at this maximum - this will be the perfect balance you are looking for.
Please note that the above calculations of the optimal sending frequency, there is one parameter that is mysteriously thrown away: the size of the address base. Thus, all the statements “You can spam more people if the size of your address base is large” are absolutely irrelevant. No matter how big your address base is, there is a more subtle way to send mailing than clumsy “swotting”.
In the case of user Y, it turned out that the optimal dispatch method would be sending every other day. As part of the study, there were cases when the user sent every day, but the elasticity curve of the level of discoveries on the frequency of sending recommended to soften the rate of sending, basing on the nature of their reading activity.
In our conclusions, the optimal frequency of sending mailings depends on the user. Its dependence is based on your audience and its expectations on the content of your newsletters. Therefore, do not pay attention to any calls to send more and more, and try to find a middle ground that you feel will be balanced between the individual activity of subscribers in each individual mailing and the total activity of subscribers throughout the period for all mailings.
============================
The article material from the Mailchimp.com blog has been translated and prepared by Pechkin-mail.ru email marketing staff .
Their arguments are simple:
- My data shows that the more I receive / open / click on my newsletter, the more money I earn.
- Since I cannot magically “conjure up” new email addresses, so I have to send mailings to those who already have it more often.
After all, if you have an address database of 10,000 addresses and each time you send an email to them, you will receive 100 orders, then by sending an email to these addresses twice a month, and not one, you expect to receive 100 orders more , right? Money in your pocket! Why not go for it?
Of course, the reasoning is correct. But not everything is so simple.
')
Maybe you can increase the frequency of your mailings for sales growth, but maybe you can not. And here's why: Subscriber activity (opening, clicks) depends on the frequency of sending newsletters . The more you send, the fewer subscribers open your newsletters and click on links in them. So there must be an equilibrium point at which a certain frequency of distribution maximizes the activity of the subscriber (and, consequently, your sales).
The frequency of mailings and the activity of subscribers negatively correlate
Ok, the first thing we have to show is that frequency and activity negatively correlate , i.e. the more often you send a newsletter, the fewer subscribers are active with each subsequent campaign. For this study, I used the rate of clicks in the mailings instead of the level of discoveries, because This is a more honest indicator and it is more closely related to sales for online stores.
Mailchimp has many users and we can study the effect of the frequency of sending on the activity of subscribers, but for some users the frequency of sending does not change. They, like a clockwork, send mailings with the same frequency, so their data is useless in this study. Also, it would be wrong to combine data from different users, because They send newsletters to various databases with different subscribers, who have different expectations about the various content of mailings. We want to avoid such differences.
Therefore, in the end, I formed the procedure that I used in my research:
- We will extend all users in the last 2 years who sent often (from two times a month) to at least one thousand subscribers. Get the data on the level of clicks in each of their mailings.
- Calculate the frequency of sending for the user on each of these mailings. Instead of the exact frequency, I used a simple moving average for every 3 shipments to smooth out the “perceived” sending frequency (how subscribers perceive it, since for them the moment of receipt is the moment of detection of the letter in the mailbox) which, I suppose, lags a little behind reality.
- We eliminate all deviations in the data by applying Tukey's fence for each user for a couple of sending frequency - the level of clicks. For example, email-sending to “Black Friday” can show the release of click-level value, regardless of anything, so this list should be excluded from the analysis.
- We study data from those users who have significant differences in the frequency of shipments for their history (I used the following criterion: the interquartile range should be no less than the average frequency).
- For each such user, we take a linear regression of the level of clicks on frequency. We study the regression with any statistically significant link in the data ( R-squared > 0.2, F-test p value <0.05).
Still reading?
The result of the study was striking: in each case in which we obtained statistically significant results, a negative slope of the regression line was noted. In other words, for all users who have a good mailing history, the rule applies: the more often we send mailings, the less clicks we get in each of them .
For example, here are the results for two users, X and Y:
We send more, we get less activity.
Another example of a decrease in activity in the mailing list.
[From translator]
Here in the original article there is an example of Obama's email marketing campaign , which is used by supporters of sending as many emails as possible. But, as rightly noted, if you need to maximize the result to a specific point (in this case, it is an election), then everything is OK, but for periodic emails without a specific end date, this is absolutely unacceptable. And that's why.
[/ From translator]
The cumulative activity of mailings over a long period of time is a convex quadratic function, not an incremental line.
In light of the negative correlation data between the frequency of sending and the activity of subscribers, we can find out how many times a month a customer must send his newsletter using the technology that hotels, airlines, car rentals and others use in their pricing inventory.
The graphs above for users X and Y are very similar to the demand curves in the economy, where demand falls and the price rises. Therefore, we can introduce such a thing as “ elasticity of activity versus frequency ”. Consider user Y data as an example. For a separate newsletter, we have:
= -0.08% * + 2.5%Therefore, ceteris paribus, the total number of clicks I plan to receive per month, based on my frequency of distribution, can be modeled as:
= * * (-0.8%* +2.5%)We need to maximize the number of clicks per month. This function is convex up and quadratic . This means that by taking the first derivative and equating it to 0, we can get the optimal distribution frequency.
2 * * -0.8% * + *2.5% = 0we get:
= -2.5%/(2*-0.8%) = 15In the general case, the optimal frequency of sending can be calculated from the curve of the dependence of the activity of subscribers on the frequency of sending a mailing.
Y = A*X + Bas:
-B/2*AFor everyone who is scared by the math, we'll just formulate the idea. Smoothly increase the frequency of sending mailings, looking at the indicator of the total number of clicks collected per month from all mailings. As soon as you skip the optimal value of the frequency of mailings, this indicator will begin to decrease and each next “extra” list of monthly will decrease it more and more. Just roll back one value (frequency of mailings per month) back and stop at this maximum - this will be the perfect balance you are looking for.
findings
Please note that the above calculations of the optimal sending frequency, there is one parameter that is mysteriously thrown away: the size of the address base. Thus, all the statements “You can spam more people if the size of your address base is large” are absolutely irrelevant. No matter how big your address base is, there is a more subtle way to send mailing than clumsy “swotting”.
In the case of user Y, it turned out that the optimal dispatch method would be sending every other day. As part of the study, there were cases when the user sent every day, but the elasticity curve of the level of discoveries on the frequency of sending recommended to soften the rate of sending, basing on the nature of their reading activity.
In our conclusions, the optimal frequency of sending mailings depends on the user. Its dependence is based on your audience and its expectations on the content of your newsletters. Therefore, do not pay attention to any calls to send more and more, and try to find a middle ground that you feel will be balanced between the individual activity of subscribers in each individual mailing and the total activity of subscribers throughout the period for all mailings.
============================
The article material from the Mailchimp.com blog has been translated and prepared by Pechkin-mail.ru email marketing staff .
Source: https://habr.com/ru/post/180177/
All Articles