Utility for quick forecasting
I met some time ago with the Google Charts API and decided, why not “tie” this interface to the previously developed forecasting application (doc, 62 kb) .
It turned out a mini-utility for the rapid construction of quantitative forecasts with the ability to visualize: FastCast .
Using this utility you can, for example:
There are many applications for this Internet utility, it would be a desire. ;-)
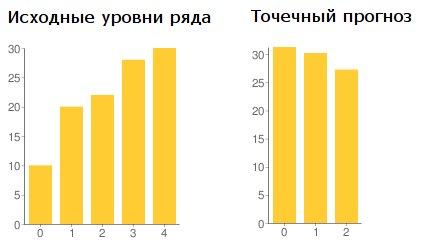
This utility uses two prediction models:
These methods are not a panacea - you need to apply them wisely. This utility is useful if you need to very quickly build a forecast.
The Internet system, on the basis of which this utility was developed, successfully entered the second round of the All-Russian competition-review of works “ Eureka-2006 ”.
It turned out a mini-utility for the rapid construction of quantitative forecasts with the ability to visualize: FastCast .
Using this utility you can, for example:
- quickly assess the trends of any economic indicator;
- obtain a preliminary justification of the rationality of using a particular method, assessing the dynamics of changes in a specific quantitative criterion;
- Enter the air temperature for the last 5 days and find out what it will probably be tomorrow :)
There are many applications for this Internet utility, it would be a desire. ;-)
This utility uses two prediction models:
- trend model - this model allows you to display the trend of the series, it is very simple and it can be used for a fluent analysis;
- Brown’s method is an adaptive method using exponential smoothing — often used by financial analysts.
These methods are not a panacea - you need to apply them wisely. This utility is useful if you need to very quickly build a forecast.
The Internet system, on the basis of which this utility was developed, successfully entered the second round of the All-Russian competition-review of works “ Eureka-2006 ”.
')
Source: https://habr.com/ru/post/17985/
All Articles