Moving to MySQL 5.6, is it worth it?
After the release of the new version of MySQL at the beginning of this year, many are thinking about whether it is worth switching to it from older versions. To answer this question for yourself, you first need to understand what exactly this transition will give. In this article I will try to highlight the new, important for me, features that were included in the distribution of the new version, analysis of their performance and performance of the new version, as well as the need to change something in the code due to the rewritten optimizer. Since the volume of changes is really very large, for each item I will give a link to the original article on performance testing and exclude water from the description.
Index Condition Pushdown (ICP) - this optimization is performed if we access data in a table using a composite index. If the condition on the first part of the key can be applied explicitly, and the condition on the remaining part of the key cannot be explicitly applied, for example:
previously, the
According to testing, the performance when requesting data from the cache will be about 30-50 percent, while working with the I / O subsystem it is possible to accelerate up to 100 times.
Multi Range Read (MRR) - when conducting a
File Sort Optimization - sorting by non-indexed column has become significantly more productive, subject to certain conditions. Previously, when performing this sort of sorting, the only possible option was merge sorting. Roughly speaking, the data received as a result of the query was stored in a temporary table. After that, this table was sorted and records returned satisfying the
When conducting synthetic tests , an acceleration of 4 times was obtained. But it is also necessary to understand that this optimization allows to reduce the load on the input-output subsystem, which will positively affect the work of the entire instance.
Subqueries optimization
When materializing and subsequently indexing a subquery in the
As you understand, rewriting crookedly written requests (I would have torn my hands for such requests, now it has become forgivable) can simply give a huge performance boost, so it’s almost meaningless to run tests on
Static statistics for
Finally it happened. I don’t know where, from
As an output from the optimizer, I think it is useful to note that the Maria DB 5.5 optimizer is more sophisticated, experts say, but in MySQL version 5.6 a number of similar optimizations allow for higher performance.
As everyone well knows, MySQL does not scale well enough to a large number of processors with a large number of simultaneously executed transactions. The reason for this is internal locks, in particular,
According to the developer blogs,
It is now possible to reset UNDO in parallel. For this, it is necessary to set the
')
As you know, dumping dirty blocks from memory is one of the most problematic places for any versioned database. The necessary part of the blocks can be reset to the disk either by the main
Now the reset of blocks really began to be performed asynchronously. If you decide to play with the block reset parameters, I also recommend that you pay attention to the new
Reset blocks have been adapted for SSD drives. This hazy phrase means the following. As we know, block caching is done by pages. 64 pages form an extent. It is common for neighbors to call these most consistent pages within one extent. Previously,
As an output, it would not be superfluous to notice the results of this test .


As can be seen from the graphs when working with the cache, a new version with an optimized reset,

When working with the file system, the results are not so impressive and both versions go nostril to nostril and MySQL 5.6 even loses in some places. However, according to the author, upon exiting
All the praises of this technology can be safely described in two words - banal advertising . According to the developers, this team was rewritten a little more than completely, but the
And so what can:
Well, that's all. As you can see from the description, the opportunities provided to us are extremely scarce , let's hope that the situation will improve in the future and changes to large tables can be performed without dances with a tambourine, which are associated with full table copying when performing any (with
The partition engine was substantially reworked. Now the selection of partitions for processing is performed earlier than opening tables and setting locks. Here is an analysis of the input output in a trivial request for a partition key.
Input output and buffer pool
5.5 , . .
, , ,
InnoDB:
: ,
—
—
—
—
—
—
, .
. , .. 10% 3.5%, . 17 , 52. , , , , .
, , 5.5, . , , . 5.5
.
, 20%, , , , . , MySQL , , , .
Let's start with the most interesting - optimizer extensions
Index Condition Pushdown (ICP) - this optimization is performed if we access data in a table using a composite index. If the condition on the first part of the key can be applied explicitly, and the condition on the remaining part of the key cannot be explicitly applied, for example:
keypart1 = 1- access predicate,keypart2 like '%value%'- filtering predicate,- or impose on both parts of the range key condition
keypart1 between a and b- access predicate,keypart2 between c and dfiltering predicate (full use of the index for this type of query as an access predicate inMySQLhas not yet been implemented)
previously, the
MySQL server, after applying the access predicate, would switch to the storage engine and, reading the table row, would apply the second condition. Using this option, this switch will not, of course, if the storage engine itself supports ICP , at the moment it is MyISAM and InnoDB , and the filtering predicate will be applied solely on the basis of index data. The plan will be Using index condition .According to testing, the performance when requesting data from the cache will be about 30-50 percent, while working with the I / O subsystem it is possible to accelerate up to 100 times.
Multi Range Read (MRR) - when conducting a
Range Scan using secondary keys, to reduce the number of arbitrary disk readings, first we read all the necessary data from the index, then we sort by ROWID , and only after that we read the data by the primary key. In the plan, which is undoubtedly wonderful, will be Using MRR . This operation is a bulk. Those. applying access predicates by the secondary key - we fill the available buffer, and only after that we sort and read the data. At this point either lucky and the data is close to each other or not. For distributed tables, the situation is even better, but this is beyond the scope of this article. In its pure form, this algorithm can be applied when executing a query on a single table. In combination with Batch Key Access (BKA), it also significantly speeds up join operations. By default, the BKA flag is turned off, its value, as well as any value of the optimizer flags, can be viewed by running the SELECT @@optimizer_switch query. When BKA is enabled, it is necessary to check your requests for different values of the join_buffer_size parameter join_buffer_size since this parameter will be used to calculate the maximum buffer size. When applying this remarkable algorithm in the query plan, we will see the Using join buffer (Batched Key Access) . More detailed coverage of the topic here . According to the results of testing, this optimization can give significant accelerations only under the condition of inputting output and working with the disk. In this case, you can get 10-fold acceleration only with MRR . In a number of other synthetic tests, accelerations of up to 280 times were obtained when MRR and BKA used together. When working exclusively with memory, you will not get acceleration, which is quite logical, since this operation is designed to optimize only input and output.File Sort Optimization - sorting by non-indexed column has become significantly more productive, subject to certain conditions. Previously, when performing this sort of sorting, the only possible option was merge sorting. Roughly speaking, the data received as a result of the query was stored in a temporary table. After that, this table was sorted and records returned satisfying the
LIMIT condition. As you can see, this algorithm is not very productive, especially if you have a lot of queries that return a small number of rows. In order to optimize the input-output algorithm has been changed to the following. If the number of records received as a result of the query is fully placed in the sort_buffer_size , a queue is created when scanning the table. This queue is ordered, and is filled immediately at the moment of receiving the next line of the query result. Queue size N (or M + N if LIMIT M, N ). When the queue is full, extra data is discarded from the end. Thus, the end of sorting is performed simultaneously with the end of the query result, and there are no calls to the temporary table at all. The optimizer chooses a strategy for sorting. The queue will be used when you need to load the processor more, merge sorting when the input / output system is available.When conducting synthetic tests , an acceleration of 4 times was obtained. But it is also necessary to understand that this optimization allows to reduce the load on the input-output subsystem, which will positively affect the work of the entire instance.
Subqueries optimization
postpone materialization - basically it concerns the speeding up of building a query plan. Previously, when executing the EXPLAIN command, the subqueries used in the FROM section were materialized to obtain statistical data on them. Those. in fact, these queries were executed on the database. Now this operation is not performed, and it became possible to receive the query plan without loading the DB instance. However, the query execution time can also be accelerated, for example, if there are 2 materializable representations in the FROM section and the first has not returned any records, the 2nd one will not be executed. Also during the execution of a query, MySQL can independently index the resulting materialized table, if it deems it necessary.semi-join transformation - a semi-join transformation can be used to obtain data from only one table, based on data from another table, in all databases the classic example is the EXISTS construction. The use of this optimization has become possible for the IN construct which used to work very badly. In order for the application of this optimization to become possible, the subquery satisfies the following conditions: the absence of UNION , the absence of GROUP BY and HAVING , the absence of ORDER BY with the LIMIT constraint (these constructions can be used separately). It is also necessary that the number of subqueries does not exceed the maximum number of tables allowed for JOIN , otherwise MySQL will not be able to rewrite this query. Optimization is achieved by rewriting the query in SEMI JOIN or by presenting the subquery as a VIEW in the FROM construct and using the optimizations for the postpone materialization described above. Duplicate entries from the final result are removed in the following ways:- by placing the unique results of the final query in a temporary table (
Start temporaryandEnd temporaryin theExtraplan column) - using the “first found” criterion at the stage of scanning a table from a subquery (
FirstMatch(tbl_name)in theExtraplan column) - by applying the optimization Loose Index Scan (
LooseScan(m..n)where m and n are parts of the key used for this optimization)
When materializing and subsequently indexing a subquery in the
select_type column of the query plan will be MATERIALIZED . To understand how exactly the query was rewritten, you can use the standard EXPLAIN EXTENDED command. This way you will always understand exactly how your query was rewritten, and whether optimization was applied.As you understand, rewriting crookedly written requests (I would have torn my hands for such requests, now it has become forgivable) can simply give a huge performance boost, so it’s almost meaningless to run tests on
table pullout (removal of the subquery from the WHERE condition to the FROM condition) for a 1000-fold increase in performance will not be the limit, but if all your queries are written correctly, then you can not wait for something extraordinary from this type of optimization.Static statistics for
InnoDBFinally it happened. I don’t know where, from
Google , Percona or from Oracle itself, but MySQL has the opportunity to exclude dynamic sampling from the construction of the query plan. Now statistics on tables and indexes are stored in persistent tables. This statistics collection method is enabled by default. When updating more than 10% of the data in the table, the statistics on it is automatically rebuilt (of course, this can be changed). Also, statistics collection can be started by the command ANALYSE . To force a reset of statistics when the optimizer is unprecedentedly blunt, you can call the command FLUSH TABLE . What exactly is going to can clearly see in the new tables mysql.innodb_index_stats , mysql.innodb_table_stats . These are certainly not advanced histograms, but progress on the face. Now plans have become more stable on the one hand, and on the other hand, DB administrators have new entertainment: come when the statistics in the table have become irrelevant, find idle time, guess the sampling volume and recalculate it, especially as it follows from the developers blog, the statistics can be changed with pens by direct updates. I would also like to note that during the tests, the statistics collector, apparently working in the background thread, did not have time to process the data. Statistics remained empty for a long time, until I started analyzing it manually. Analysis of statistics for a specific partition cannot be started. Therefore, it was necessary to analyze the entire partitioned table, which of course is not very convenient. The same situation arises if you hold the active DML and put the base. The data will be - no statistics. But I think these are exceptional situations and they will not interfere with the normal operation of the database.As an output from the optimizer, I think it is useful to note that the Maria DB 5.5 optimizer is more sophisticated, experts say, but in MySQL version 5.6 a number of similar optimizations allow for higher performance.
More good and different mutexes
As everyone well knows, MySQL does not scale well enough to a large number of processors with a large number of simultaneously executed transactions. The reason for this is internal locks, in particular,
kernel mutex , as well as fundamental problems when working with memory in a multi-core architecture. Kernel mutex , held while copying the list of active transactions, was divided into several mutexes, for non-blocking and blocking transactions, locks, waiting locks, etc. Also, the problem of false sharing 'was solved, when one core loaded the unchangeable data it needed, and the other needed it changed in one cacheline , and as a result, the data for the first core was all the time washed out of the cache. Now alignment of 64 bytes is introduced for a number of critical objects.According to the developer blogs,
MySQL began to scale up to 50% better for read only transactions. And the performance gain with an increase in the number of active sessions was up to 600% compared with the previous version. When conducting independent load tests, up to 16 simultaneous sessions - the operation speed has not changed, higher - up to 100% for mixed read-write transactions and up to 300% for read-only transactions.UNDO Reset Optimization
It is now possible to reset UNDO in parallel. For this, it is necessary to set the
innodb_purge_threads parameter to a value greater than 1. It will be reasonable to experiment with this parameter on the industrial database only for those who simultaneously delete a lot of data from partitioned tables. Performance improvements for those who do not use partitioning or use partitions for reasons other than parallel DML, such as archiving, in which DML operations are performed with only one partition, will not, because when you reset data, you will hang on the dict_index_t::lock . For them, it is recommended, as before, to simply allocate a data reset to one, separate from the main, stream.')
Optimization of dirty block reset
As you know, dumping dirty blocks from memory is one of the most problematic places for any versioned database. The necessary part of the blocks can be reset to the disk either by the main
InnoDB Master Thread , and then everyone will wait, or, as the background thread basically happens, a specific session will give a reset command, and then this session will hang indefinitely, and the rest Sessions will not be blocked. To avoid problems both in the first and in the second case, a separate thread called page_cleaner was created. Detailed information on what this stream is busy can be found here. select name, comment from information_schema.innodb_metrics where name like 'buffer_flush_%'; Now the reset of blocks really began to be performed asynchronously. If you decide to play with the block reset parameters, I also recommend that you pay attention to the new
LRU flush optimization parameters, since these parameters, according to the MySQL developers, can indirectly influence each other.Reset blocks have been adapted for SSD drives. This hazy phrase means the following. As we know, block caching is done by pages. 64 pages form an extent. It is common for neighbors to call these most consistent pages within one extent. Previously,
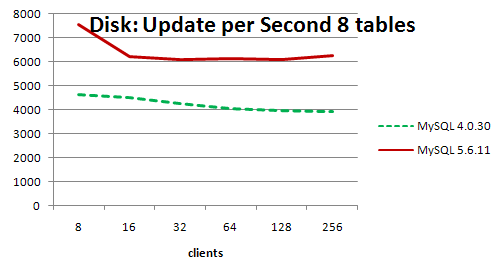
InnoDB when changing pages, tried to accumulate a whole extent to flush data to disk to optimize I / O, since for a HDD one megabyte is the optimal size, which allows you to perform the operation in one disk access. For SSD, a reset size of only 4 kilobytes is possible, so typing something is meaningless. In addition, dropping unchanged pages is also meaningless. So the owners of modern iron can play with the parameter .As an output, it would not be superfluous to notice the results of this test .
As can be seen from the graphs when working with the cache, a new version with an optimized reset,
MySQL 4.0.30 (I don’t know the reasons for choosing the old version) with a small number of sessions, but it shows an order of magnitude better result when scaling.When working with the file system, the results are not so impressive and both versions go nostril to nostril and MySQL 5.6 even loses in some places. However, according to the author, upon exiting
5.6.12 , this drawback will be eliminated, and the performance will jump 3 times. Those. for those who have problems with a large input output and an active reset of buffers to disks, it is worth waiting for the next version, you will be happy.InnoDB: ALTER TABLE ... ONLINE
All the praises of this technology can be safely described in two words - banal advertising . According to the developers, this team was rewritten a little more than completely, but the
InnoDB-engine team didn’t get any significant advantages from it. In online are only a limited number of extremely rare operations, and even with restrictions. To understand that the operation went online very easy. As a result of the request, you will receive Query OK, 0 rows affected And so what can:
CREATE INDEX, DROP INDEX- we are all used to the fact that the execution of these commands does not perform a full copy of the table, however it blocks the updating of data in it. This is due to the fact that the index was previously built directly on the table and had, at the time of sorting and merging, a complete set of data, which allows you to create the most balanced index tree. Now, at the time of creating the index, a read-only lock is hung on the table. New data coming in or disappearing from the table is placed in a special log file created by analogy with thechange bufferstructure, the file size is governed by the variableinnodb-online-alter-log-max-size. After the sorting and merging (the size of the sorting buffer is controlled by the variableinnodb-sort-buffer-size), the data for the new index is flushed to theREDOlogs, after which the logged changes are made. Voila and the index is available for use. On the one hand, this does not block the table, on the other hand, the structure of the created index will not be as perfect as in the first case, and even creating it in the case of an activeDMLtable can take a lot of time, but this is of course trivial.- Changing the
auto-incrementvalue for a table is undoubtedly useful for those users who use a self-written sharding that splits data into instances based on the value of the primary key. DROP FOREIGN KEY- only deleting, adding the constraint has not yet been mastered, but as a bonus they allowed to delete the constraint and the index associated with it with one command.ALTER TABLE table DROP FOREIGN KEY constraint, DROP INDEX index;
A fair remark from the MySQL support staff member of the svetasmirnova : “You can also add it only whenforeign_key_checksoff”, in this case the table will not be copied- Renaming a column
onlineis possible only if the data type is not changed. Only the dictionary data is changed. Again, as a bonus, they were allowed to rename the pegs that are part of the foreign key.
Well, that's all. As you can see from the description, the opportunities provided to us are extremely scarce , let's hope that the situation will improve in the future and changes to large tables can be performed without dances with a tambourine, which are associated with full table copying when performing any (with
MySQL 5.6 we read any except for 5 ) DDL commands.Partitioning
The partition engine was substantially reworked. Now the selection of partitions for processing is performed earlier than opening tables and setting locks. Here is an analysis of the input output in a trivial request for a partition key.
select count(1) from part_table where partition_key = 190110; +----------+ | count(1) | +----------+ | 500 | +----------+ 1 row in set (0.50 sec) Input output and buffer pool
select count(distinct file_name) file_name_count, sum(sum_number_of_bytes_read) sum_number_of_bytes_read, min(substring_index(file_name, '/', -1)) min_file_name, max(substring_index(file_name, '/', -1)) max_file_name from performance_schema.file_summary_by_instance where file_name like '%part_table%.ibd' and count_read + count_write > 0 order by 1; -- Server version: 5.5 +-----------------+--------------------------+------------------------------------+------------------------------------+ | file_name_count | sum_number_of_bytes_read | min_file_name | max_file_name | +-----------------+--------------------------+------------------------------------+------------------------------------+ | 1024 | 107692032 | part_table#P#part_table_184609.ibd | part_table#P#part_table_190110.ibd | +-----------------+--------------------------+------------------------------------+------------------------------------+ -- Server version: 5.6 +-----------------+--------------------------+------------------------------------+------------------------------------+ | 1 | 98304 | part_table#P#part_table_190110.ibd | part_table#P#part_table_190110.ibd | +-----------------+--------------------------+------------------------------------+------------------------------------+ select min(table_name) min_table_name, max(table_name) max_table_name, count(distinct table_name) file_name_count, sum(data_size) pool_size from information_schema.innodb_buffer_page where table_name like '%part_table%'; -- Server version: 5.5 +--------------------------------------+--------------------------------------+-----------------+-----------+ | min_table_name | max_table_name | file_name_count | pool_size | +--------------------------------------+--------------------------------------+-----------------+-----------+ | test/part_table#P#part_table_184609 | test/part_table#P#part_table_190110 | 1024 | 26567424 | +--------------------------------------+--------------------------------------+-----------------+-----------+ -- Server version: 5.6 +--------------------------------------+--------------------------------------+-----------------+-----------+ | Partition `part_table_190110` | Partition `part_table_190110` | 1 | 32048 | +--------------------------------------+--------------------------------------+-----------------+-----------+ 5.5 , . .
, , ,
wait/synch/mutex/mysys/THR_LOCK::mutex , .. , , . . ( , , mysql.innodb_table_stats , , ). . , , , , , hint parallel(n) .InnoDB:
EXCHANGE PARTITION ALTER TABLE part_table EXCHANGE PARTITION p1 WITH TABLE non_part_table; : ,
storage engine , .Transportable Tablespaces.ibd — . : REDO , , , . :—
FLUSH TABLES table_one, table_two FOR EXPORT;—
.ibd—
—
ALTER TABLE table_one DISCARD TABLESPACE;—
.ibd—
ALTER TABLE table_one IMPORT TABLESPACE;, .
Performance Schema
. , .. 10% 3.5%, . 17 , 52. , , , , .
show tables like '%statements%'; +----------------------------------------------------+ | Tables_in_performance_schema (%statements%) | +----------------------------------------------------+ | events_statements_current | | events_statements_history | | events_statements_history_long | | events_statements_summary_by_account_by_event_name | | events_statements_summary_by_digest | | events_statements_summary_by_host_by_event_name | | events_statements_summary_by_thread_by_event_name | | events_statements_summary_by_user_by_event_name | | events_statements_summary_global_by_event_name | +----------------------------------------------------+ 9 rows in set (0.01 sec)- (
object_type= 'TEMPORARY TABLE', - , )select digest_text, sum_rows_affected, sum_rows_sent, sum_rows_examined from events_statements_summary_by_digest; +---------------------------------------+-------------------+---------------+-------------------+ | digest_text | sum_rows_affected | sum_rows_sent | sum_rows_examined | +---------------------------------------+-------------------+---------------+-------------------+ | SHOW VARIABLES | 0 | 4410 | 4410 | ... | SET NAMES utf8 | 0 | 0 | 0 | +---------------------------------------+-------------------+---------------+-------------------+ 48 rows in set (0.00 sec) show tables like '%by_thread%'; +---------------------------------------------------+ | Tables_in_performance_schema (%by_thread%) | +---------------------------------------------------+ | events_stages_summary_by_thread_by_event_name | | events_statements_summary_by_thread_by_event_name | | events_waits_summary_by_thread_by_event_name | +---------------------------------------------------+ 3 rows in set (0.00 sec)- , , ,
select digest_text, sum_created_tmp_disk_tables, sum_created_tmp_tables from events_statements_summary_by_digest; +--------------------------------------------------------+-----------------------------+------------------------+ | digest_text | sum_created_tmp_disk_tables | sum_created_tmp_tables | +--------------------------------------------------------+-----------------------------+------------------------+ | SHOW VARIABLES | 0 | 10 | ... | SELECT `routine_schema` , `specific_name` FROM INF... | 2 | 2 | ... | SHOW TABLE STATUS FROM `performance_schema` LIKE | 0 | 52 | +--------------------------------------------------------+-----------------------------+------------------------+ 49 rows in set (0.00 sec) - , ,
show tables like 'table%waits%sum%'; +-------------------------------------------------+ | Tables_in_performance_schema (table%waits%sum%) | +-------------------------------------------------+ | table_io_waits_summary_by_index_usage | | table_io_waits_summary_by_table | | table_lock_waits_summary_by_table | +-------------------------------------------------+ 3 rows in set (0.01 sec)
, , 5.5, . , , . 5.5
events_waits_history_long 100 , , .Conclusion
.
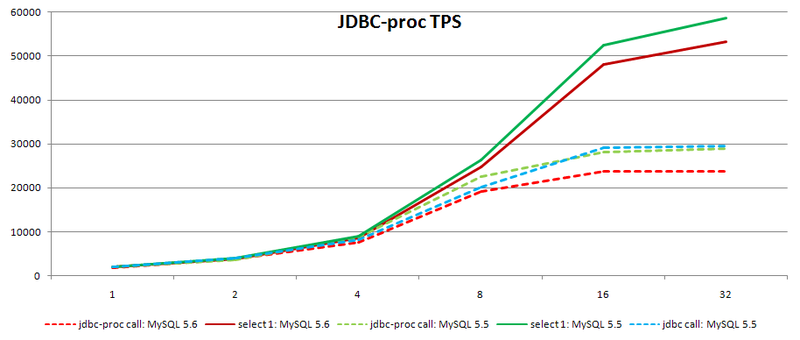
MySQL 5.6 MySQL 5.5 7.5-11 11-26 64 , . Those. , . , , . . , esinev , jbdc-proc . ., 20%, , , , . , MySQL , , , .
Source: https://habr.com/ru/post/179481/
All Articles