In-app purchases - some statistics
Statistics is a very good and necessary tool. Especially when it comes to money. It will never be superfluous. Proper analysis and application can help you save, earn, or optimize your costs or revenues.
In this post, I would like to share the collected data on In-App purchases in one of my games that will be useful to you if you are developing and / or promoting games for iOS, although I think that these figures can be easily applied to other platforms, such as Android.
For obvious reasons, I do not publish the link to the game itself, if you wish, you can find it without any problems. In any case, these data do not strongly depend on the game, because more show the relative purchasing power of the country and not the specific amount of money earned. So there will be no exact numbers, only relative.
In the list of 13 countries sorted by the number of horse racing games and arranged in descending order, i.e. the higher the country on the list, the more the game was racing.
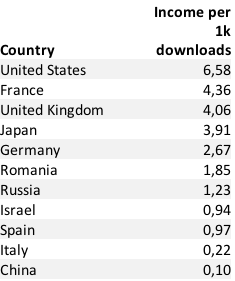
The number in the second column is the amount of money earned on the In-App / number of game downloads, i.e. how many brings 1000 installations in a given country. I could not find a suitable name for this number, eCPM does not fit here, ARPU is also not quite right, so it will remain without a name.
Data for the last 3 - 4 countries may not be entirely accurate, since the number of installations is not too large (2K-5K) which may give a small error.
')
Thanks to hazyouzer Azy who prepared such beautiful pictures with countries sorted by the amount of money brought:

It is also interesting to compare the number of downloads and money by the storages of Russia and the USA relative to the positions in these same storachs.
The game itself a few days ago was in first place in Russia in the Free Games / Racing and Games / Sport categories with good Games and Top Overall positions.
For the USA, the best result of which was achieved at the moment is 35 and 42 in Racing and Sport with 423 in Games and 1205 in Top Overall.
At the same time, the number of game installations in Russia is 5.4 times more than in the USA with absolutely the same amount of money earned (a difference of $ 1) on In-App purchases.
Active Users / Total Instals ratio: 0.44
those. almost every second started the game more than once.
One active user accounts for about 10 sessions.
Unfortunately, I did not find the display of this parameter in Flurry, so I calculated it approximately.
The longest median average duration of a gaming session in Europe and Central America is 121 seconds, the fastest to close the game in Australia, after an average of 93 seconds.
Also, I built a custom event for testing the code responsible for opening the buns available for In-App purchases. I was very surprised to see a difference of 150 times between real and fake purchases. Of course, I understood that people are breaking purchases, but I did not expect that on such a scale.
I hope these numbers will seem interesting to you, and maybe even useful.
Also, if you have running games in the App Store for me, and not only for me, I think it would be very interesting to know your results in the comments.
All comments on errors and typos please send in a personal.
In this post, I would like to share the collected data on In-App purchases in one of my games that will be useful to you if you are developing and / or promoting games for iOS, although I think that these figures can be easily applied to other platforms, such as Android.
For obvious reasons, I do not publish the link to the game itself, if you wish, you can find it without any problems. In any case, these data do not strongly depend on the game, because more show the relative purchasing power of the country and not the specific amount of money earned. So there will be no exact numbers, only relative.
In the list of 13 countries sorted by the number of horse racing games and arranged in descending order, i.e. the higher the country on the list, the more the game was racing.
The number in the second column is the amount of money earned on the In-App / number of game downloads, i.e. how many brings 1000 installations in a given country. I could not find a suitable name for this number, eCPM does not fit here, ARPU is also not quite right, so it will remain without a name.
- Russia - 1.23
- Israel - 0.94
- China - 0.10
- United States - 6.58
- Vietnam - 0.00
- France - 4.36
- Germany - 2.67
- United Kingdom - 4.06
- Romania - 1.85
- Italy - 0.22
- Thailand - 0.00
- Spain - 0.97
- Japan - 3.91
Data for the last 3 - 4 countries may not be entirely accurate, since the number of installations is not too large (2K-5K) which may give a small error.
')
Thanks to hazyouzer Azy who prepared such beautiful pictures with countries sorted by the amount of money brought:
It is also interesting to compare the number of downloads and money by the storages of Russia and the USA relative to the positions in these same storachs.
The game itself a few days ago was in first place in Russia in the Free Games / Racing and Games / Sport categories with good Games and Top Overall positions.
For the USA, the best result of which was achieved at the moment is 35 and 42 in Racing and Sport with 423 in Games and 1205 in Top Overall.
At the same time, the number of game installations in Russia is 5.4 times more than in the USA with absolutely the same amount of money earned (a difference of $ 1) on In-App purchases.
And a few more numbers for this game collected using the Flurry service:
Active Users / Total Instals ratio: 0.44
those. almost every second started the game more than once.
One active user accounts for about 10 sessions.
Unfortunately, I did not find the display of this parameter in Flurry, so I calculated it approximately.
The longest median average duration of a gaming session in Europe and Central America is 121 seconds, the fastest to close the game in Australia, after an average of 93 seconds.
Also, I built a custom event for testing the code responsible for opening the buns available for In-App purchases. I was very surprised to see a difference of 150 times between real and fake purchases. Of course, I understood that people are breaking purchases, but I did not expect that on such a scale.
I hope these numbers will seem interesting to you, and maybe even useful.
Also, if you have running games in the App Store for me, and not only for me, I think it would be very interesting to know your results in the comments.
All comments on errors and typos please send in a personal.
Source: https://habr.com/ru/post/179303/
All Articles