Salvation for a project manager or building an IMR
Salvation of managers drowning in the project, the work of the managers themselves. It happens that neither the management nor the subordinate employees for some reason notice your gurgling and screaming, in the end you suffer a crushing crash and, like the legendary Titanic, go to the bottom. Why does this happen?
One of the common reasons is the loss of part of the work required, attempts to further include them in an already tight schedule, which at best lead to overwork, overtime, backlog from the schedule, at worst - to the total collapse of the project.
In order not to lose sight of anything, from the very beginning of the project you should pay as much attention as possible to the list of works to be done. But in linear, single-level lists it is easy to get confused and lost. It is here that the hierarchical structure of work on the project , also known as the SRI, comes to the rescue.
ISR is a work tree whose root is the whole project. We will analyze the ISR, first on the example of abstract pictures.
')
By the way, I like to draw such structures in Mindjet MindManager. Although any other software will be suitable for drawing up mental maps and even Microsoft Visio. I personally like MindManager with its flexibility and icons and comments for individual nodes of the structure.
So, our project:

Suppose it consists of several tasks and subtasks:
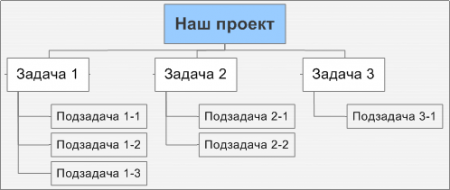
The diagram clearly shows the dependencies between tasks and subtasks. Accordingly, to complete Task 1, you need to complete 3 subtasks, and to complete the entire project, all 3 main tasks. This diagram is really nothing more than a structural hierarchical decomposition of works. But, in a very convenient way.
The main rule for creating such a diagram is that any element can have only one parent. Only one and nothing more.
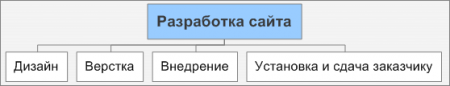
Let's now move from abstract to concrete examples. Let's take a simple example, let's say we need to develop a small website, and use some ready-made CMS to base it.
Our work will consist of the usual tasks for a simple site: design , layout layouts , their implementation in the CMS and installation and delivery to the customer .
We will move on, trying to decompose the tasks into the smallest components, that is, we are decomposing.
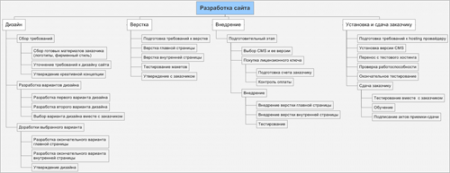
This diagram does not pretend to objectivity and completeness, because it was compiled in 5 minutes, but it should show the general direction of movement for the decomposition of tasks.
By the way, for large projects you can not try to draw such a diagram in one step. It is enough just to move from top to bottom and keep it constantly updated in accordance with the current situation in the project.
Using this diagram it is very easy to do a number of useful and sometimes necessary things:
Original: Rescue for a project manager or building an IMR
One of the common reasons is the loss of part of the work required, attempts to further include them in an already tight schedule, which at best lead to overwork, overtime, backlog from the schedule, at worst - to the total collapse of the project.
In order not to lose sight of anything, from the very beginning of the project you should pay as much attention as possible to the list of works to be done. But in linear, single-level lists it is easy to get confused and lost. It is here that the hierarchical structure of work on the project , also known as the SRI, comes to the rescue.
ISR is a work tree whose root is the whole project. We will analyze the ISR, first on the example of abstract pictures.
')
By the way, I like to draw such structures in Mindjet MindManager. Although any other software will be suitable for drawing up mental maps and even Microsoft Visio. I personally like MindManager with its flexibility and icons and comments for individual nodes of the structure.
So, our project:
Suppose it consists of several tasks and subtasks:
The diagram clearly shows the dependencies between tasks and subtasks. Accordingly, to complete Task 1, you need to complete 3 subtasks, and to complete the entire project, all 3 main tasks. This diagram is really nothing more than a structural hierarchical decomposition of works. But, in a very convenient way.
The main rule for creating such a diagram is that any element can have only one parent. Only one and nothing more.
Let's now move from abstract to concrete examples. Let's take a simple example, let's say we need to develop a small website, and use some ready-made CMS to base it.
Our work will consist of the usual tasks for a simple site: design , layout layouts , their implementation in the CMS and installation and delivery to the customer .
We will move on, trying to decompose the tasks into the smallest components, that is, we are decomposing.
This diagram does not pretend to objectivity and completeness, because it was compiled in 5 minutes, but it should show the general direction of movement for the decomposition of tasks.
By the way, for large projects you can not try to draw such a diagram in one step. It is enough just to move from top to bottom and keep it constantly updated in accordance with the current situation in the project.
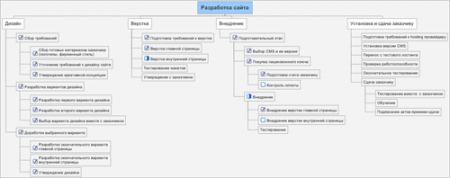
Using this diagram it is very easy to do a number of useful and sometimes necessary things:
- Do not forget about the tasks, especially critical of which can be marked with a different color;
Mark the implementation of certain tasks (as in the figure above) - Make an assessment of the project, and if we go from the bottom up, then we can make an accurate assessment, and if from the top down, then we can remove some tasks to fit the project to a certain budget.
- Mark the performers on this diagram and do not forget about the warning (or booking) of the people needed for the project.
- Outline the supply plan, in the case of a large project, highlighting the finished pieces (in this diagram it can be design, layout, implementation and installation)
- From such a chart it is very easy to go to calendar-based network graphics and the much-loved Gantt chart.
Original: Rescue for a project manager or building an IMR
Source: https://habr.com/ru/post/17835/
All Articles