We study the debugger, part three
What is the debugger, how to use it and how it is implemented, after reading the first and second part of the article, you know. In the final part of the article we will try to consider some methods of dealing with a debugger, based on knowledge of the principles of its operation. I will not give a patterned set of anti-debugging techniques, good if you wish, all this can be found on the Internet, I will try to do it in a slightly different way, based on some abstract application that will extend the protection code from the simplest scheme to ... until you get bored :)
Immediately make a reservation, in the confrontation application / debugger, the latter will always win :)
But, only if they are used by a competent specialist, and it is practically useless to fight such specialists (well, unless of course you have at least the same qualifications).
However, as practice shows, competent specialists do not engage in uninteresting tasks for them, leaving them at the mercy of novice reversers who have not yet bitten through their granite of science and can stumble upon some not obvious tricks.
')
This is something we will consider, only in a very simplified form.
Imagine we have some software that we decided to sell. For simplicity, let it be an ordinary VCL application from an empty form (well, well, if not empty, but with a picture for the whole face) and we want to sell it. The first question that needs to be concerned is how to make our picture visible only to those who paid for it? More precisely - how to distinguish between trial and legal users?
The most obvious solution is the key. A trial user does not know him, and a legal user who has paid for it with real money can activate a legal copy of the application and enjoy the picture.
The key is so key.
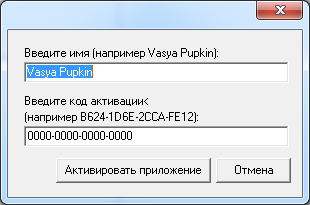
We create a new VCL application, throw a TImage on the form with a picture, we set Visible to False. After that we place two TEdit on the form, the first for the username and the second for the activation code. Well, two buttons - close the application and activate.
Somehow like this:
After that, we write a "completely secret" activation code:
The essence of the code is as follows:
based on the username, the application generates a serial number and compares it with the entered user. If everything is normal, then all the controls responsible for activation are removed and the picture is displayed, which the user was eager to see.
Suppose this:
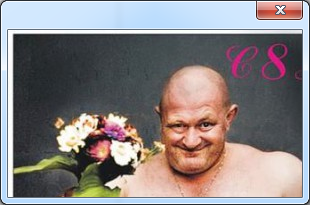
(well ... the first thing I found :)
After the manipulations made, “this” is published on various globular websites and sometimes even references are made to the programming forums in the topics like: “test plz protection”.
And what does this look like from a hacker?
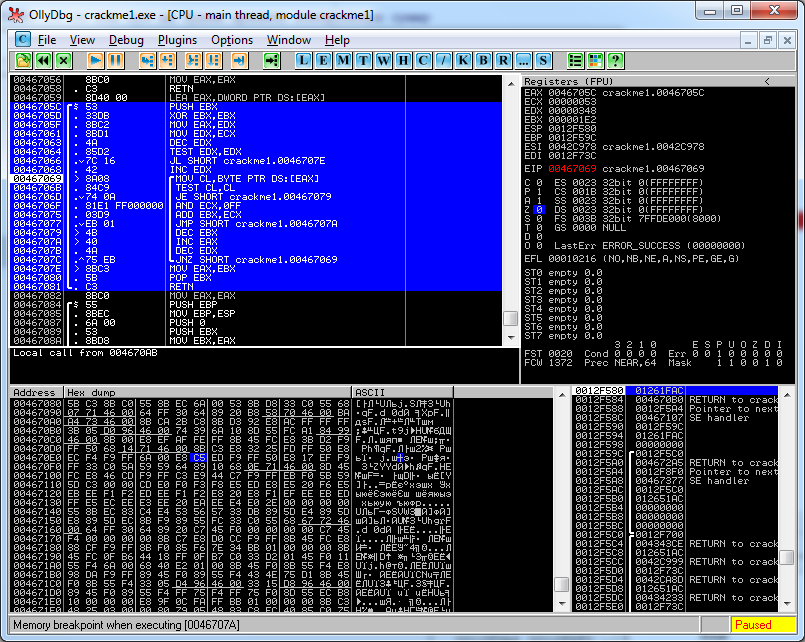
He takes a debugger (for simplicity, let's take the same Olly Debug) and sees this picture:
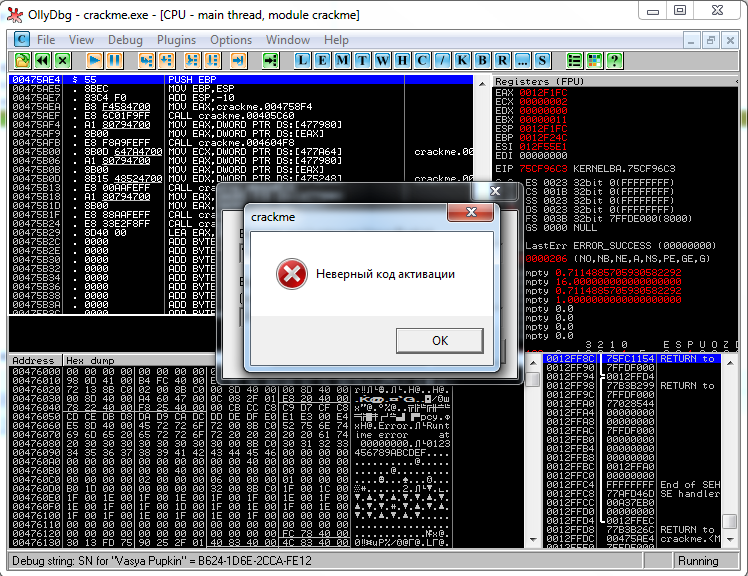
He doesn’t have an application code, but there is a characteristic mistake of novice “defenders” of the software - the conclusion of a dialogue about the wrong key.
What does it give a cracker?
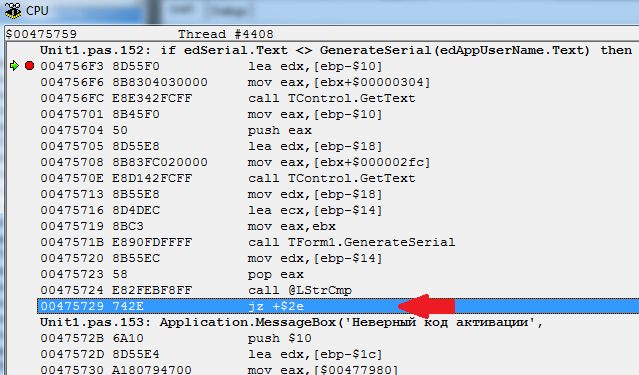
He puts the BP on the call to MessageBoxA and running the application catches the call for this message, after which, by clicking on the “OK” button, he can return to the code in which the error is called, where, looking a little higher, he can determine the presence of a conditional transition, based on which is the challenge:
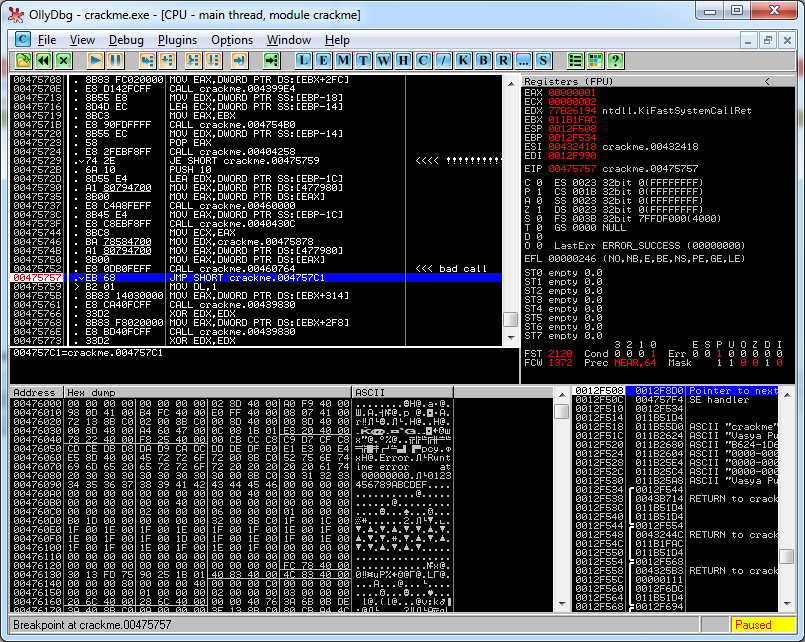
In the picture, the program's decision point is highlighted with exclamation marks.
All that is left for him to do is fix the JE instruction on the JMP, thus disabling the check of the serial code and ensuring a valid transition to the area of code that should be executed only when the application is activated.
Somehow it is not clear, right?
Well then, here's a picture for you from the Delphi debugger:
Here, the code is more understandable for debugging, and its reading is more convenient due to the unwinding of addresses and bringing them into a readable form. For example, it is now clearly visible that before going to the address 0x475729, at which the decision is made, the text from the TEdits is received and the GenerateSerial procedure is called.
The hacker does not possess such information, and as can be seen in the previous image, he will have to analyze all the challenges in order to create a more or less comprehensible image for the analysis. Well, the truth is, I’m exaggerating a bit here, in fact, the application map is built quite simply, with the availability of tools, but ... But some people sometimes try hard to debug the system modules of the delphi, and I’m honored and praised for their persistence :)
Well, the nuance, at the address 0x475729 on the screen, there are two different instructions - JZ and JE, these are the nuances of the interpretation of disassemblers, they are identical.
There is one interesting approach that I voiced several times.
Here, a little higher, I announced that I would put BP on MessageBoxA, but they tell me that they will call MessageBoxW and will not be able to catch the call. This is an application for a solid four-plus, for yes, indeed, if the application calls the Unicode API, there will be a slight miss with the bounce, but there is a nuance. And let's deploy the entire MessageBox call stack.
See what interesting scheme is obtained:
MessageBoxA -> MessageBoxExA -> MessageBoxTimeOutA -> MessageBoxTimeOutW-> SoftModalMessageBox ()
So yes, we can put BP on calling any of the listed functions (usually enough MessageBoxTimeOutW) to catch the call we need, by the way, the MessageBoxW function will also call it.
There is a true little nuance, in Delphi there are other ways to display a window.
Well, for example ShowMessage (). This method does not call the MessageBox API.
It is fun enough to listen to the reasoning that this method is fully implemented as a separate form in which the buttons are placed as they need and in general are the insides of the VCL itself, of which nothing is clear in the debugger.
So it is so, if the given call did not rest on the ShowWindow API, from which we will also exit the stack to the necessary part of the code.
There are still calls to the dialogues, but with them there will be exactly the same kitchen. All this is detected without much time.
Therefore, make the first conclusion in your notebook:
Calling a message about unsuccessful verification of the code, immediately after this check, is a sign of a bad tone.
Well, well - here we were hacked, and having made just a change in one single byte of the application. Now our funny picture is available to everyone absolutely free.
Sad but not critical - we will fight ...
Hacking occurred through direct editing of the application body.
So the task has grown: to ensure the integrity of the source code.
It sounds menacing, but in reality it is practically impossible to do :)
Here is what we can apply for this test?
There are many clever words: hang a digital signature, verify with the image of the file on the disk, check the code section with the checksum. Everything is empty - in the end, we still need to somehow get the current value of the application code in memory ...
Well, well: we look at a digital signature. She, firstly, paid. Secondly, it is checked by calling the API of the WinVerifyTrust function, which is vulnerable to interception. In the third, it is easily removed by regular means through ImageRemoveCertificate.
So it's not an option that we have to check the image of the file on disk?
Here, too, everything is sad. See, we patch our executable file, we want to determine this by comparing it with the image on the disk and what we are doing - we get the path to the current file through the same ParamStr (0) (let's say) and then open the file along this path and start the check, but ...
But at the stage of calling OpenFile / CreateFile, the hacker replaces the path in the corresponding parameter with the path to the original, unmodified image and all our checks go through the forest.
There is another interesting point. But your application can be stored on a disk and in an unchanged form. There is such a thing as loaders. Their essence is that they start the process and modify the application body directly in memory.
For example, let's take our debugger from the previous article and use it to launch our application with a magic picture, and when we reach the entry point, execute the following code:
The application on the disk will remain unchanged, but instead of the JE instruction, the direct transition will be performed due to the recorded JMP instruction. Which is much more sad, because in this case, the first two options for checking integrity are guaranteed not to work.
There is a third option, checking the code sections directly in the application body.
This is a resource-intensive variant and also does not always lead to success for the following reasons.
First constants of checksums. If they are stored in the body of the application, the hacker will change them to the correct ones. (the second conclusion in your notebook is the constants of the CRC blocks of code in the application, there is a bad form).
Secondly, in the second part of the article I talked about MBP - Memory Breakpoint. This is an ideal mechanism for detecting code integrity checks (if you do not take into account the more competent HBP - Hardware BreakPoint).
It works simply - if there is a suspicion that the current code segment is controlled by the protection mechanism, the MBP or NVR is hung on it in order to determine exactly where the code integrity check is located.
If such a check is detected, it is also disabled by the patch.
Well, we actually arrived at a stalemate: the subscriber is not a subscriber :)
However…
Get out, of course you can, but ...
But first, let's see how to implement the integrity check of the application code.
More specifically, we want to protect the code that was at the very beginning from being modified. To do this, we need to somehow find out its location in memory while the application is running.
Tags our "everything".
On the basis of tags, most of the mounted protectors work, so why should we invent another bike. What is a label - in principle, it is so unloved by all the label used in goto (), about which only the laziest did not express their highly qualified "FI".
But ... what is their opinion to us? As I said, our tags are all :)
The truth is, there is a nuance, the label is convenient to use when controlling a small part of the code inside the procedure (with cross-control - about it later), now we are interested in several procedures in the aggregate.
For this label will not work, but empty procedures are quite suitable as labels, the address of which we can get from the integrity check code.
Well, the whole procedure of calculating integrity is needed up to the heap, as well (which was actually one of the nuances voiced above) is a certain constant, with which we will check the CRC of the data block.
Well, but enough to rant, we write:
What we have here:
Two labels in the form of empty procedures CheckedCodeBegin and CheckedCodeEnd, the calculation of the "checksum" of data between these two labels, performed by the CheckCodeProtect procedure, and the checksum itself, taken out for the area of the code being checked and represented by the CheckedCodeValidCheckSum constant (do not pay attention to its value).
In principle, nothing complicated at all, but let's analyze it, but what does this even give us?
In fact, a lot, because:
Yes, yes, this is the Breakpoint set by the debugger. And this code also detects it perfectly, because if you remember, the mechanism for installing BP is to modify the application body.
Here is the third note in your notepad - BP detection is performed by checking the body of the code.
True, unfortunately it is not so simple, in some cases this code will not work, but let's not hurry, we will get to that.
Now to the sad, as I said, this check is easily detected. For example, here is a screenshot from under the debugger, where it is interrupted immediately at the beginning of the test:
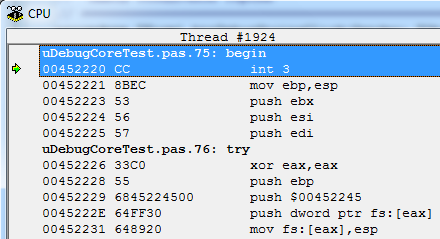
The asmcode of the checksum calculation procedure is highlighted in blue, the debugger was interrupted at the address 0x467069, just at the first attempt to read the protected area.
Well, more precisely, here I was cheating a little, if the verification code were outside the scope of the area being checked, then the stop would occur on this instruction, and so, of course, I stopped at the very first “PUSH EBX”.
But this is the lyrics, the question is different, and what to do now?
Well, firstly, it's not so scary. Only one single check of the integrity of the application code is implemented here. Yes, it is easily detected. Yes, it is also easily removed by the patch, but what prevents us from making several of them, cross-controlling each other? Will they be removed? Well, no question, add more, and what should we do?
Once I was sent a product to analyze the protection of the application directly by the developers of the protection itself (sorry - no names). After a quick scan of the VM initialization code, I almost immediately set the path to parse it, all I needed to do was pull out the crypt algorithm of small data blocks when calling a specific API function. The problem was that as soon as I patched the only byte of the application, the checksum verification mechanism worked. Naturally, I quickly snored it, but as it turned out, four different algorithms controlled the already stuffed code. I started to patch them and what do you think? For each patch, newer and newer pieces of code were understood to control the integrity of the code as an avalanche. As a result, I just drowned in the volume of manual patches and had to write an automatic utility / debugger, which took almost a week of work, taking into account all the nuances. And at the end I rested at the next level of the core of protection.
However, this is no longer important, the meaning is important - if desired, it is possible to implement a decent headache for a cracker, even on a banal check of checksums.
Well, now to reality.
The hacker used MBP to detect the integrity check code.
And now we remember how they work - correctly through the assignment of the page attribute PAGE_GUARD. So, knowing the principles of the debugger, we can prevent this, simply remove this attribute and the debugger will stop responding to access to the allegedly controlled memory.
The truth is, there is a nuance, we can do this by calling VirtualProtect, which is vulnerable, because the debugger can intercept it and deny its call. But we have a reverse thread bolt for this, for example, you can do what is described in this article: read .
True, let's do this, I will not consider the option of removing PAGE_GUARD in the demo application. But do not worry, I will show another interesting way, but for this you need to consider a few more nuances, so a little later.
Well, from now on, we believe that the application integrity control code is written in such a way that it cannot be cracked (in order to simplify) ...
Well, now we have come to the conclusion that they want our form with a picture, and with the help of a debugger. Of course, you need to learn how to detect it. For now, let's focus on the IsDebuggerPresent function, this is enough for a start.
Write the code:
It's very simple, if we are under the debugger, this function will return True.
We assume that the code for checking the integrity of the application is so complicated in us that it cannot be patched and the challenge of this function is placed in a protected area.
What would a hacker use in this case?
There are only three options, taking into account the fact that the application body cannot be patched:
It is difficult to fight the third option (it is possible, but not necessary), but we’ll look at the first two in more detail; in the first, the application code patch is also produced when installing the BP with the 0xSS opcode.
To begin with, let's add this code in the application being debugged to the FormCreate procedure:
It will show the first 4 bytes of the IsDebuggerPresent function.
You cannot write such code here:
For in the second version, we use a static function, and the address will indicate not the beginning of the function body, but the import table, where the adapter is in the form of JMP.
Run the code and remember the value.
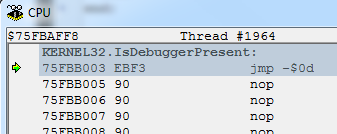
Under each system, it will be different, in XP, for example, it will be the body of the original function, in the seven there will be an adapter to an analogue of the kernelbase. I got the value 9090F3EB, which corresponds to the following picture:
And now let's take our debugger from the second part of the article, and in the OnBreakPoint method, we will patch the body of this function with this code:
Here the nuance, the address of the library kernel32.dll is the same for all applications, so the address of the IsDebuggerPresent function will be the same in the debugger and in the application being debugged.
The meaning of the patch is to nab the EAX register, through which the result of the function is returned and the return to the code that calls the function.
We start the debugger, it will launch our application and as a result of interfering with the process memory, the code in the FormCreate function will not detect the debugger. True, now the code that reads the first 4 bytes of this function will not return us the number 9090F3EB, but the number 90C3C031, which corresponds to the opcodes of the patch.
How can we determine that the body of this function is patched? In principle, we can read the first 4 bytes of this function from the kernel32.dll file located on the disk, but in this case, when opening the library body, we can be replaced by the path to the same patched file and the check will say that everything is fine.
But there is another way, rarely used in practice (I have met, if I am not mistaken, only 1 time) and it consists of the following.
Since we cannot read the correct value from the disk, we can get it by reading the 4 bytes we need from the memory of some other process.Of course, there is a small chance that this process is also under the debugger, and in this way the required function is intercepted in the same way, but very small.
As a result, we write the following code:
TlHelp32 , .
— API , , , .
, , IsDebuggerPresent kernel32.dll kernelbase.dll, , .
. , , .
, , , ?
, , , .
, , CheckIsDebugerPresent, -, . DebugActiveProcess, DbgUiRemoteBreakin. .
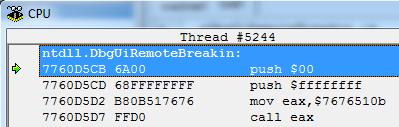
We will patch ourselves, or rather the body of the DbgUiRemoteBreakin function, adding to its beginning the transition to the address of the TerminateProcess function, so that as soon as the debugger is connected to the process, the process will immediately end.
We write the next block of code:
DbgUiRemoteBreakin :
TerminateProcess ( ), uExitCode hProcess, DWORD(-1) . EAX TerminateProcess .
, — CREATE_PROCESS_DEBUG_EVENT, , , ..
.
Unfortunately, this is not an armor-piercing option, because nothing will prevent re-patch the body of our application, returning the original code back before calling DebugActiveProcess. (True, I have not seen this, but still ...)
As I have already said, it is possible to determine the presence of mvr by checking the protection attribute of the page PAGE_GUARD. This is done by calling the VirtualQuery function, or you can simply reassign attributes to the forehead by calling VirtualProtect.
ReadProcessMemory. , . , PAGE_GUARD , , EXCEPTION_GUARD_PAGE . « ». , . , , Hardware Breakpoint , / .
CalcCheckSum :
, , .
, , .
, , , .
. :
I will skip the secondary handlers, they can be viewed in the source code of the example, in principle there is nothing new, everything has already been described in the last part of the article.
Our first task is to somehow disable the detection of the debugger by the application. Since the application checks the integrity of IsDebuggerPresent, and the patch check cannot (according to the condition of the problem) we have only one option left - to change the value of the Peb.BeingDebugged parameter.
Let's do this with the following code:
Everything is simple here, we get the address of the environment block of the process, change the BeingDebugged parameter and write everything back. Therefore, the IsDebuggerPresent function stops responding to the debugger. The declaration of the structures used can be viewed in the source code of the de-example.
The first stage was completed, now the second is to somehow force the application not to react to the incorrectly entered code and show us the picture in any case.
Let's do this:
( ). - . JE, if value then..else, , .. value : then else.
JE , ZF. . JE .
JE, .. , . . crackme.exe, - , , . 0467840.
:
:
Well, that's all, you can run, enter any left value and enjoy the picture.
The result will be something like this:
So it usually happens, you think that you wrote armor-piercing protection, and then once it costs on your knee, well, not always of course, but it happens :)
, , , . , .
, GetThreadContext DR7 ( — ), , API , .
, _except_handler.
By the way an interesting moment. Pay attention to how much information comes to the exception handler. All this information is not available to us in the except handler, which is why I so often call try..finally..except a wrapper around SEH :)
Now you know several ways to deal with the debugger, but now you know how to counter them, but she and the article, so that you draw conclusions.
You can pick up the source code with examples from this link: http://rouse.drkb.ru/blog/dbg_part3.zip
And on this one can consider my task accomplished.
Everything that I wanted to tell about a debugger, I told. Initially, the truth was planned only one article, but you can see how much material finally came out :)
In the future I will talk about using the debugger, but it will be a completely different story.
© Alexander (Rouse_) Bagel
Moscow, November 2012
Immediately make a reservation, in the confrontation application / debugger, the latter will always win :)
But, only if they are used by a competent specialist, and it is practically useless to fight such specialists (well, unless of course you have at least the same qualifications).
However, as practice shows, competent specialists do not engage in uninteresting tasks for them, leaving them at the mercy of novice reversers who have not yet bitten through their granite of science and can stumble upon some not obvious tricks.
')
This is something we will consider, only in a very simplified form.
Simplest ShareWare:
Imagine we have some software that we decided to sell. For simplicity, let it be an ordinary VCL application from an empty form (well, well, if not empty, but with a picture for the whole face) and we want to sell it. The first question that needs to be concerned is how to make our picture visible only to those who paid for it? More precisely - how to distinguish between trial and legal users?
The most obvious solution is the key. A trial user does not know him, and a legal user who has paid for it with real money can activate a legal copy of the application and enjoy the picture.
The key is so key.
We create a new VCL application, throw a TImage on the form with a picture, we set Visible to False. After that we place two TEdit on the form, the first for the username and the second for the activation code. Well, two buttons - close the application and activate.
Somehow like this:
After that, we write a "completely secret" activation code:
function TForm1.GenerateSerial(const AppUserName: string): string; const MagicSerialMask: int64 = $C5315E6121543992; var I: Integer; SN: int64; RawSN: string; begin SN := 0; Result := ''; for I := 1 to Length(AppUserName) do begin Inc(SN, Word(AppUserName[I])); SN := SN * 123456; end; Sn := SN xor MagicSerialMask; RawSN := IntToHex(SN, 16); for I := 1 to 16 do if ((I - 1) mod 4 = 0) and (I > 1) then Result := Result + '-' + RawSN[I] else Result := Result + RawSN[I]; end; procedure TForm1.btnCheckSerialClick(Sender: TObject); begin if edSerial.Text <> GenerateSerial(edAppUserName.Text) then Application.MessageBox(' ', PChar(Application.Title), MB_OK or MB_ICONERROR) else begin Image1.Visible := True; Label1.Visible := False; Label2.Visible := False; Label3.Visible := False; edAppUserName.Visible := False; edSerial.Visible := False; btnCancel.Visible := False; btnCheckSerial.Visible := False; end; end; The essence of the code is as follows:
based on the username, the application generates a serial number and compares it with the entered user. If everything is normal, then all the controls responsible for activation are removed and the picture is displayed, which the user was eager to see.
Suppose this:
(well ... the first thing I found :)
After the manipulations made, “this” is published on various globular websites and sometimes even references are made to the programming forums in the topics like: “test plz protection”.
And what does this look like from a hacker?
He takes a debugger (for simplicity, let's take the same Olly Debug) and sees this picture:
He doesn’t have an application code, but there is a characteristic mistake of novice “defenders” of the software - the conclusion of a dialogue about the wrong key.
What does it give a cracker?
He puts the BP on the call to MessageBoxA and running the application catches the call for this message, after which, by clicking on the “OK” button, he can return to the code in which the error is called, where, looking a little higher, he can determine the presence of a conditional transition, based on which is the challenge:
In the picture, the program's decision point is highlighted with exclamation marks.
All that is left for him to do is fix the JE instruction on the JMP, thus disabling the check of the serial code and ensuring a valid transition to the area of code that should be executed only when the application is activated.
Somehow it is not clear, right?
Well then, here's a picture for you from the Delphi debugger:
Here, the code is more understandable for debugging, and its reading is more convenient due to the unwinding of addresses and bringing them into a readable form. For example, it is now clearly visible that before going to the address 0x475729, at which the decision is made, the text from the TEdits is received and the GenerateSerial procedure is called.
The hacker does not possess such information, and as can be seen in the previous image, he will have to analyze all the challenges in order to create a more or less comprehensible image for the analysis. Well, the truth is, I’m exaggerating a bit here, in fact, the application map is built quite simply, with the availability of tools, but ... But some people sometimes try hard to debug the system modules of the delphi, and I’m honored and praised for their persistence :)
Well, the nuance, at the address 0x475729 on the screen, there are two different instructions - JZ and JE, these are the nuances of the interpretation of disassemblers, they are identical.
There is one interesting approach that I voiced several times.
Here, a little higher, I announced that I would put BP on MessageBoxA, but they tell me that they will call MessageBoxW and will not be able to catch the call. This is an application for a solid four-plus, for yes, indeed, if the application calls the Unicode API, there will be a slight miss with the bounce, but there is a nuance. And let's deploy the entire MessageBox call stack.
See what interesting scheme is obtained:
MessageBoxA -> MessageBoxExA -> MessageBoxTimeOutA -> MessageBoxTimeOutW-> SoftModalMessageBox ()
So yes, we can put BP on calling any of the listed functions (usually enough MessageBoxTimeOutW) to catch the call we need, by the way, the MessageBoxW function will also call it.
There is a true little nuance, in Delphi there are other ways to display a window.
Well, for example ShowMessage (). This method does not call the MessageBox API.
It is fun enough to listen to the reasoning that this method is fully implemented as a separate form in which the buttons are placed as they need and in general are the insides of the VCL itself, of which nothing is clear in the debugger.
So it is so, if the given call did not rest on the ShowWindow API, from which we will also exit the stack to the necessary part of the code.
There are still calls to the dialogues, but with them there will be exactly the same kitchen. All this is detected without much time.
Therefore, make the first conclusion in your notebook:
Calling a message about unsuccessful verification of the code, immediately after this check, is a sign of a bad tone.
Introduce application integrity monitoring:
Well, well - here we were hacked, and having made just a change in one single byte of the application. Now our funny picture is available to everyone absolutely free.
Sad but not critical - we will fight ...
Hacking occurred through direct editing of the application body.
So the task has grown: to ensure the integrity of the source code.
It sounds menacing, but in reality it is practically impossible to do :)
Here is what we can apply for this test?
There are many clever words: hang a digital signature, verify with the image of the file on the disk, check the code section with the checksum. Everything is empty - in the end, we still need to somehow get the current value of the application code in memory ...
Well, well: we look at a digital signature. She, firstly, paid. Secondly, it is checked by calling the API of the WinVerifyTrust function, which is vulnerable to interception. In the third, it is easily removed by regular means through ImageRemoveCertificate.
So it's not an option that we have to check the image of the file on disk?
Here, too, everything is sad. See, we patch our executable file, we want to determine this by comparing it with the image on the disk and what we are doing - we get the path to the current file through the same ParamStr (0) (let's say) and then open the file along this path and start the check, but ...
But at the stage of calling OpenFile / CreateFile, the hacker replaces the path in the corresponding parameter with the path to the original, unmodified image and all our checks go through the forest.
There is another interesting point. But your application can be stored on a disk and in an unchanged form. There is such a thing as loaders. Their essence is that they start the process and modify the application body directly in memory.
For example, let's take our debugger from the previous article and use it to launch our application with a magic picture, and when we reach the entry point, execute the following code:
procedure TTestDebugger.OnBreakPoint(Sender: TObject; ThreadIndex: Integer; ExceptionRecord: Windows.TExceptionRecord; BreakPointIndex: Integer; var ReleaseBreakpoint: Boolean); var JmpOpcode: Byte; begin if ExceptionRecord.ExceptionAddress = Pointer(FCore.DebugProcessData.EntryPoint) then begin JmpOpcode := $EB; FCore.WriteData(Pointer($475729), @JmpOpcode, 1); The application on the disk will remain unchanged, but instead of the JE instruction, the direct transition will be performed due to the recorded JMP instruction. Which is much more sad, because in this case, the first two options for checking integrity are guaranteed not to work.
There is a third option, checking the code sections directly in the application body.
This is a resource-intensive variant and also does not always lead to success for the following reasons.
First constants of checksums. If they are stored in the body of the application, the hacker will change them to the correct ones. (the second conclusion in your notebook is the constants of the CRC blocks of code in the application, there is a bad form).
Secondly, in the second part of the article I talked about MBP - Memory Breakpoint. This is an ideal mechanism for detecting code integrity checks (if you do not take into account the more competent HBP - Hardware BreakPoint).
It works simply - if there is a suspicion that the current code segment is controlled by the protection mechanism, the MBP or NVR is hung on it in order to determine exactly where the code integrity check is located.
If such a check is detected, it is also disabled by the patch.
Well, we actually arrived at a stalemate: the subscriber is not a subscriber :)
However…
Get out, of course you can, but ...
But first, let's see how to implement the integrity check of the application code.
More specifically, we want to protect the code that was at the very beginning from being modified. To do this, we need to somehow find out its location in memory while the application is running.
Tags our "everything".
On the basis of tags, most of the mounted protectors work, so why should we invent another bike. What is a label - in principle, it is so unloved by all the label used in goto (), about which only the laziest did not express their highly qualified "FI".
But ... what is their opinion to us? As I said, our tags are all :)
The truth is, there is a nuance, the label is convenient to use when controlling a small part of the code inside the procedure (with cross-control - about it later), now we are interested in several procedures in the aggregate.
For this label will not work, but empty procedures are quite suitable as labels, the address of which we can get from the integrity check code.
Well, the whole procedure of calculating integrity is needed up to the heap, as well (which was actually one of the nuances voiced above) is a certain constant, with which we will check the CRC of the data block.
Well, but enough to rant, we write:
const CheckedCodeValidCheckSum: DWORD = 248268; // << procedure CheckedCodeBegin; begin end; function TForm1.CalcCheckSum(Addr: Pointer; Size: Integer): DWORD; var pCursor: PByte; I: Integer; Dumee: DWORD; begin Result := 0; pCursor := Addr; for I := 0 to Size - 1 do begin if pCursor^ <> 0 then Inc(Result, pCursor^) else Dec(Result); Inc(pCursor); end; end; procedure TForm1.CheckCodeProtect; var CheckedCodeBeginAddr, CheckedCodeEndAddr: Pointer; CurrentCheckSum: DWORD; begin // CheckedCodeBeginAddr := @CheckedCodeBegin; // CheckedCodeEndAddr := @CheckedCodeEnd; // CurrentCheckSum := CalcCheckSum(CheckedCodeBeginAddr, Integer(CheckedCodeEndAddr) - Integer(CheckedCodeBeginAddr)); if CurrentCheckSum <> CheckedCodeValidCheckSum then begin MessageBox(Handle, ' .', PChar(Application.Title), MB_ICONERROR); TerminateProcess(GetCurrentProcess, 0); end; end; function TForm1.GenerateSerial(const AppUserName: string): string; const MagicSerialMask: int64 = $C5315E6121543992; var I: Integer; SN: int64; RawSN: string; begin SN := 0; Result := ''; for I := 1 to Length(AppUserName) do begin Inc(SN, Word(AppUserName[I])); SN := SN * 123456; end; Sn := SN xor MagicSerialMask; RawSN := IntToHex(SN, 16); for I := 1 to 16 do if ((I - 1) mod 4 = 0) and (I > 1) then Result := Result + '-' + RawSN[I] else Result := Result + RawSN[I]; end; procedure TForm1.btnCheckSerialClick(Sender: TObject); begin // CheckCodeProtect; if edSerial.Text <> GenerateSerial(edAppUserName.Text) then ShowMessage(' ') else begin Image1.Visible := True; Label1.Visible := False; Label2.Visible := False; Label3.Visible := False; edAppUserName.Visible := False; edSerial.Visible := False; btnCancel.Visible := False; btnCheckSerial.Visible := False; end; end; procedure CheckedCodeEnd; begin end; What we have here:
Two labels in the form of empty procedures CheckedCodeBegin and CheckedCodeEnd, the calculation of the "checksum" of data between these two labels, performed by the CheckCodeProtect procedure, and the checksum itself, taken out for the area of the code being checked and represented by the CheckedCodeValidCheckSum constant (do not pay attention to its value).
In principle, nothing complicated at all, but let's analyze it, but what does this even give us?
In fact, a lot, because:
- This code detects the patch of the application body on the disk (because at startup it will already be with modified bytes).
- This code detects the application body patch by the loader (as described above).
- And this code detects ... remember the picture from the previous article?
Yes, yes, this is the Breakpoint set by the debugger. And this code also detects it perfectly, because if you remember, the mechanism for installing BP is to modify the application body.
Here is the third note in your notepad - BP detection is performed by checking the body of the code.
True, unfortunately it is not so simple, in some cases this code will not work, but let's not hurry, we will get to that.
Now to the sad, as I said, this check is easily detected. For example, here is a screenshot from under the debugger, where it is interrupted immediately at the beginning of the test:
The asmcode of the checksum calculation procedure is highlighted in blue, the debugger was interrupted at the address 0x467069, just at the first attempt to read the protected area.
Well, more precisely, here I was cheating a little, if the verification code were outside the scope of the area being checked, then the stop would occur on this instruction, and so, of course, I stopped at the very first “PUSH EBX”.
But this is the lyrics, the question is different, and what to do now?
Well, firstly, it's not so scary. Only one single check of the integrity of the application code is implemented here. Yes, it is easily detected. Yes, it is also easily removed by the patch, but what prevents us from making several of them, cross-controlling each other? Will they be removed? Well, no question, add more, and what should we do?
Once I was sent a product to analyze the protection of the application directly by the developers of the protection itself (sorry - no names). After a quick scan of the VM initialization code, I almost immediately set the path to parse it, all I needed to do was pull out the crypt algorithm of small data blocks when calling a specific API function. The problem was that as soon as I patched the only byte of the application, the checksum verification mechanism worked. Naturally, I quickly snored it, but as it turned out, four different algorithms controlled the already stuffed code. I started to patch them and what do you think? For each patch, newer and newer pieces of code were understood to control the integrity of the code as an avalanche. As a result, I just drowned in the volume of manual patches and had to write an automatic utility / debugger, which took almost a week of work, taking into account all the nuances. And at the end I rested at the next level of the core of protection.
However, this is no longer important, the meaning is important - if desired, it is possible to implement a decent headache for a cracker, even on a banal check of checksums.
Well, now to reality.
The hacker used MBP to detect the integrity check code.
And now we remember how they work - correctly through the assignment of the page attribute PAGE_GUARD. So, knowing the principles of the debugger, we can prevent this, simply remove this attribute and the debugger will stop responding to access to the allegedly controlled memory.
The truth is, there is a nuance, we can do this by calling VirtualProtect, which is vulnerable, because the debugger can intercept it and deny its call. But we have a reverse thread bolt for this, for example, you can do what is described in this article: read .
True, let's do this, I will not consider the option of removing PAGE_GUARD in the demo application. But do not worry, I will show another interesting way, but for this you need to consider a few more nuances, so a little later.
Well, from now on, we believe that the application integrity control code is written in such a way that it cannot be cracked (in order to simplify) ...
Debugger detection
Well, now we have come to the conclusion that they want our form with a picture, and with the help of a debugger. Of course, you need to learn how to detect it. For now, let's focus on the IsDebuggerPresent function, this is enough for a start.
Write the code:
function IsDebuggerPresent: BOOL; stdcall; external kernel32; procedure TForm1.FormCreate(Sender: TObject); begin if IsDebuggerPresent then begin MessageBox(Handle, ' .', PChar(Application.Title), MB_ICONERROR); TerminateProcess(GetCurrentProcess, 0); end; end; It's very simple, if we are under the debugger, this function will return True.
We assume that the code for checking the integrity of the application is so complicated in us that it cannot be patched and the challenge of this function is placed in a protected area.
What would a hacker use in this case?
There are only three options, taking into account the fact that the application body cannot be patched:
- put BP on the call to this function, where to replace the result of its call.
- patch the code of this function so that it always returns False
- change the Peb.BeingDebugged variable in the address space of the process being debugged.
It is difficult to fight the third option (it is possible, but not necessary), but we’ll look at the first two in more detail; in the first, the application code patch is also produced when installing the BP with the 0xSS opcode.
To begin with, let's add this code in the application being debugged to the FormCreate procedure:
procedure TForm1.FormCreate(Sender: TObject); var P: PCardinal; begin P := GetProcAddress(GetModuleHandle(kernel32), 'IsDebuggerPresent'); ShowMessage(IntToHex(P^, 8)); It will show the first 4 bytes of the IsDebuggerPresent function.
You cannot write such code here:
function IsDebuggerPresent: BOOL; stdcall; external kernel32; procedure TForm1.FormCreate(Sender: TObject); var P: PCardinal; begin P := @IsDebuggerPresent; ShowMessage(IntToHex(P^, 8)); For in the second version, we use a static function, and the address will indicate not the beginning of the function body, but the import table, where the adapter is in the form of JMP.
Run the code and remember the value.
Under each system, it will be different, in XP, for example, it will be the body of the original function, in the seven there will be an adapter to an analogue of the kernelbase. I got the value 9090F3EB, which corresponds to the following picture:
And now let's take our debugger from the second part of the article, and in the OnBreakPoint method, we will patch the body of this function with this code:
procedure TTestDebugger.HideDebugger; const PachBuff: array [0..2] of Byte = ( $31, $C0, // xor eax, eax $C3 // ret ); var Addr: Pointer; begin Addr := GetProcAddress(GetModuleHandle(kernel32), 'IsDebuggerPresent'); FCore.WriteData(Addr, @PachBuff[0], 3); end; procedure TTestDebugger.OnBreakPoint(Sender: TObject; ThreadIndex: Integer; ExceptionRecord: Windows.TExceptionRecord; BreakPointIndex: Integer; var ReleaseBreakpoint: Boolean); var JmpOpcode: Byte; begin if ExceptionRecord.ExceptionAddress = Pointer(FCore.DebugProcessData.EntryPoint) then begin HideDebugger; Here the nuance, the address of the library kernel32.dll is the same for all applications, so the address of the IsDebuggerPresent function will be the same in the debugger and in the application being debugged.
The meaning of the patch is to nab the EAX register, through which the result of the function is returned and the return to the code that calls the function.
We start the debugger, it will launch our application and as a result of interfering with the process memory, the code in the FormCreate function will not detect the debugger. True, now the code that reads the first 4 bytes of this function will not return us the number 9090F3EB, but the number 90C3C031, which corresponds to the opcodes of the patch.
How can we determine that the body of this function is patched? In principle, we can read the first 4 bytes of this function from the kernel32.dll file located on the disk, but in this case, when opening the library body, we can be replaced by the path to the same patched file and the check will say that everything is fine.
But there is another way, rarely used in practice (I have met, if I am not mistaken, only 1 time) and it consists of the following.
Since we cannot read the correct value from the disk, we can get it by reading the 4 bytes we need from the memory of some other process.Of course, there is a small chance that this process is also under the debugger, and in this way the required function is intercepted in the same way, but very small.
As a result, we write the following code:
function IsDebuggerPresent: BOOL; stdcall; external kernel32; procedure TForm1.CheckIsDebugerPresent; var Snapshot: THandle; ProcessEntry: TProcessEntry32; ProcessHandle: THandle; pIsDebuggerPresent: PDWORD; OriginalBytes: DWORD; lpNumberOfBytesRead: DWORD; begin pIsDebuggerPresent := GetProcAddress(GetModuleHandle(kernel32), 'IsDebuggerPresent'); Snapshot := CreateToolhelp32Snapshot(TH32CS_SNAPPROCESS, 0); if Snapshot <> INVALID_HANDLE_VALUE then try ProcessEntry.dwSize := SizeOf(TProcessEntry32); if Process32First(Snapshot, ProcessEntry) then begin repeat if ProcessEntry.th32ProcessID = GetCurrentProcessId then Continue; ProcessHandle := OpenProcess(PROCESS_ALL_ACCESS, False, ProcessEntry.th32ProcessID); if ProcessHandle <> 0 then try if ReadProcessMemory(ProcessHandle, pIsDebuggerPresent, @OriginalBytes, 4, lpNumberOfBytesRead) then begin if OriginalBytes <> pIsDebuggerPresent^ then begin MessageBox(Handle, ' IsDebuggerPresent .', PChar(Application.Title), MB_ICONERROR); TerminateProcess(GetCurrentProcess, 0); end; if IsDebuggerPresent then begin MessageBox(Handle, ' .', PChar(Application.Title), MB_ICONERROR); TerminateProcess(GetCurrentProcess, 0); end; end; finally CloseHandle(ProcessHandle); end; until not Process32Next(Snapshot, ProcessEntry) end; finally CloseHandle(Snapshot); end; end; procedure TForm1.FormCreate(Sender: TObject); begin CheckIsDebugerPresent; CheckCodeProtect; end; TlHelp32 , .
— API , , , .
, , IsDebuggerPresent kernel32.dll kernelbase.dll, , .
. , , .
.
, , , ?
, , , .
, , CheckIsDebugerPresent, -, . DebugActiveProcess, DbgUiRemoteBreakin. .
We will patch ourselves, or rather the body of the DbgUiRemoteBreakin function, adding to its beginning the transition to the address of the TerminateProcess function, so that as soon as the debugger is connected to the process, the process will immediately end.
We write the next block of code:
type TDbgUiRemoteBreakinPath = packed record push0: Word; push: Byte; CurrProc: DWORD; moveax: byte; TerminateProcAddr: DWORD; calleax: Word; end; procedure TForm1.BlockDebugActiveProcess; var pDbgUiRemoteBreakin: Pointer; Path: TDbgUiRemoteBreakinPath; OldProtect: DWORD; begin pDbgUiRemoteBreakin := GetProcAddress(GetModuleHandle('ntdll.dll'), 'DbgUiRemoteBreakin'); if pDbgUiRemoteBreakin = nil then Exit; Path.push0 := $006A; Path.push := $68; Path.CurrProc := $FFFFFFFF; Path.moveax := $B8; Path.TerminateProcAddr := DWORD(GetProcAddress(GetModuleHandle(kernel32), 'TerminateProcess')); Path.calleax := $D0FF; if VirtualProtect(pDbgUiRemoteBreakin, SizeOf(TDbgUiRemoteBreakinPath), PAGE_READWRITE, OldProtect) then try Move(Path, pDbgUiRemoteBreakin^, SizeOf(TDbgUiRemoteBreakinPath)); finally VirtualProtect(pDbgUiRemoteBreakin, SizeOf(TDbgUiRemoteBreakinPath), OldProtect, OldProtect); end; end; procedure TForm1.FormCreate(Sender: TObject); begin BlockDebugActiveProcess; CheckIsDebugerPresent; CheckCodeProtect; end; DbgUiRemoteBreakin :
TerminateProcess ( ), uExitCode hProcess, DWORD(-1) . EAX TerminateProcess .
, — CREATE_PROCESS_DEBUG_EVENT, , , ..
.
Unfortunately, this is not an armor-piercing option, because nothing will prevent re-patch the body of our application, returning the original code back before calling DebugActiveProcess. (True, I have not seen this, but still ...)
Memory Breakpoint bypass
As I have already said, it is possible to determine the presence of mvr by checking the protection attribute of the page PAGE_GUARD. This is done by calling the VirtualQuery function, or you can simply reassign attributes to the forehead by calling VirtualProtect.
ReadProcessMemory. , . , PAGE_GUARD , , EXCEPTION_GUARD_PAGE . « ». , . , , Hardware Breakpoint , / .
CalcCheckSum :
function TForm1.CalcCheckSum(Addr: Pointer; Size: Integer): DWORD; var pRealData, pCursor: PByte; I: Integer; Dumee: DWORD; begin pRealData := GetMemory(Size); try ReadProcessMemory(GetCurrentProcess, Addr, pRealData, Size, Dumee); Result := 0; pCursor := pRealData; for I := 0 to Size - 1 do begin if pCursor^ <> 0 then Inc(Result, pCursor^) else Dec(Result); Inc(pCursor); end; finally FreeMemory(pRealData); end; end; , , .
?
, , .
, , , .
. :
constructor TTestDebugger.Create(const Path: string); begin FCore := TFWDebugerCore.Create; if not FCore.DebugNewProcess(Path, True) then RaiseLastOSError; FCore.OnCreateProcess := OnCreateProcess; FCore.OnLoadDll := OnLoadDll; FCore.OnDebugString := OnDebugString; FCore.OnBreakPoint := OnBreakPoint; FCore.OnHardwareBreakpoint := OnHardwareBreakpoint; FCore.OnUnknownBreakPoint := OnUnknownBreakPoint; FCore.OnUnknownException := OnUnknownException; end; destructor TTestDebugger.Destroy; begin FCore.Free; inherited; end; I will skip the secondary handlers, they can be viewed in the source code of the example, in principle there is nothing new, everything has already been described in the last part of the article.
Our first task is to somehow disable the detection of the debugger by the application. Since the application checks the integrity of IsDebuggerPresent, and the patch check cannot (according to the condition of the problem) we have only one option left - to change the value of the Peb.BeingDebugged parameter.
Let's do this with the following code:
procedure TTestDebugger.HideDebugger(hProcess: THandle); var pProcBasicInfo: PROCESS_BASIC_INFORMATION; pPeb: PEB; ReturnLength: DWORD; begin if NtQueryInformationProcess(hProcess, 0, @pProcBasicInfo, SizeOf(PROCESS_BASIC_INFORMATION), @ReturnLength) <> STATUS_SUCCESS then RaiseLastOSError; if not ReadProcessMemory(hProcess, pProcBasicInfo.PebBaseAddress, @pPeb, SizeOf(PEB), ReturnLength) then RaiseLastOSError; pPeb.BeingDebugged := False; if not WriteProcessMemory(hProcess, pProcBasicInfo.PebBaseAddress, @pPeb, SizeOf(PEB), ReturnLength) then RaiseLastOSError; end; Everything is simple here, we get the address of the environment block of the process, change the BeingDebugged parameter and write everything back. Therefore, the IsDebuggerPresent function stops responding to the debugger. The declaration of the structures used can be viewed in the source code of the de-example.
The first stage was completed, now the second is to somehow force the application not to react to the incorrectly entered code and show us the picture in any case.
Let's do this:
( ). - . JE, if value then..else, , .. value : then else.
JE , ZF. . JE .
JE, .. , . . crackme.exe, - , , . 0467840.
:
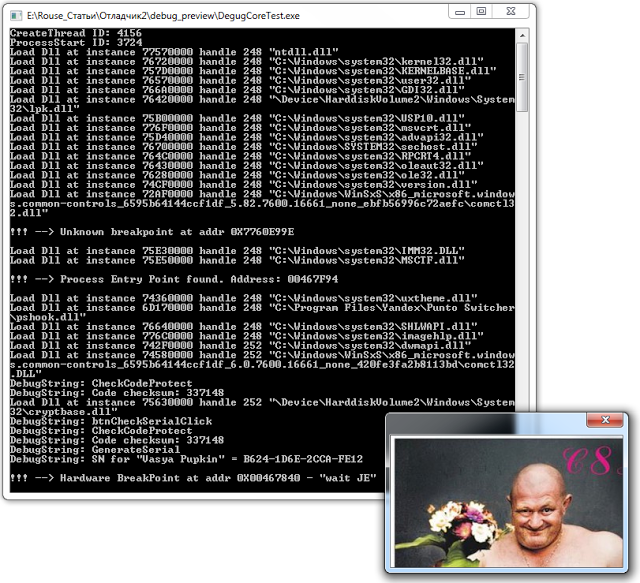
procedure TTestDebugger.OnBreakPoint(Sender: TObject; ThreadIndex: Integer; ExceptionRecord: Windows.TExceptionRecord; BreakPointIndex: Integer; var ReleaseBreakpoint: Boolean); begin if ExceptionRecord.ExceptionAddress = Pointer(FCore.DebugProcessData.EntryPoint) then begin Writeln; Writeln(Format('!!! --> Process Entry Point found. Address: %p', [Pointer(FCore.DebugProcessData.EntryPoint)])); Writeln; HideDebugger(FCore.DebugProcessData.AttachedProcessHandle); FCore.SetHardwareBreakpoint(ThreadIndex, Pointer($467840), hsByte, hmExecute, 0, 'wait JE'); end else begin Writeln; Writeln(Format('!!! --> BreakPoint at addr 0X%p - "%s"', [ExceptionRecord.ExceptionAddress, FCore.BreakpointItem(BreakPointIndex).Description])); Writeln; end; end; :
procedure TTestDebugger.OnHardwareBreakPoint(Sender: TObject; ThreadIndex: Integer; ExceptionRecord: Windows.TExceptionRecord; BreakPointIndex: THWBPIndex; var ReleaseBreakpoint: Boolean); var ThreadData: TThreadData; begin Writeln; ThreadData := FCore.GetThreadData(ThreadIndex); Writeln(Format('!!! --> Hardware BreakPoint at addr 0X%p - "%s"', [ExceptionRecord.ExceptionAddress, ThreadData.Breakpoint.Description[BreakPointIndex]])); FCore.SetFlag(ThreadIndex, EFLAGS_ZF, True); Writeln; end; Well, that's all, you can run, enter any left value and enjoy the picture.
The result will be something like this:
So it usually happens, you think that you wrote armor-piercing protection, and then once it costs on your knee, well, not always of course, but it happens :)
Detect Hardware BreakPoint:
, , , . , .
, GetThreadContext DR7 ( — ), , API , .
procedure TForm1.CheckHardwareBreakPoint; var Context: TContext; begin Context.ContextFlags := CONTEXT_DEBUG_REGISTERS; GetThreadContext(GetCurrentThread, Context); if Context.Dr7 <> 0 then begin MessageBox(Handle, ' HardwareBreaakPoint.', PChar(Application.Title), MB_ICONERROR); TerminateProcess(GetCurrentProcess, 0); end; end; , _except_handler.
type // TSeh = packed record Esp, Ebp, SafeEip: DWORD; end; var seh: TSeh; function _except_handler(ExceptionRecord: PExceptionRecord; EstablisherFrame: Pointer; Context: PContext; DispatcherContext: Pointer): DWORD; cdecl; const ExceptionContinueExecution = 0; begin if Context^.Dr7 <> 0 then begin MessageBox(0, ' HardwareBreaakPoint.', PChar(Application.Title), MB_ICONERROR); TerminateProcess(GetCurrentProcess, 0); end; // Context^.Eip := seh.SafeEip; Context^.Esp := seh.Esp; Context^.Ebp := seh.Ebp; // Result := ExceptionContinueExecution; end; procedure TForm1.CheckHardwareBreakPoint2; asm // SEH push offset _except_handler xor eax, eax push fs:[eax] mov fs:[eax], esp // lea eax, seh mov [eax], esp add eax, 4 mov [eax], ebp add eax, 4 lea ecx, @done mov [eax], ecx // mov eax, [0] @done: // SEH xor eax, eax pop fs:[eax] add esp, 4 end; By the way an interesting moment. Pay attention to how much information comes to the exception handler. All this information is not available to us in the except handler, which is why I so often call try..finally..except a wrapper around SEH :)
Summarizing
Now you know several ways to deal with the debugger, but now you know how to counter them, but she and the article, so that you draw conclusions.
You can pick up the source code with examples from this link: http://rouse.drkb.ru/blog/dbg_part3.zip
And on this one can consider my task accomplished.
Everything that I wanted to tell about a debugger, I told. Initially, the truth was planned only one article, but you can see how much material finally came out :)
In the future I will talk about using the debugger, but it will be a completely different story.
© Alexander (Rouse_) Bagel
Moscow, November 2012
Source: https://habr.com/ru/post/178183/
All Articles