Monitoring mod_security and MySQL using Splunk
Good time of day, habster.
I want to share the implementation of monitoring a virtual server, which I support.
Operating system: CentOS 6.3 x64, however, the described situation is suitable for other platforms, like * Win and * nix.
Formulation of the problem.
The following services are installed on the server: apache2, MySQL, postfix and apache protection based on mod_security is implemented.
The server owner is not satisfied with the ssh connection by the console and reading the logs in a text editor, besides there was no visibility of the server load, the number of requests, the complexity of requests to the server. I suggested Zabbix server, but the client said a definitive "no." Well, well, then, he and the client, to be always right.
It is necessary to quickly find out the current security situation and, based on the event, take steps to eliminate the problem.
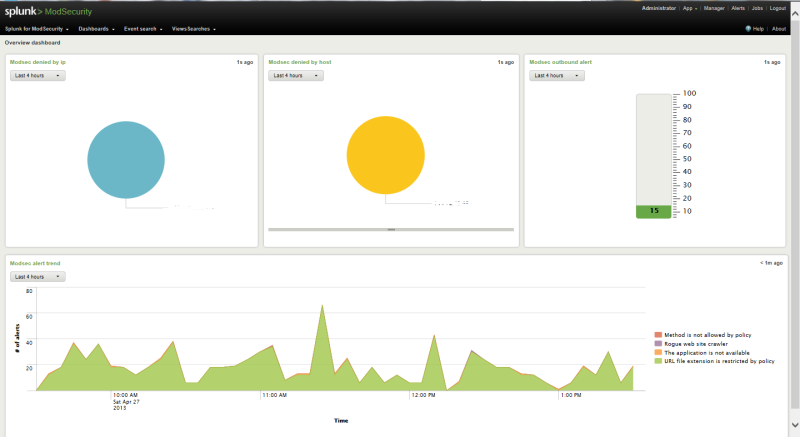
Immediately give a screenshot of what happened:
')
So, googling and asking a question and getting an answer, I tried all the interfaces listed on the official mod_security website, as the complexity increases. It was found that all of them ceased to be supported somewhere in 2008, which did not suit me.
I left Splunk for last, because firstly it is paid, and secondly I have no confidence in universal products for such tasks.
Briefly about the decision:
one). There are paid and free versions;
2). The test period is 60 days, and if the logs passing through the system are less than 500 MB, then you can easily enter into a free license agreement;
3) I was pleased with a bunch of modules, of which I immediately became interested in the module for MySQL.
4) the ability to install both on the server itself, and on any other host network, with connection to various nodes to collect information. That is, the consolidation of the results of several nodes in a single center (for example, on a home server).
Fears that have arisen:
one). Too universal product;
2). The complexity of installing on a "live" server;
3). Splunk security itself.
four). Eternally satisfied people on the main page of the site and a minimum of technical information.
So, it was decided to put. I had to register an account on the site, after that I downloaded the corresponding package for ubuntu (first I tested the http + MySQL + miniDLNA + file bin + qBitTorrent on my home machine). For a long time I will not describe, it all worked. It was decided to put in production.
Step by step we swing:
1. Splunk itself * .rpm.
Put the
We
We read the output. The default port is 8000.
2. Module for mod_security on the link from the office. site. It is written that a completely free module.
3. In addition, the module had dependencies on packages: Visit amMap , Download Maxmind
, Download SideView Utils , Google Maps . We do not mind downloaded.
4. Installing mod_security itself is also quite simple: App-> Manage apps -> Install app from a file.
Installation add. modules are worse; you need to unpack them in the Splunk directory, in the modules folder. I got everything and it worked immediately after the restart splunk
5. Bonus swung MySQL Monitor - a module that is also installed through Manage Apps. However, it runs through another place, separate from Splunk.
Add the launch of Splunk when loading:
The most interesting thing began when setting up, since it says nothing clearly anywhere, the minimum installation guides are given on the pages.
Necessary retreat. Splunk is positioned as a search engine on a certain database (which is stored on the hard disk of the server where it is installed). It can include information from files (Data Inputs), via TCP, UDP, Scripts (apparently transferring data from scripts). In turn, there is the concept of Indexes, which contains ... indices that refer to Data Inputs.
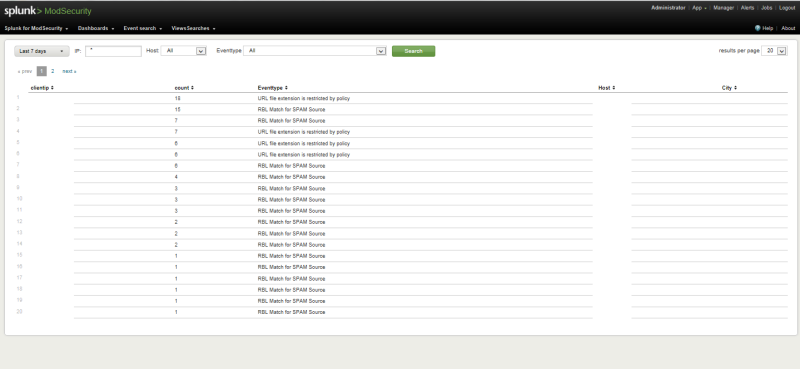
Let us return to the setting of the mod_security information collection module. It turned out that in order for it to start working, it is necessary in the Manager -> Data Inputs section to enter the collection of logs from a file (I have /var/log/httpd/modsec_audit.log), I indicate this:
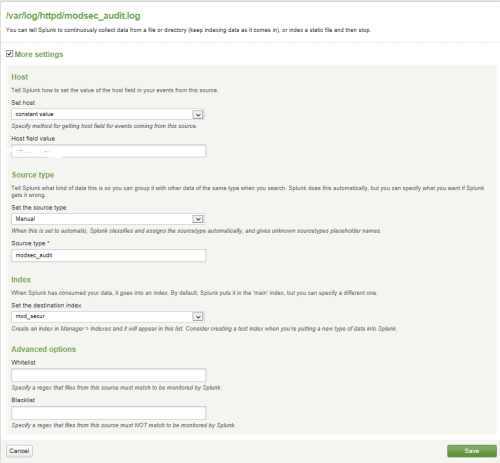
So, created Data Input with the name
Go to Manager -> Indexes and create a mod_secur index that requires you to specify the location of the Splunk database itself in the file system. Put:
When the data input and index are created, go to the module settings, which were not in the module settings of the Modules section. and in Manager -> Advanced Search -> Search Macros.
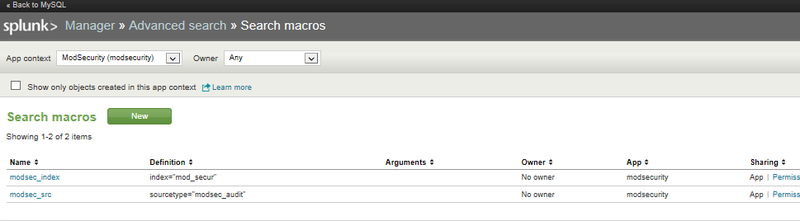
In the upper left part of the window, we make sure that the data belongs to the Mod_security module (otherwise I have been poking there for a long time in a bunch of variables of another module, looking for my variables).
We change modsec_index from "main" to our index "mod_secur", modsec_src do not touch.
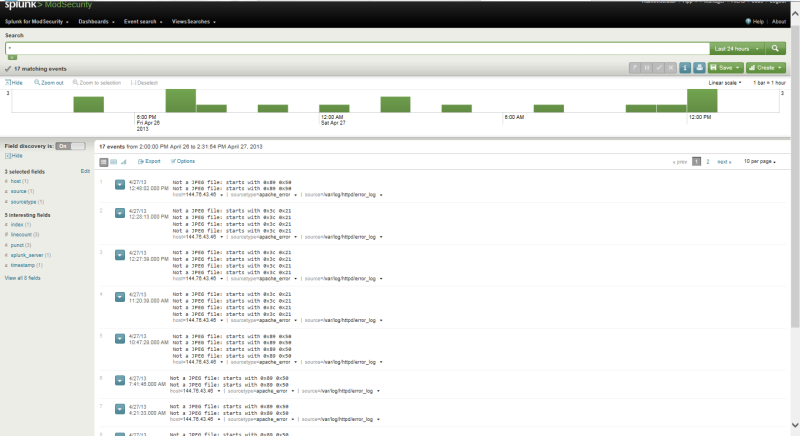
After these manipulations, the system begins to read the logs, and for about a minute for a three-day file it collects information. In the top processes, I didn’t see Splunk at all, resources eats away at least, which pleased me.
Below is a couple of screenshots, and then I will tell you about the MySQL monitor.
Screenshot time
Two screenshot
From myself I will add that the creators of the monitor for mod_security did not take care of important information at all - the conclusion of the enabled and disabled rules by which it works.
Installing the MySQL monitor brought me more brains, at least due to the fact that the design tears my eyes to the depths of the soul.
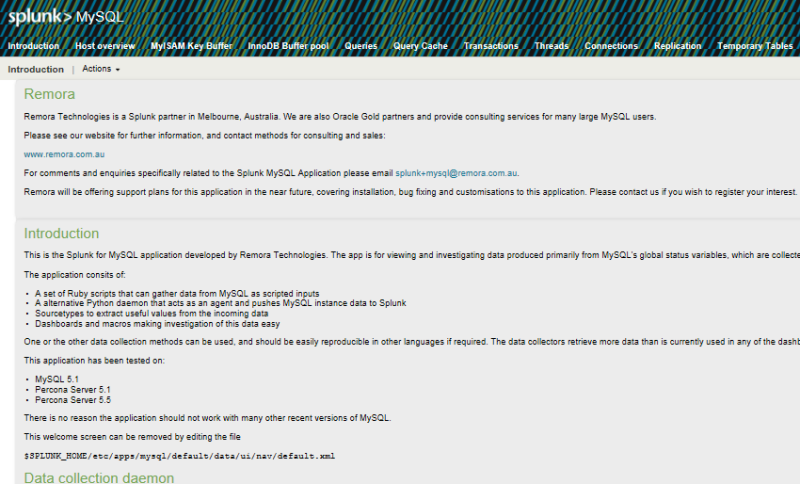
When you open the monitor, we always get to the readme, where I did not find it to reconfigure.
The module consists of the MySQl statistics collection daemon, which also needs to be started.
But first, edit the module configuration file "$ SPLUNK_HOME / etc / apps / mysqlmonitor / bin / daemon / config.ini):
and the file of connected servers $ SPLUNK_HOME / etc / apps / mysqlmonitor / hosts.yaml
And you can start the demon.
Depends on installed in the system
• Python 2.6 or 2.7
• Python MySQL drivers
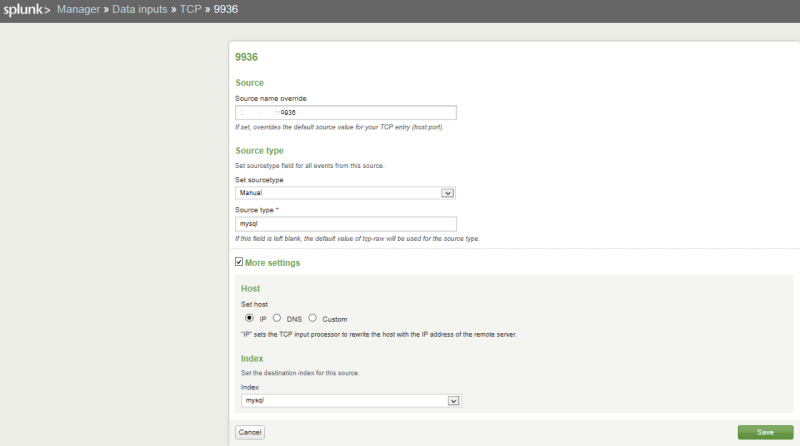
There is a collection of information via TCP socket 9936, which is to be created in Splunk itself: Manager -> Data Inputs -> TCP. We create socket 9936.
Manager -> Indexes -> create a new mysql, a complete analogy with mod_security.
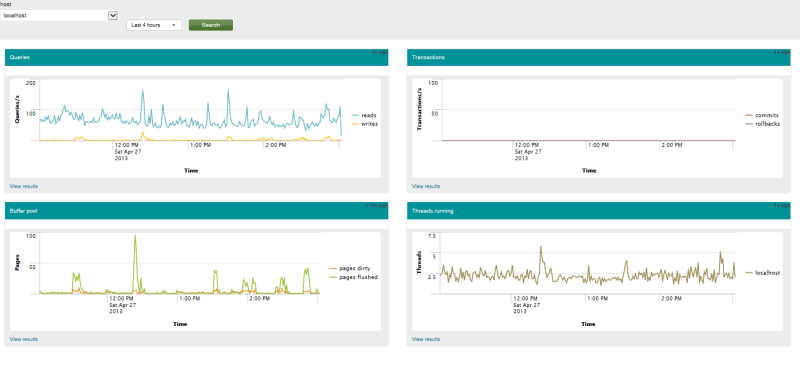
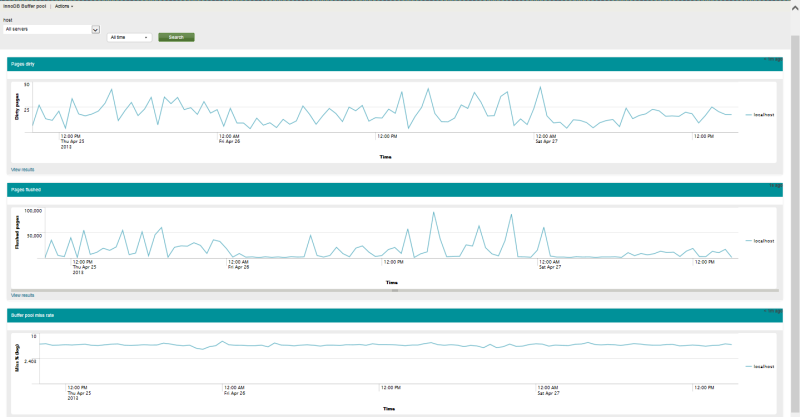
In Manager -> Advanced search -> Search macros we don’t go - there’sn’t anything to change. Everything took off, I bring in screenshots (yes, by the way, the machine does not work, you need to press the search button).
UPD 04.29.2013: I gave birth to such a script, because the demon sometimes falls and stuffed it into crowns (cron) *.
restart does not work if there is a problem with the PID file, so stop + start.
$ SPLUNK_HOME change to the full path to the program.
Time.
Two. It turned out to be a pleasant opportunity on the third chart “slow queries” to click on any part of the chart and see the request itself.
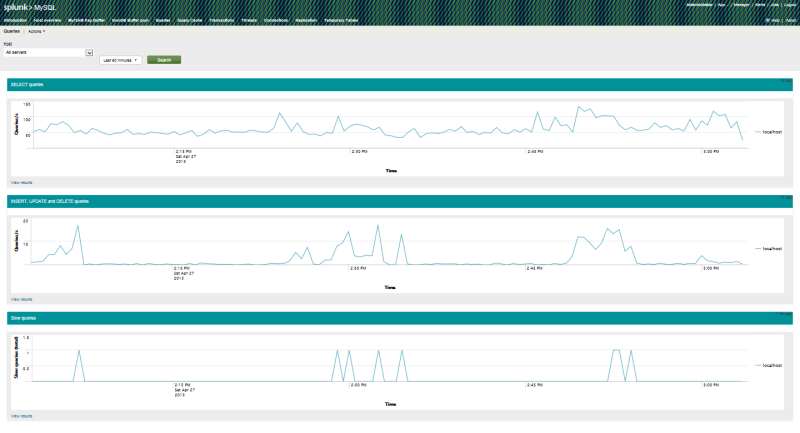
Three.
Thank you all for your attention!
I want to share the implementation of monitoring a virtual server, which I support.
Operating system: CentOS 6.3 x64, however, the described situation is suitable for other platforms, like * Win and * nix.
Formulation of the problem.
The following services are installed on the server: apache2, MySQL, postfix and apache protection based on mod_security is implemented.
The server owner is not satisfied with the ssh connection by the console and reading the logs in a text editor, besides there was no visibility of the server load, the number of requests, the complexity of requests to the server. I suggested Zabbix server, but the client said a definitive "no." Well, well, then, he and the client, to be always right.
It is necessary to quickly find out the current security situation and, based on the event, take steps to eliminate the problem.
Immediately give a screenshot of what happened:
')
So, googling and asking a question and getting an answer, I tried all the interfaces listed on the official mod_security website, as the complexity increases. It was found that all of them ceased to be supported somewhere in 2008, which did not suit me.
I left Splunk for last, because firstly it is paid, and secondly I have no confidence in universal products for such tasks.
Briefly about the decision:
one). There are paid and free versions;
2). The test period is 60 days, and if the logs passing through the system are less than 500 MB, then you can easily enter into a free license agreement;
3) I was pleased with a bunch of modules, of which I immediately became interested in the module for MySQL.
4) the ability to install both on the server itself, and on any other host network, with connection to various nodes to collect information. That is, the consolidation of the results of several nodes in a single center (for example, on a home server).
Fears that have arisen:
one). Too universal product;
2). The complexity of installing on a "live" server;
3). Splunk security itself.
four). Eternally satisfied people on the main page of the site and a minimum of technical information.
So, it was decided to put. I had to register an account on the site, after that I downloaded the corresponding package for ubuntu (first I tested the http + MySQL + miniDLNA + file bin + qBitTorrent on my home machine). For a long time I will not describe, it all worked. It was decided to put in production.
Step by step we swing:
1. Splunk itself * .rpm.
Put the
rpm -i *.rpm,We
splunk start serviceWe read the output. The default port is 8000.
2. Module for mod_security on the link from the office. site. It is written that a completely free module.
3. In addition, the module had dependencies on packages: Visit amMap , Download Maxmind
, Download SideView Utils , Google Maps . We do not mind downloaded.
4. Installing mod_security itself is also quite simple: App-> Manage apps -> Install app from a file.
Installation add. modules are worse; you need to unpack them in the Splunk directory, in the modules folder. I got everything and it worked immediately after the restart splunk
5. Bonus swung MySQL Monitor - a module that is also installed through Manage Apps. However, it runs through another place, separate from Splunk.
Add the launch of Splunk when loading:
echo "$SPLUNK/bin/splunk start" >> /etc/rc.local The most interesting thing began when setting up, since it says nothing clearly anywhere, the minimum installation guides are given on the pages.
Necessary retreat. Splunk is positioned as a search engine on a certain database (which is stored on the hard disk of the server where it is installed). It can include information from files (Data Inputs), via TCP, UDP, Scripts (apparently transferring data from scripts). In turn, there is the concept of Indexes, which contains ... indices that refer to Data Inputs.
Let us return to the setting of the mod_security information collection module. It turned out that in order for it to start working, it is necessary in the Manager -> Data Inputs section to enter the collection of logs from a file (I have /var/log/httpd/modsec_audit.log), I indicate this:
So, created Data Input with the name
mod_securGo to Manager -> Indexes and create a mod_secur index that requires you to specify the location of the Splunk database itself in the file system. Put:
Home path: $SPLUNK_DB/mod_sec_db/db Cold path: $SPLUNK_DB/mod_sec_db/dbcold Thawed path: $SPLUNK_DB/mod_sec_db/dbthawe When the data input and index are created, go to the module settings, which were not in the module settings of the Modules section. and in Manager -> Advanced Search -> Search Macros.
In the upper left part of the window, we make sure that the data belongs to the Mod_security module (otherwise I have been poking there for a long time in a bunch of variables of another module, looking for my variables).
We change modsec_index from "main" to our index "mod_secur", modsec_src do not touch.
After these manipulations, the system begins to read the logs, and for about a minute for a three-day file it collects information. In the top processes, I didn’t see Splunk at all, resources eats away at least, which pleased me.
Below is a couple of screenshots, and then I will tell you about the MySQL monitor.
Screenshot time
Two screenshot
From myself I will add that the creators of the monitor for mod_security did not take care of important information at all - the conclusion of the enabled and disabled rules by which it works.
Installing the MySQL monitor brought me more brains, at least due to the fact that the design tears my eyes to the depths of the soul.
When you open the monitor, we always get to the readme, where I did not find it to reconfigure.
The module consists of the MySQl statistics collection daemon, which also needs to be started.
But first, edit the module configuration file "$ SPLUNK_HOME / etc / apps / mysqlmonitor / bin / daemon / config.ini):
> cp config.ini.sample config.ini > cat config.ini [mysql] host=localhost port=3306 username=xxx password=xxx [splunk] host=localhost port=9936 [statusvars] interval=10 [slavestatus] interval=10 [tablestats] interval=3600 [processlist] interval=10 and the file of connected servers $ SPLUNK_HOME / etc / apps / mysqlmonitor / hosts.yaml
> cp hosts.yaml.sample hosts.yaml > cat hosts.yaml Databases: db01: host: localhost username: xxx password: xxx And you can start the demon.
$SPLUNK_HOME/etc/apps/mysqlmonitor/bin/daemon start echo "$SPLUNK_HOME/etc/apps/mysqlmonitor/bin/daemon start " >> /etc/rc.local Depends on installed in the system
• Python 2.6 or 2.7
• Python MySQL drivers
There is a collection of information via TCP socket 9936, which is to be created in Splunk itself: Manager -> Data Inputs -> TCP. We create socket 9936.
Manager -> Indexes -> create a new mysql, a complete analogy with mod_security.
In Manager -> Advanced search -> Search macros we don’t go - there’sn’t anything to change. Everything took off, I bring in screenshots (yes, by the way, the machine does not work, you need to press the search button).
UPD 04.29.2013: I gave birth to such a script, because the demon sometimes falls and stuffed it into crowns (cron) *.
cat mysql_mon.sh #!/bin/bash if ! [ -f / $SPLUNK_HOME/etc/apps/mysqlmonitor/bin/daemon/splunkmysql.pid ]; then echo "MySQL monitor PID-file is Dead. Restarting" $SPLUNK_HOME/etc/apps/mysqlmonitor/bin/daemon/splunkmysqlmonitor.py stop $SPLUNK_HOME/etc/apps/mysqlmonitor/bin/daemon/splunkmysqlmonitor.py start else read pid < $SPLUNK_HOME/etc/apps/mysqlmonitor/bin/daemon/splunkmysql.pid if ! `/bin/kill -0 "$pid"`; then echo "MySQL monitor process is Dead. Restarting" $SPLUNK_HOME/etc/apps/mysqlmonitor/bin/daemon/splunkmysqlmonitor.py stop $SPLUNK_HOME/etc/apps/mysqlmonitor/bin/daemon/splunkmysqlmonitor.py start fi fi echo "Mysql monitor now Working" restart does not work if there is a problem with the PID file, so stop + start.
$ SPLUNK_HOME change to the full path to the program.
Time.
Two. It turned out to be a pleasant opportunity on the third chart “slow queries” to click on any part of the chart and see the request itself.
Three.
Thank you all for your attention!
Source: https://habr.com/ru/post/178175/
All Articles