We study the debugger, part two
In the first part of the article , some nuances of working with the integrated Delphi debugger were considered - not all of course, but the most necessary for the developer. Now the task looks a little different: let's consider its work from the inside using the example of its source code. In order not to bore you with the description of the API functions and not to chew all the stages of debugging, I will describe its work using the example of the TFWDebugerCore class. I will omit some not particularly important moments, if you wish, you can clarify them by looking at the code of this class.
If you are already familiar with the work of the debugger - do not worry, it is likely that some aspects of his work, mentioned in the article, will be of interest to you.
If you have never come across a self-implementation of the debugger, but are interested in it, then at least you should start with this link: Debugging and Error Handling
Through it you can learn about the main aspects of debugging, such as structural exception handling, work with debug information, minidumps. Working with the image of the executable file, headers, sections, process memory card, what is RVA and VA, and so on.
But this is only if you want to understand all this kitchen.
')
I will try to describe only part of it in a simpler language, so that you have a point from which you could push off if you are suddenly interested, and of course, if you implement application protection, you need to understand the subtleties of the debugger at least (and how else differently?).
There will be a lot of code in the text of the article, but I will not consider all the parameters of each of the structures when debugging events occur, for this is MSDN. I’ll dwell only on the necessary debugging tools for work and try to reveal some nuances that you will most likely encounter when implementing the debugging engine yourself.
From you, however, it is desirable to have at least minimal assembly knowledge, because Alas, in this article, alas, can not do.
Before connecting to the process, the very first step is to get debugging privileges. This is done with this simple code:
The next step is to determine whether we will join the already running process, or we will launch a new process from scratch.
If the process is already running and we want to join it, all we need is to find out only the PID of the process and execute such code:
True, this code is not always successful for at least two reasons.
The fact is that in Windows it is impossible to connect to the process with two debuggers at the same time, and if a debugger is already attached to the process we need, the call to the DebugActiveProcess function will not succeed, and GetLastError will return us the error code: ERROR_INVALID_PARAMETER.
The second reason may be that the process we need is launched with higher privileges than the debugger. In this case, the call to the DebugActiveProcess function will also not be successful, and GetLastError will return us the error code: ERROR_ACCESS_DENIED.
In the second case, you can bypass this error by running the debugger with the required privileges.
The second option is to attach the debugger to the process, by starting the process with the following code:
Everything is simple here, in the above code we started the process with the DEBUG_PROCESS flag and additionally indicated the DEBUG_ONLY_THIS_PROCESS flag, indicating that we will not debug the processes created by the debugger.
After starting the process, remember its parameters (useful).
As soon as we have joined the process as a debugger, this process stops working independently and will wait for our team for each its own movement - what to do next. To do this, it will generate debug events and wait until we react to them.
We can get a debugging event from the process being debugged by calling the WaitForDebugEvent function, after which we can perform any necessary actions and return control to it by calling the ContinueDebugEvent function, after which again we have to wait for the next event.
Those. roughly we have to implement the debug event loop loop.
MSND recommends the following implementation of the Debug Event Loop.
Writing the Debugger's Main Loop
We are about the same in our debugger.
In the process of debugging, we will constantly be inside this cycle and process known events. The WaitForDebugEvent function on each iteration of the debug loop returns a DEBUG_EVENT structure. Based on the dwDebugEventCode parameter of this structure, we can identify the type of event received, the process ID and thread in which the event occurred, as well as the parameters of each event, represented as a union by the last field of this structure:
Each event has its own set of parameters, but we will dwell on them a little later.
If any of the events is not handled by our code, simply continue the execution of the process being debugged by calling the ContinueDebugEvent function by setting the ContinueStatus parameter to DBG_CONTINUE.
Nuance: in case WaitForDebugEvent returned an error (for example, by timeout), it is not necessary to call ContinueDebugEvent, it will also return an error. At this point, very often they stumble, do not forget to take it into account in your own implementation of the debugger.
So far, everything is quite simple, now let's see what events give us.
The very first event that the debugger will receive at the start of debugging. It does not matter whether we started the process ourselves, or joined it through a call to the DebugActiveProcess, we will begin the work with it. The parameters of this event are stored in the DebugEvent.CreateProcessInfo structure (CREATE_PROCESS_DEBUG_INFO structure).
In general, the event handler looks like this:
In it, we simply remember the process parameters, as well as add the ID and handle of the main thread of the process to the internal list. These data will be useful to us later.
Here we can also define the process entry point (Entry Point), its value is recorded in the DebugEvent.CreateProcessInfo.lpStartAddres parameter and, if desired, set a breakpoint (hereinafter BP) to its address and start the process for execution. If you harden a little bit, then by performing this action we simulate the behavior of the Delphi debugger when you press the F7 button.
What is the entry point: when the loader creates a process, until the moment when it starts, a lot of preparatory actions are performed. Creating the main thread of the application, setting up stacks, process environment blocks / threads, loading libraries, executing their TLS callbacks, etc. Only after all this is done, the loader transfers control directly to the entry point, from where the code implemented by the programmer is already beginning to run. The address of this point is stored directly in the header of the PE file, from where it can be obtained by any application displaying the structure of the PE file, for example PEiD or PeExplorer, or read this value yourself by reading the TImageDosHeader structure located at the very beginning of the file, in its _lfanew field will be offset to start TImageNtHeaders, then read the structure TImageNtHeaders itself and see the value of its field TImageNtHeaders.OptionalHeader.AddressOfEntryPoint.
Try to compile an empty project, and click F7 in it, after which go to the CPU-View tab, you should get something like this:

The address of the entry point is: 0x0043E2D4. Now let's see what PEiD will tell us about the resulting application:
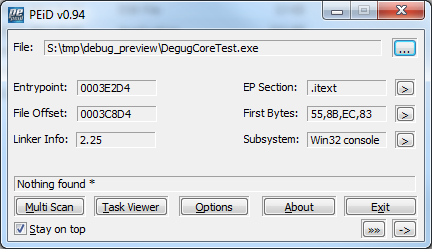
He says the entry point value is 0x0003E2D4.
Although it does not coincide with the number that we saw in the debugger, nevertheless, everything is correct here, since the value stored in the AddressOfEntryPoint parameter is represented as RVA (Relative Virtual Address). The peculiarity of this addressing is that it does not take into account the load address of our module (hInstance). In order to get a VA (Virtual Address) from an RVA address, you must add the hInstance module to it.
There is a nuance: this is true only for applications, for libraries it works a little differently. For them it is necessary to focus on the addresses of the sections. More details can be found in this demo example: "Implementation of the file properties tab" .
In it, in the DebugHlp.pas module, there is an implementation of the ImageRvaToVa () function, by which you can visually study the rules for addressing.
Well, for the application, the base download address is always equal to the value specified by us in the linker settings in the Image Base parameter, which by default is 0x00400000. Adding these two numbers, we just get the required 0x0043E2D4.
Right after CREATE_PROCESS_DEBUG_EVENT, we will begin to receive library loading events with parameters in the DebugEvent.LoadDll structure (LOAD_DLL_DEBUG_INFO structure).
In the general case, we can observe the loading of libraries in the Delphi debugger, which displays notifications about loading in the event log:
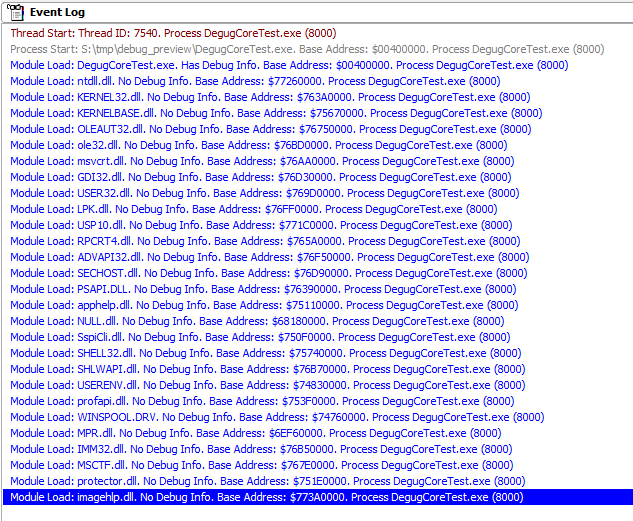
When a Delphi event is received, the debugger, if a BP is installed on the module load, is interrupted immediately after it is loaded.
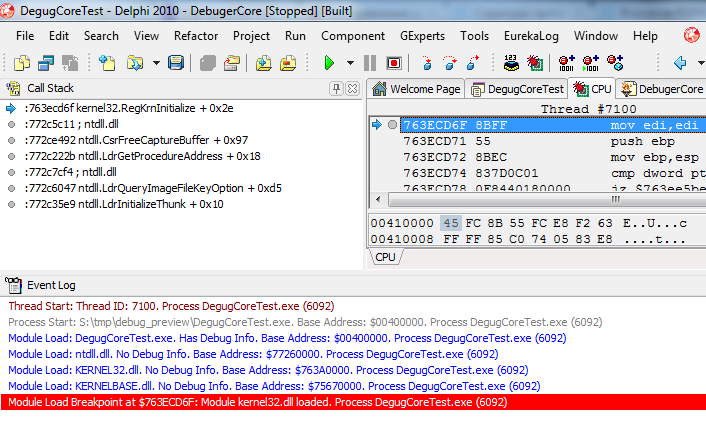
We can also notify the user about loading the module with this code:
In which, in addition to raising the event, we immediately close the handle of the loaded library, we will no longer need it (in this version of the debugger implementation).
The nuance is as follows: the address with the path to the loaded library stored in the DebugEvent.LoadDll.lpImageName parameter is not located in our address space, so we will have to read it through ReadProcessMemory.
The second nuance: this value is also a pointer to the buffer along which the path data is located, i.e. will have to read at least twice.
The third nuance: the path can be either in Ansii or in Unicode encoding.
Well, for a snack, the fourth thing: we can not read the data :)
To get a valid path to the loadable library, the TFWDebugerCore class provides the GetDllName method that takes all these points into account.
Consider the implementation.
The TFWDebugerCore class will notify us when the library is loaded by calling an external OnLoadDll event, where we will write the following code:
Here, we call the TFWDebugerCore.GetDllName () method and (focusing on the fUnicode parameter), we output the data to the console.
The implementation of the GetDllName method looks like this:
That is, first we try to get the path to the library by reading data from the address space of the process being debugged (ReadData + ReadStringA), and if it did not work out, we take this data by calling the GetMappedFileNameA function. It returns data using symbolic links, so the result for good needs to also lead to a normal path, but in this case I did not do this in order not to over-complicate the code.
We will receive this event at the moment when a new thread is created in the application being debugged. The parameters of this event are stored in the DebugEvent.CreateThread structure (CREATE_THREAD_DEBUG_INFO structure).
Of all the parameters, we are most interested in DebugEvent.CreateThread.hThread, which is desirable to save in the internal list.
The caveat is that most events only contain data about the thread ID, and when we want to work with it (for example, to install the Hardware Breakpoint), we will have to make an OpenThread call on the transferred ID. In order not to bother yourself with these actions, we will keep ThreadID = ThreadHandle pairs in our own cache.
The event handler code for this event is as follows:
In addition to saving the thread parameters and calling the external handler, there is nothing in it.
The event is generated at the moment when the debugged application tries to inform something on the calls to the OutputDebugString function. The parameters of this event are stored in the DebugEvent.DebugString structure (OUTPUT_DEBUG_STRING_INFO structure).
The event handler is simple:
those. just call the external handler where you need to read the passed string by the same principle as we read the path to the loadable library.
For example, like this:
In the handler, we look in what encoding the buffer is passed to us, focusing on the Data.fUnicode parameter and call the corresponding debugger kernel function ReadStringX ().
Unloading the library, closing the thread, terminating the process and an error in the debugger kernel.
I’ll skip these four events. There is nothing extraordinary in them. When each one is received, external handlers are invoked and internal lists stored by the debugger are cleaned.
Nuances when working with them are missing.
All eight of the above events are, in principle, secondary. The main work begins only after the arrival of the EXCEPTION_DEBUG_EVENT event.
Its parameters are in the DebugEvent.Exception structure (EXCEPTION_DEBUG_INFO structure) .
Generating this event means that an application encountered some kind of exception, the type of which can be found in the DebugEvent.Exception.ExceptionRecord.ExceptionCode parameter. Remember, in the first part of the article I mentioned that debugging is done through the structural error handling mechanism (SEH)? Now we will look at it in more detail.
Most of the exceptions in the debugging process are imposed. That is, getting an exception does not mean that an error occurred in the program itself. Most likely the exception occurred due to the intervention of the debugger in the application, for example, by installing BP.
Nuance: If an error occurs in the application itself, we will also receive it as a debugging exception and we will need to implement the debugger code so that we can distinguish our induced errors from user errors.
Usually, the debugger provides three mechanisms for working with BP (well, if you do not take into account BP to load the module, because in fact this feature is not a classic BP).
To work with them, it suffices to handle three types of exceptions:
In order to make it clearer why these three exceptions are enough, you first need to consider the mechanism for setting each type of BP before proceeding to the analysis of the logic for handling the EXCEPTION_DEBUG_EVENT event.
Implementing a breakpoint on a line of code:
Installing BP on a line of code is done by modifying the code of the application being debugged. Classically, this is done by recording the opcode 0xCC at the address set by BP, meaning the instruction "INT3".
There are other options, such as opcode 0xCD03, which is also the instruction "INT3". The second option is used more with anti-debugging and is installed in most cases by the application itself, trying to catch the presence of a debugger on the fact that the nuclear _KiTrap03 () can work only with a single-byte opcode and slightly incorrectly processes the two-byte one.
But, all this lyrics, we are interested in exactly the first opcode.
The TFWDebugerCore class uses the following structures to store the list of installed BPs:
Before adding a new BP, he initializes the TBreakpoint entry, filling it with the necessary parameters, and then adds it to the general list of breakpoints.
For BP per line of code, we need to store only two values, the address of the BP and the value of the byte stored at this address before we fill it with the opcode 0xCC.
Installing BP in the application being debugged looks like this:
, , . , , , , , 0xCC BPOpcode VirtualProtectEx(). , , .
:
, «INT3». EXCEPTION_DEBUG_EVENT EXCEPTION_BREAKPOINT.
DebugEvent.Exception.ExceptionRecord (EXCEPTION_DEBUG_INFO structure).
, , , ?
. DebugEvent.Exception.ExceptionRecord.ExceptionAddress Address btBreakpoint, , - .
, ( , ) .
:
.
:
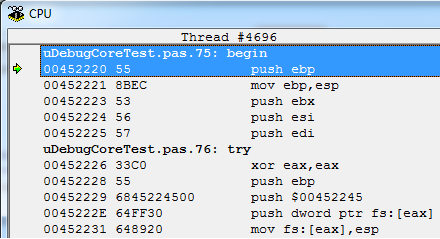
:
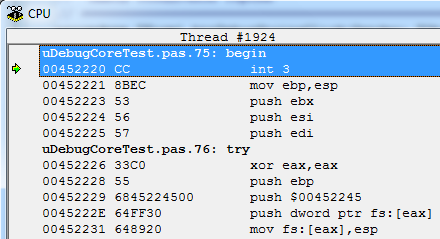
.
, TBreakpoint Active, . TFWDebugerCore , ToggleInt3Breakpoint, .
, (.. ).
: , . «INT3» , 0x452220, 0x452221, «mov ebp, esp», .
: : « — „push ebp“, , — ©». - , .
, , , , , ( , ) .
:
, .
, « NOP». , - , NOP ( ) 0x90. , . — .
, :
NOP ( $0F, $1F, $00) :
:

, .
, . , , «jmp +1» . — .
, :
:

, .
, : 0x452220, , «push $00452245».
, «push epb» . , , , , , , :
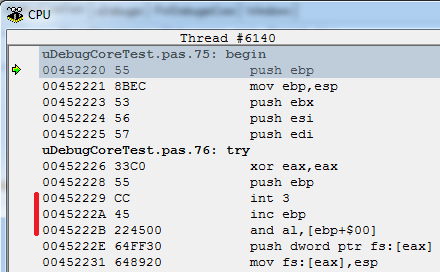
Those. «push $00452245» «inc epb» «and al, [ebp+$00]», . - , — .
, . , , EIP (Extended Instruction Pointer). , . EIP GetThreadContext, Context.Eip, SetThreadContext.
: EXCEPTION_DEBUG_EVENT ID DebugEvent.dwThreadId, GetThreadContext() SetThreadContext() , ID . OpenThread, , , ThreadID = ThreadHandle.
, , , . , 0xCC , ? , , , .
, - , . , .
, , , , .. .
.
TF . , «INT1», EXCEPTION_DEBUG_EVENT EXCEPTION_SINGLE_STEP.
, EIP. Context.EFlags. TF . Those. :
: «INT1» TF . Those. , , TF . , , EXCEPTION_SINGLE_STEP TF . .
, :
F7 Delphi :)
TFWDebugerCore.
EXCEPTION_BREAKPOINT:
ExceptionAddress.
.
ToggleInt3Breakpoint.
EIP SetSingleStepMode.
— RemoveBreakpoint.
, EXCEPTION_SINGLE_STEP, .
SetSingleStepMode :
, , CONTEXT_FULL.
EIP
TF .
.
RemoveBreakpoint :
.
EXCEPTION_SINGLE_STEP , .. . , .
. Memory Breakpoint ( MBP).
: , . (. -: ). MBP , PAGE_GUARD VirtualProtectEx.
: , VirtualProtectEx , , . . , .
: MBP . : MBP Protect , , MBP. MBP . TFWDebugerCore . MBP , MBP . , PreviosRegionProtect, , VirtualProtectEx.
:
MBP , . , — BreakOnWrite, ( ). .
. EXCEPTION_DEBUG_EVENT EXCEPTION_GUARD_PAGE.
- . PAGE_GUARD , . . . , EXCEPTION_GUARD_PAGE , , , PAGE_GUARD .
:
- . ExceptionRecord.ExceptionInformation , . , — .
CheckIsAddrInRealMemoryBPRegion .
, BreakOnWrite.
ExceptionInformation. BreakOnWrite , ExceptionInformation , , BreakOnWrite , .
, , EIP. SetSingleStepMode False.
EXCEPTION_SINGLE_STEP FRestoreMBPIndex.
:
- .
- , , . .
, . EIP . , Delphi .
. .
Hardware BreakPoint ( HBP). . . , , .
.
:
— ( )
— /.
— , , /, IO ( /) .
Those. ( ) ( — /). , .. 1, 2 4 .
, DR , CONTEXT_DEBUG_REGISTERS.
. Dr0..Dr3, Dr6, Dr7. (Dr4 Dr5 ).
4 . Dr7 . Dr6 .
TFWDebugerCore :
4 , .
ID = hThreadHandle. :
Those. , .
, .
:
UpdateHardwareBreakpoints.
:
Active UpdateHardwareBreakpoints.
:
UpdateHardwareBreakpoints.
UpdateHardwareBreakpoints.
Dr0-Dr3 Dr7.
- .
, :
4 (31-28) Dr3.
It looks like this:
2 (LENi) .
00 — 1
01 — 2
10 — .
11 — 4
2 (RWi) 4
00 — Execute
01 — Write
10 — IO Read/Write
11 — Read/Write
, Dr3 4 , Dr3, 4 Dr7 1101.
4 (27-24) Dr2
23-20 Dr1 , , 19-16 Dr0.
13 Dr7 (GD — Global Debug Register Access Detect) — . , .
9 Dr7 (GE — Global Exact data breakpoint match) — .
8 Dr7 (LE — Local Exact data breakpoint match) — .
LE , .
8 (7-0) Gi Li HBP .
7 (Gi — Global breakpoint enable) — Dr3
6 (Li — Local breakpoint enable) — Dr3
5- 4 Dr2
3- 2 Dr1 1-0 Dr0
?
:
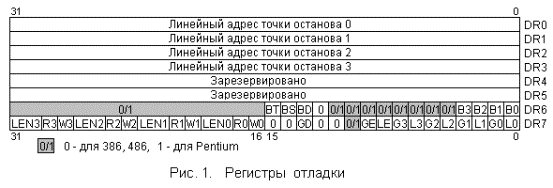
.
, , Dr7 .
LE DR7_SET_LOC_ON.
.
EXCEPTION_BREAKPOINT.
EXCEPTION_GUARD_PAGE.
EXCEPTION_DEBUG_EVENT EXCEPTION_SINGLE_STEP, ( ).
EXCEPTION_SINGLE_STEP :
, .
Dr6 .
4 1 , DrX .
, , , ( EIP) , , EXCEPTION_SINGLE_STEP .
, .
EXCEPTION_SINGLE_STEP.
:
, . , ToggleHardwareBreakpoint .
, FRestoreBPIndex FRestoreMBPIndex , .
ToggleInt3Breakpoint ToggleMemoryBreakpoint.
, — , .
: « » :)
.
— . VCL , «test_app», .
— . , ( ) TMemo TRichEdit, .
We write:
- :
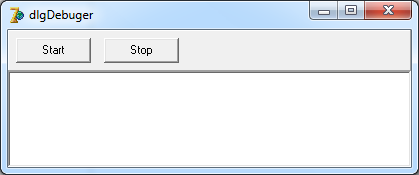
«Start», .
.
, TFWDebugerCore.RunMainLoop, .
, .
, ( — ) OnIdle TFWDebugerCore, :
Application.ProcessMessages .
, Delphi. OnCreateProcess OnLoadDll.
:
:
«Start»
:
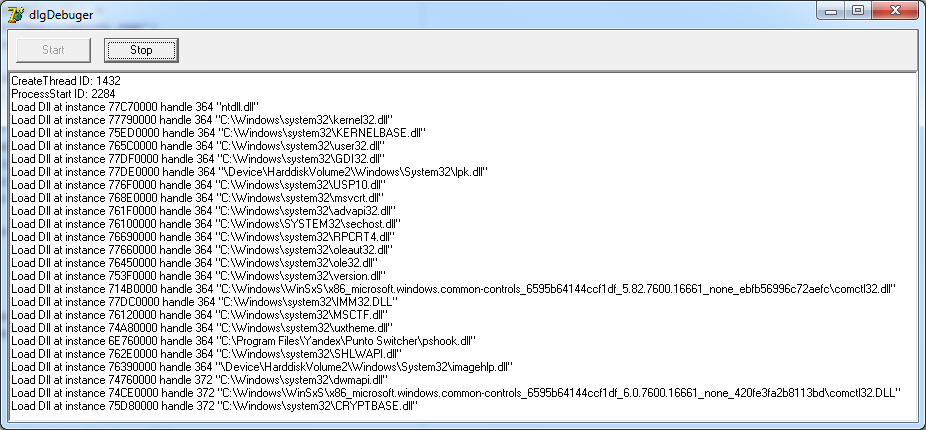
— .
. , TF , MBP. 40 . :
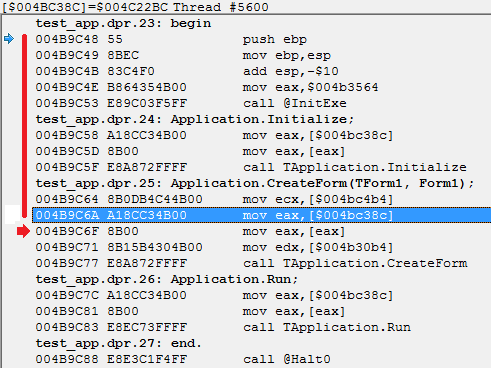
, / . . DebugNewProcess. True, . OnBreakPoint .
OnSingleStep, :
:
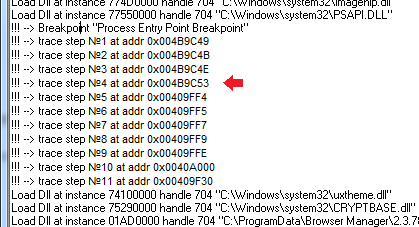
StepIn, , 0x00409FF4, _InitExe(), 0x00409C53. , _InitExe(), , .
— .
, OnPageGuard , SetMemoryBreakpoint . , OnBreakPoint . , , RemoveBreakpoint ( ), // , ReleaseBreakpoint , RemoveCurrentBreakpoint . TFWDebugerCore , .
, , , .
:
, OutputDebugString. :
OnDebugString, :
, . «Test debug string» ? , :)
:
? - . :
, .
: , ContinueStatus, ContinueDebugEvent, DBG_CONTINUE. What does this mean? .
: «INT3» . , exception..end, . , .
, , — .
, OnUnknownBreakPoint (int3 — , , ). :
, , ( $500000). — - . , , DBG_EXCEPTION_NOT_HANDLED, , - .
, , , :)
:
, , . , :
. , — . ? , , , PAGE_GUARD. , - , , . EXCEPTION_STACK_OVERFLOW. « » , . , PAGE_GUARD , , - . , EXCEPTION_ACCESS_VIOLATION - «», , DBG_CONTROL_C ( AV).
OnUnknownException, .. TFWDebugerCore . :
:
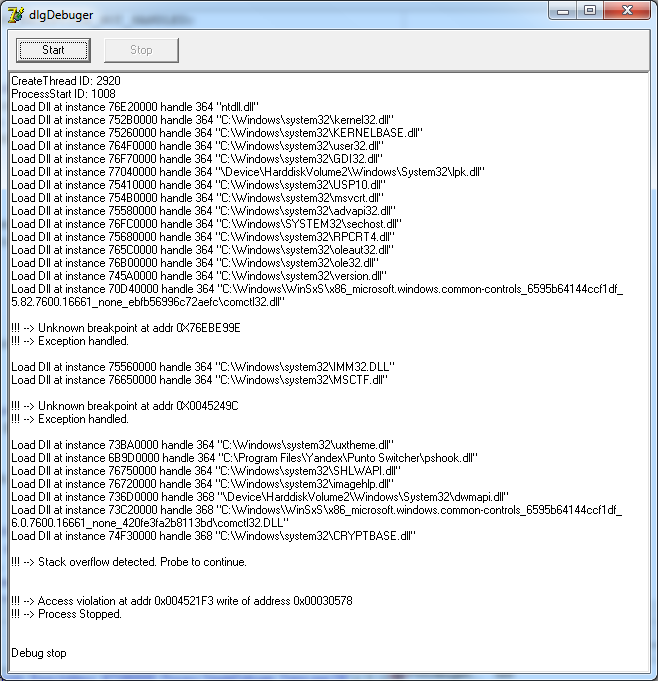
. , .
, , , . , , .
, :)
: http://rouse.drkb.ru/blog/dbg_part2.zip
, :)
.
© (Rouse_)
, 2012
If you are already familiar with the work of the debugger - do not worry, it is likely that some aspects of his work, mentioned in the article, will be of interest to you.
If you have never come across a self-implementation of the debugger, but are interested in it, then at least you should start with this link: Debugging and Error Handling
Through it you can learn about the main aspects of debugging, such as structural exception handling, work with debug information, minidumps. Working with the image of the executable file, headers, sections, process memory card, what is RVA and VA, and so on.
But this is only if you want to understand all this kitchen.
')
I will try to describe only part of it in a simpler language, so that you have a point from which you could push off if you are suddenly interested, and of course, if you implement application protection, you need to understand the subtleties of the debugger at least (and how else differently?).
There will be a lot of code in the text of the article, but I will not consider all the parameters of each of the structures when debugging events occur, for this is MSDN. I’ll dwell only on the necessary debugging tools for work and try to reveal some nuances that you will most likely encounter when implementing the debugging engine yourself.
From you, however, it is desirable to have at least minimal assembly knowledge, because Alas, in this article, alas, can not do.
Let's start by attaching a debugger to the process:
Before connecting to the process, the very first step is to get debugging privileges. This is done with this simple code:
function SetDebugPriv: Boolean; var Token: THandle; tkp: TTokenPrivileges; begin Result := false; if OpenProcessToken(GetCurrentProcess, TOKEN_ADJUST_PRIVILEGES or TOKEN_QUERY, Token) then begin if LookupPrivilegeValue(nil, PChar('SeDebugPrivilege'), tkp.Privileges[0].Luid) then begin tkp.PrivilegeCount := 1; tkp.Privileges[0].Attributes := SE_PRIVILEGE_ENABLED; Result := AdjustTokenPrivileges(Token, False, tkp, 0, PTokenPrivileges(nil)^, PDWord(nil)^); end; end; end; The next step is to determine whether we will join the already running process, or we will launch a new process from scratch.
If the process is already running and we want to join it, all we need is to find out only the PID of the process and execute such code:
function TFWDebugerCore.AttachToProcess(ProcessID: DWORD; SentEntryPointBreakPoint: Boolean): Boolean; begin Result := False; if FProcessInfo.ProcessID <> 0 then Exit; FSetEntryPointBreakPoint := SentEntryPointBreakPoint; FProcessInfo.ProcessID := ProcessID; Result := DebugActiveProcess(ProcessID); end; True, this code is not always successful for at least two reasons.
The fact is that in Windows it is impossible to connect to the process with two debuggers at the same time, and if a debugger is already attached to the process we need, the call to the DebugActiveProcess function will not succeed, and GetLastError will return us the error code: ERROR_INVALID_PARAMETER.
The second reason may be that the process we need is launched with higher privileges than the debugger. In this case, the call to the DebugActiveProcess function will also not be successful, and GetLastError will return us the error code: ERROR_ACCESS_DENIED.
In the second case, you can bypass this error by running the debugger with the required privileges.
The second option is to attach the debugger to the process, by starting the process with the following code:
function TFWDebugerCore.DebugNewProcess(const FilePath: string; SentEntryPointBreakPoint: Boolean): Boolean; var PI: TProcessInformation; SI: TStartupInfo; begin Result := False; if FProcessInfo.ProcessID <> 0 then Exit; FSetEntryPointBreakPoint := SentEntryPointBreakPoint; ZeroMemory(@SI, SizeOf(TStartupInfo)); SI.cb := SizeOf(TStartupInfo); Result := CreateProcess(PChar(FilePath), nil, nil, nil, False, DEBUG_PROCESS or DEBUG_ONLY_THIS_PROCESS, nil, nil, SI, PI); if Result then begin FProcessInfo.ProcessID := PI.dwProcessId; FProcessInfo.CreatedProcessHandle := PI.hProcess; FProcessInfo.CreatedThreadHandle := PI.hThread; end; end; Everything is simple here, in the above code we started the process with the DEBUG_PROCESS flag and additionally indicated the DEBUG_ONLY_THIS_PROCESS flag, indicating that we will not debug the processes created by the debugger.
After starting the process, remember its parameters (useful).
As soon as we have joined the process as a debugger, this process stops working independently and will wait for our team for each its own movement - what to do next. To do this, it will generate debug events and wait until we react to them.
We can get a debugging event from the process being debugged by calling the WaitForDebugEvent function, after which we can perform any necessary actions and return control to it by calling the ContinueDebugEvent function, after which again we have to wait for the next event.
Those. roughly we have to implement the debug event loop loop.
MSND recommends the following implementation of the Debug Event Loop.
Writing the Debugger's Main Loop
We are about the same in our debugger.
procedure TFWDebugerCore.RunMainLoop; var DebugEvent: TDebugEvent; CallNextLoopIteration: Boolean; ThreadIndex: Integer; begin CallNextLoopIteration := False; repeat ContinueStatus := DBG_CONTINUE; if not WaitForDebugEvent(DebugEvent, MainLoopWaitPeriod) then begin if GetLastError = ERROR_SEM_TIMEOUT then begin DoIdle; if FProcessInfo.ProcessID = 0 then Exit; CallNextLoopIteration := True; Continue; end else begin DoMainLoopFailed; Break; end; end; case DebugEvent.dwDebugEventCode of CREATE_THREAD_DEBUG_EVENT: DoCreateThread(DebugEvent); CREATE_PROCESS_DEBUG_EVENT: DoCreateProcess(DebugEvent); EXIT_THREAD_DEBUG_EVENT: DoExitThread(DebugEvent); EXIT_PROCESS_DEBUG_EVENT: begin DoExitProcess(DebugEvent); Break; end; LOAD_DLL_DEBUG_EVENT: DoLoadDll(DebugEvent); UNLOAD_DLL_DEBUG_EVENT: DoUnLoadDll(DebugEvent); OUTPUT_DEBUG_STRING_EVENT: DoDebugString(DebugEvent); RIP_EVENT: DoRip(DebugEvent); EXCEPTION_DEBUG_EVENT: begin ThreadIndex := GetThreadIndex(DebugEvent.dwThreadId); case DebugEvent.Exception.ExceptionRecord.ExceptionCode of EXCEPTION_BREAKPOINT: ProcessExceptionBreakPoint(ThreadIndex, DebugEvent); EXCEPTION_SINGLE_STEP: ProcessExceptionSingleStep(ThreadIndex, DebugEvent); EXCEPTION_GUARD_PAGE: ProcessExceptionGuardPage(ThreadIndex, DebugEvent); else CallUnhandledExceptionEvents(ThreadIndex, CodeDataToExceptionCode( DebugEvent.Exception.ExceptionRecord.ExceptionCode), DebugEvent); end; end; end; CallNextLoopIteration := ContinueDebugEvent(DebugEvent.dwProcessId, DebugEvent.dwThreadId, ContinueStatus); until not CallNextLoopIteration; end; In the process of debugging, we will constantly be inside this cycle and process known events. The WaitForDebugEvent function on each iteration of the debug loop returns a DEBUG_EVENT structure. Based on the dwDebugEventCode parameter of this structure, we can identify the type of event received, the process ID and thread in which the event occurred, as well as the parameters of each event, represented as a union by the last field of this structure:
PDebugEvent = ^TDebugEvent; _DEBUG_EVENT = record dwDebugEventCode: DWORD; dwProcessId: DWORD; dwThreadId: DWORD; case Integer of 0: (Exception: TExceptionDebugInfo); 1: (CreateThread: TCreateThreadDebugInfo); 2: (CreateProcessInfo: TCreateProcessDebugInfo); 3: (ExitThread: TExitThreadDebugInfo); 4: (ExitProcess: TExitProcessDebugInfo); 5: (LoadDll: TLoadDLLDebugInfo); 6: (UnloadDll: TUnloadDLLDebugInfo); 7: (DebugString: TOutputDebugStringInfo); 8: (RipInfo: TRIPInfo); end; {$EXTERNALSYM _DEBUG_EVENT} TDebugEvent = _DEBUG_EVENT; DEBUG_EVENT = _DEBUG_EVENT; {$EXTERNALSYM DEBUG_EVENT} Each event has its own set of parameters, but we will dwell on them a little later.
If any of the events is not handled by our code, simply continue the execution of the process being debugged by calling the ContinueDebugEvent function by setting the ContinueStatus parameter to DBG_CONTINUE.
Nuance: in case WaitForDebugEvent returned an error (for example, by timeout), it is not necessary to call ContinueDebugEvent, it will also return an error. At this point, very often they stumble, do not forget to take it into account in your own implementation of the debugger.
So far, everything is quite simple, now let's see what events give us.
CREATE_PROCESS_DEBUG_EVENT:
The very first event that the debugger will receive at the start of debugging. It does not matter whether we started the process ourselves, or joined it through a call to the DebugActiveProcess, we will begin the work with it. The parameters of this event are stored in the DebugEvent.CreateProcessInfo structure (CREATE_PROCESS_DEBUG_INFO structure).
In general, the event handler looks like this:
procedure TFWDebugerCore.DoCreateProcess(DebugEvent: TDebugEvent); begin // FProcessInfo.AttachedFileHandle := DebugEvent.CreateProcessInfo.hFile; FProcessInfo.AttachedProcessHandle := DebugEvent.CreateProcessInfo.hProcess; FProcessInfo.AttachedThreadHandle := DebugEvent.CreateProcessInfo.hThread; FProcessInfo.EntryPoint := DWORD(DebugEvent.CreateProcessInfo.lpStartAddress); AddThread(DebugEvent.dwThreadId, FProcessInfo.AttachedThreadHandle); // BreakPoint if FSetEntryPointBreakPoint then SetBreakpoint(FProcessInfo.EntryPoint, 'Process Entry Point Breakpoint'); if Assigned(FCreateProcess) then begin FCreateProcess(Self, GetThreadIndex(DebugEvent.dwThreadId), DebugEvent.CreateProcessInfo); DoResumeAction(GetThreadIndex(DebugEvent.dwThreadId)); end; end; In it, we simply remember the process parameters, as well as add the ID and handle of the main thread of the process to the internal list. These data will be useful to us later.
Here we can also define the process entry point (Entry Point), its value is recorded in the DebugEvent.CreateProcessInfo.lpStartAddres parameter and, if desired, set a breakpoint (hereinafter BP) to its address and start the process for execution. If you harden a little bit, then by performing this action we simulate the behavior of the Delphi debugger when you press the F7 button.
What is the entry point: when the loader creates a process, until the moment when it starts, a lot of preparatory actions are performed. Creating the main thread of the application, setting up stacks, process environment blocks / threads, loading libraries, executing their TLS callbacks, etc. Only after all this is done, the loader transfers control directly to the entry point, from where the code implemented by the programmer is already beginning to run. The address of this point is stored directly in the header of the PE file, from where it can be obtained by any application displaying the structure of the PE file, for example PEiD or PeExplorer, or read this value yourself by reading the TImageDosHeader structure located at the very beginning of the file, in its _lfanew field will be offset to start TImageNtHeaders, then read the structure TImageNtHeaders itself and see the value of its field TImageNtHeaders.OptionalHeader.AddressOfEntryPoint.
Try to compile an empty project, and click F7 in it, after which go to the CPU-View tab, you should get something like this:

The address of the entry point is: 0x0043E2D4. Now let's see what PEiD will tell us about the resulting application:

He says the entry point value is 0x0003E2D4.
Although it does not coincide with the number that we saw in the debugger, nevertheless, everything is correct here, since the value stored in the AddressOfEntryPoint parameter is represented as RVA (Relative Virtual Address). The peculiarity of this addressing is that it does not take into account the load address of our module (hInstance). In order to get a VA (Virtual Address) from an RVA address, you must add the hInstance module to it.
There is a nuance: this is true only for applications, for libraries it works a little differently. For them it is necessary to focus on the addresses of the sections. More details can be found in this demo example: "Implementation of the file properties tab" .
In it, in the DebugHlp.pas module, there is an implementation of the ImageRvaToVa () function, by which you can visually study the rules for addressing.
Well, for the application, the base download address is always equal to the value specified by us in the linker settings in the Image Base parameter, which by default is 0x00400000. Adding these two numbers, we just get the required 0x0043E2D4.
LOAD_DLL_DEBUG_EVENT:
Right after CREATE_PROCESS_DEBUG_EVENT, we will begin to receive library loading events with parameters in the DebugEvent.LoadDll structure (LOAD_DLL_DEBUG_INFO structure).
In the general case, we can observe the loading of libraries in the Delphi debugger, which displays notifications about loading in the event log:

When a Delphi event is received, the debugger, if a BP is installed on the module load, is interrupted immediately after it is loaded.

We can also notify the user about loading the module with this code:
procedure TFWDebugerCore.DoLoadDll(DebugEvent: TDebugEvent); begin if Assigned(FLoadDll) then begin FLoadDll(Self, GetThreadIndex(DebugEvent.dwThreadId), DebugEvent.LoadDll); DoResumeAction; end; CloseHandle(DebugEvent.LoadDll.hFile); end; In which, in addition to raising the event, we immediately close the handle of the loaded library, we will no longer need it (in this version of the debugger implementation).
The nuance is as follows: the address with the path to the loaded library stored in the DebugEvent.LoadDll.lpImageName parameter is not located in our address space, so we will have to read it through ReadProcessMemory.
The second nuance: this value is also a pointer to the buffer along which the path data is located, i.e. will have to read at least twice.
The third nuance: the path can be either in Ansii or in Unicode encoding.
Well, for a snack, the fourth thing: we can not read the data :)
To get a valid path to the loadable library, the TFWDebugerCore class provides the GetDllName method that takes all these points into account.
Consider the implementation.
The TFWDebugerCore class will notify us when the library is loaded by calling an external OnLoadDll event, where we will write the following code:
procedure TdlgDebuger.OnLoadDll(Sender: TObject; ThreadIndex: Integer; Data: TLoadDLLDebugInfo); const FormatStrKnownDLL = 'Load Dll at instance %p handle %d "%s"'; FormatStrUnknownDLL = 'Load unknown Dll at instance %p handle %d'; var DllName: AnsiString; IsUnicodeData: Boolean; begin FCore.ContinueStatus := DBG_EXCEPTION_NOT_HANDLED; IsUnicodeData := Data.fUnicode = 1; DllName := FCore.GetDllName(Data.lpImageName, Data.lpBaseOfDll, IsUnicodeData); if DllName <> '' then begin if IsUnicodeData then Writeln(Format(FormatStrKnownDLL, [Data.lpBaseOfDll, Data.hFile, PWideChar(@DllName[1])])) else Writeln(Format(FormatStrKnownDLL, [Data.lpBaseOfDll, Data.hFile, PAnsiChar(@DllName[1])])); end else Writeln(Format(FormatStrUnknownDLL, [Data.lpBaseOfDll, Data.hFile])); end; Here, we call the TFWDebugerCore.GetDllName () method and (focusing on the fUnicode parameter), we output the data to the console.
The implementation of the GetDllName method looks like this:
function TFWDebugerCore.ReadData(AddrPrt, ResultPtr: Pointer; DataSize: Integer): Boolean; var Dummy: DWORD; begin Result := ReadProcessMemory(FProcessInfo.AttachedProcessHandle, AddrPrt, ResultPtr, DataSize, Dummy) and (Integer(Dummy) = DataSize); end; function TFWDebugerCore.ReadStringA(AddrPrt: Pointer; DataSize: Integer): AnsiString; begin SetLength(Result, DataSize); if not ReadData(AddrPrt, @Result[1], DataSize) then Result := ''; end; function GetMappedFileNameA(hProcess: THandle; lpv: Pointer; lpFilename: LPSTR; nSize: DWORD): DWORD; stdcall; external 'psapi.dll'; function TFWDebugerCore.GetDllName(lpImageName, lpBaseOfDll: Pointer; var Unicode: Boolean): AnsiString; var DllNameAddr: Pointer; MappedName: array [0..MAX_PATH - 1] of AnsiChar; begin if ReadData(lpImageName, @DllNameAddr, 4) then Result := ReadStringA(DllNameAddr, MAX_PATH); if Result = '' then begin if GetMappedFileNameA(FProcessInfo.AttachedProcessHandle, lpBaseOfDll, @MappedName[0], MAX_PATH) > 0 then begin Result := PAnsiChar(@MappedName[0]); Unicode := False; end; end; end; That is, first we try to get the path to the library by reading data from the address space of the process being debugged (ReadData + ReadStringA), and if it did not work out, we take this data by calling the GetMappedFileNameA function. It returns data using symbolic links, so the result for good needs to also lead to a normal path, but in this case I did not do this in order not to over-complicate the code.
CREATE_THREAD_DEBUG_EVENT
We will receive this event at the moment when a new thread is created in the application being debugged. The parameters of this event are stored in the DebugEvent.CreateThread structure (CREATE_THREAD_DEBUG_INFO structure).
Of all the parameters, we are most interested in DebugEvent.CreateThread.hThread, which is desirable to save in the internal list.
The caveat is that most events only contain data about the thread ID, and when we want to work with it (for example, to install the Hardware Breakpoint), we will have to make an OpenThread call on the transferred ID. In order not to bother yourself with these actions, we will keep ThreadID = ThreadHandle pairs in our own cache.
The event handler code for this event is as follows:
procedure TFWDebugerCore.DoCreateThread(DebugEvent: TDebugEvent); begin AddThread(DebugEvent.dwThreadId, DebugEvent.CreateThread.hThread); if Assigned(FCreateThread) then begin FCreateThread(Self, GetThreadIndex(DebugEvent.dwThreadId), DebugEvent.CreateThread); DoResumeAction; end; end; In addition to saving the thread parameters and calling the external handler, there is nothing in it.
OUTPUT_DEBUG_STRING_EVENT:
The event is generated at the moment when the debugged application tries to inform something on the calls to the OutputDebugString function. The parameters of this event are stored in the DebugEvent.DebugString structure (OUTPUT_DEBUG_STRING_INFO structure).
The event handler is simple:
procedure TFWDebugerCore.DoDebugString(DebugEvent: TDebugEvent); begin if Assigned(FDebugString) then begin FDebugString(Self, GetThreadIndex(DebugEvent.dwThreadId), DebugEvent.DebugString); DoResumeAction; end; end; those. just call the external handler where you need to read the passed string by the same principle as we read the path to the loadable library.
For example, like this:
procedure TdlgDebuger.OnDebugString(Sender: TObject; ThreadIndex: Integer; Data: TOutputDebugStringInfo); begin if Data.fUnicode = 1 then Writeln('DebugString: ' + PWideChar(FCore.ReadStringW(Data.lpDebugStringData, Data.nDebugStringLength))) else Writeln('DebugString: ' + PAnsiChar(FCore.ReadStringA(Data.lpDebugStringData, Data.nDebugStringLength))); end; In the handler, we look in what encoding the buffer is passed to us, focusing on the Data.fUnicode parameter and call the corresponding debugger kernel function ReadStringX ().
UNLOAD_DLL_DEBUG_EVENT, EXIT_THREAD_DEBUG_EVENT, EXIT_PROCESS_DEBUG_EVENT, RIP_EVENT:
Unloading the library, closing the thread, terminating the process and an error in the debugger kernel.
I’ll skip these four events. There is nothing extraordinary in them. When each one is received, external handlers are invoked and internal lists stored by the debugger are cleaned.
Nuances when working with them are missing.
EXCEPTION_DEBUG_EVENT:
All eight of the above events are, in principle, secondary. The main work begins only after the arrival of the EXCEPTION_DEBUG_EVENT event.
Its parameters are in the DebugEvent.Exception structure (EXCEPTION_DEBUG_INFO structure) .
Generating this event means that an application encountered some kind of exception, the type of which can be found in the DebugEvent.Exception.ExceptionRecord.ExceptionCode parameter. Remember, in the first part of the article I mentioned that debugging is done through the structural error handling mechanism (SEH)? Now we will look at it in more detail.
Most of the exceptions in the debugging process are imposed. That is, getting an exception does not mean that an error occurred in the program itself. Most likely the exception occurred due to the intervention of the debugger in the application, for example, by installing BP.
Nuance: If an error occurs in the application itself, we will also receive it as a debugging exception and we will need to implement the debugger code so that we can distinguish our induced errors from user errors.
Usually, the debugger provides three mechanisms for working with BP (well, if you do not take into account BP to load the module, because in fact this feature is not a classic BP).
- Standard BP per line of code.
- BP to memory address (Memory Breakpoint or truncated Data Preakpoint in Delphi).
- Hardware BP (not in Delphi).
To work with them, it suffices to handle three types of exceptions:
EXCEPTION_DEBUG_EVENT: begin ThreadIndex := GetThreadIndex(DebugEvent.dwThreadId); case DebugEvent.Exception.ExceptionRecord.ExceptionCode of EXCEPTION_BREAKPOINT: ProcessExceptionBreakPoint(ThreadIndex, DebugEvent); EXCEPTION_SINGLE_STEP: ProcessExceptionSingleStep(ThreadIndex, DebugEvent); EXCEPTION_GUARD_PAGE: ProcessExceptionGuardPage(ThreadIndex, DebugEvent); else CallUnhandledExceptionEvents(ThreadIndex, CodeDataToExceptionCode( DebugEvent.Exception.ExceptionRecord.ExceptionCode), DebugEvent); end; end; In order to make it clearer why these three exceptions are enough, you first need to consider the mechanism for setting each type of BP before proceeding to the analysis of the logic for handling the EXCEPTION_DEBUG_EVENT event.
Implementing a breakpoint on a line of code:
Installing BP on a line of code is done by modifying the code of the application being debugged. Classically, this is done by recording the opcode 0xCC at the address set by BP, meaning the instruction "INT3".
There are other options, such as opcode 0xCD03, which is also the instruction "INT3". The second option is used more with anti-debugging and is installed in most cases by the application itself, trying to catch the presence of a debugger on the fact that the nuclear _KiTrap03 () can work only with a single-byte opcode and slightly incorrectly processes the two-byte one.
But, all this lyrics, we are interested in exactly the first opcode.
The TFWDebugerCore class uses the following structures to store the list of installed BPs:
// ( ) TBreakpointType = ( btBreakpoint, // WriteProcessMemoryEx + 0xCC btMemoryBreakpoint // VirtualProtectEx + PAGE_GUARD ); // TInt3Breakpoint = record Address: Pointer; ByteCode: Byte; end; TMemotyBreakPoint = record Address: Pointer; Size: DWORD; BreakOnWrite: Boolean; RegionStart: Pointer; RegionSize: DWORD; PreviosRegionProtect: DWORD; end; TBreakpoint = packed record bpType: TBreakpointType; Description: ShortString; Active: Boolean; case Integer of 0: (Int3: TInt3Breakpoint;); 1: (Memory: TMemotyBreakPoint); end; TBreakpointList = array of TBreakpoint; Before adding a new BP, he initializes the TBreakpoint entry, filling it with the necessary parameters, and then adds it to the general list of breakpoints.
For BP per line of code, we need to store only two values, the address of the BP and the value of the byte stored at this address before we fill it with the opcode 0xCC.
Installing BP in the application being debugged looks like this:
function TFWDebugerCore.SetBreakpoint(Address: DWORD; const Description: string): Boolean; var Breakpoint: TBreakpoint; OldProtect: DWORD; Dummy: DWORD; begin ZeroMemory(@Breakpoint, SizeOf(TBreakpoint)); Breakpoint.bpType := btBreakpoint; Breakpoint.Int3.Address := Pointer(Address); Breakpoint.Description := Description; Check(VirtualProtectEx(FProcessInfo.AttachedProcessHandle, Pointer(Address), 1, PAGE_READWRITE, OldProtect)); try Check(ReadProcessMemory(FProcessInfo.AttachedProcessHandle, Pointer(Address), @Breakpoint.Int3.ByteCode, 1, Dummy)); Check(WriteProcessMemory(FProcessInfo.AttachedProcessHandle, Pointer(Address), @BPOpcode, 1, Dummy)); finally Check(VirtualProtectEx(FProcessInfo.AttachedProcessHandle, Pointer(Address), 1, OldProtect, OldProtect)); end; Result := AddNewBreakPoint(Breakpoint); end; , , . , , , , , 0xCC BPOpcode VirtualProtectEx(). , , .
:
, «INT3». EXCEPTION_DEBUG_EVENT EXCEPTION_BREAKPOINT.
DebugEvent.Exception.ExceptionRecord (EXCEPTION_DEBUG_INFO structure).
, , , ?
. DebugEvent.Exception.ExceptionRecord.ExceptionAddress Address btBreakpoint, , - .
, ( , ) .
:
.
:

:

.
, TBreakpoint Active, . TFWDebugerCore , ToggleInt3Breakpoint, .
procedure TFWDebugerCore.ToggleInt3Breakpoint(Index: Integer; Active: Boolean); var OldProtect: DWORD; Dummy: DWORD; begin CheckBreakpointIndex(Index); if FBreakpointList[Index].bpType <> btBreakpoint then Exit; if FBreakpointList[Index].Active = Active then Exit; Check(VirtualProtectEx(FProcessInfo.AttachedProcessHandle, FBreakpointList[Index].Int3.Address, 1, PAGE_READWRITE, OldProtect)); try if Active then Check(WriteProcessMemory(FProcessInfo.AttachedProcessHandle, FBreakpointList[Index].Int3.Address, @BPOpcode, 1, Dummy)) else Check(WriteProcessMemory(FProcessInfo.AttachedProcessHandle, FBreakpointList[Index].Int3.Address, @FBreakpointList[Index].Int3.ByteCode, 1, Dummy)); finally Check(VirtualProtectEx(FProcessInfo.AttachedProcessHandle, FBreakpointList[Index].Int3.Address, 1, OldProtect, OldProtect)); end; FBreakpointList[Index].Active := Active; end; , (.. ).
: , . «INT3» , 0x452220, 0x452221, «mov ebp, esp», .
: : « — „push ebp“, , — ©». - , .
, , , , , ( , ) .
:
, .
, « NOP». , - , NOP ( ) 0x90. , . — .
, :
NOP ( $0F, $1F, $00) :
asm db $0F, $1F, $00 xor eax, eax inc eax neg eax end; :

, .
, . , , «jmp +1» . — .
, :
asm db $EB, $01 // jmp +1 ( xor " ") db $B8 // "" xor eax, eax // inc eax neg eax not eax sub edx, eax imul eax, edx nop nop end; :

, .
, : 0x452220, , «push $00452245».
, «push epb» . , , , , , , :

Those. «push $00452245» «inc epb» «and al, [ebp+$00]», . - , — .
, . , , EIP (Extended Instruction Pointer). , . EIP GetThreadContext, Context.Eip, SetThreadContext.
: EXCEPTION_DEBUG_EVENT ID DebugEvent.dwThreadId, GetThreadContext() SetThreadContext() , ID . OpenThread, , , ThreadID = ThreadHandle.
, , , . , 0xCC , ? , , , .
, - , . , .
, , , , .. .
.
TF . , «INT1», EXCEPTION_DEBUG_EVENT EXCEPTION_SINGLE_STEP.
, EIP. Context.EFlags. TF . Those. :
const EFLAGS_TF = $100; // 8- ... Context.EFlags := Context.EFlags or EFLAGS_TF; : «INT1» TF . Those. , , TF . , , EXCEPTION_SINGLE_STEP TF . .
, :
- , .
- 0xCC .
- EXCEPTION_BREAKPOINT,
- EIP TF
- EXCEPTION_SINGLE_STEP
- 0xCC .
F7 Delphi :)
TFWDebugerCore.
EXCEPTION_BREAKPOINT:
procedure TFWDebugerCore.ProcessExceptionBreakPoint(ThreadIndex: Integer; DebugEvent: TDebugEvent); var ReleaseBP: Boolean; BreakPointIndex: Integer; begin ReleaseBP := False; BreakPointIndex := GetBPIndex( DWORD(DebugEvent.Exception.ExceptionRecord.ExceptionAddress)); if BreakPointIndex >= 0 then begin if Assigned(FBreakPoint) then FBreakPoint(Self, ThreadIndex, DebugEvent.Exception.ExceptionRecord, BreakPointIndex, ReleaseBP) else CallUnhandledExceptionEvents(ThreadIndex, ecBreakpoint, DebugEvent); ToggleInt3Breakpoint(BreakPointIndex, False); SetSingleStepMode(ThreadIndex, True); if ReleaseBP then RemoveBreakpoint(BreakPointIndex) else FRestoreBPIndex := BreakPointIndex; end else CallUnhandledExceptionEvents(ThreadIndex, ecBreakpoint, DebugEvent); end; ExceptionAddress.
.
ToggleInt3Breakpoint.
EIP SetSingleStepMode.
— RemoveBreakpoint.
, EXCEPTION_SINGLE_STEP, .
SetSingleStepMode :
procedure TFWDebugerCore.SetSingleStepMode(ThreadIndex: Integer; RestoreEIPAfterBP: Boolean); var Context: TContext; begin ZeroMemory(@Context, SizeOf(TContext)); Context.ContextFlags := CONTEXT_FULL; Check(GetThreadContext(FThreadList[ThreadIndex].ThreadHandle, Context)); if RestoreEIPAfterBP then Dec(Context.Eip); Context.EFlags := Context.EFlags or EFLAGS_TF; Check(SetThreadContext(FThreadList[ThreadIndex].ThreadHandle, Context)); end; , , CONTEXT_FULL.
EIP
TF .
.
RemoveBreakpoint :
procedure TFWDebugerCore.RemoveBreakpoint(Index: Integer); var Len: Integer; begin ToggleBreakpoint(Index, False); Len := BreakpointCount; if Len = 1 then SetLength(FBreakpointList, 0) else begin FBreakpointList[Index] := FBreakpointList[Len - 1]; SetLength(FBreakpointList, Len - 1); end; end; .
EXCEPTION_SINGLE_STEP , .. . , .
:
. Memory Breakpoint ( MBP).
: , . (. -: ). MBP , PAGE_GUARD VirtualProtectEx.
: , VirtualProtectEx , , . . , .
: MBP . : MBP Protect , , MBP. MBP . TFWDebugerCore . MBP , MBP . , PreviosRegionProtect, , VirtualProtectEx.
:
function TFWDebugerCore.SetMemoryBreakpoint(Address: Pointer; Size: DWORD; BreakOnWrite: Boolean; const Description: string): Boolean; var Breakpoint: TBreakpoint; MBI: TMemoryBasicInformation; Index: Integer; begin Index := GetMBPIndex(DWORD(Address)); if (Index >= 0) and (FBreakpointList[Index].bpType = btMemoryBreakpoint) then begin MBI.BaseAddress := FBreakpointList[Index].Memory.RegionStart; MBI.RegionSize := FBreakpointList[Index].Memory.RegionSize; MBI.Protect := FBreakpointList[Index].Memory.PreviosRegionProtect; end else Check(VirtualQueryEx(DebugProcessData.AttachedProcessHandle, Address, MBI, SizeOf(TMemoryBasicInformation)) > 0); ZeroMemory(@Breakpoint, SizeOf(TBreakpoint)); Breakpoint.bpType := btMemoryBreakpoint; Breakpoint.Description := ShortString(Description); Breakpoint.Memory.Address := Address; Breakpoint.Memory.Size := Size; Breakpoint.Memory.BreakOnWrite := BreakOnWrite; Breakpoint.Memory.RegionStart := MBI.BaseAddress; Breakpoint.Memory.RegionSize := MBI.RegionSize; Check(VirtualProtectEx(FProcessInfo.AttachedProcessHandle, Address, Size, MBI.Protect or PAGE_GUARD, Breakpoint.Memory.PreviosRegionProtect)); if Index >= 0 then Breakpoint.Memory.PreviosRegionProtect := MBI.Protect; Result := AddNewBreakPoint(Breakpoint); end; MBP , . , — BreakOnWrite, ( ). .
. EXCEPTION_DEBUG_EVENT EXCEPTION_GUARD_PAGE.
- . PAGE_GUARD , . . . , EXCEPTION_GUARD_PAGE , , , PAGE_GUARD .
:
procedure TFWDebugerCore.ProcessExceptionGuardPage(ThreadIndex: Integer; DebugEvent: TDebugEvent); var CurrentMBPIndex: Integer; function CheckWriteMode: Boolean; begin Result := not FBreakpointList[CurrentMBPIndex].Memory.BreakOnWrite; if not Result then Result := DebugEvent.Exception.ExceptionRecord.ExceptionInformation[0] = 1; end; var MBPIndex: Integer; ReleaseMBP: Boolean; dwGuardedAddr: DWORD; begin ReleaseMBP := False; dwGuardedAddr := DebugEvent.Exception.ExceptionRecord.ExceptionInformation[1]; MBPIndex := GetMBPIndex(dwGuardedAddr); if MBPIndex >= 0 then begin CurrentMBPIndex := MBPIndex; while not CheckIsAddrInRealMemoryBPRegion(CurrentMBPIndex, dwGuardedAddr) do begin CurrentMBPIndex := GetMBPIndex(dwGuardedAddr, CurrentMBPIndex + 1); if CurrentMBPIndex < 0 then Break; end; if CurrentMBPIndex >= 0 then begin MBPIndex := CurrentMBPIndex; if Assigned(FBreakPoint) and CheckWriteMode then FBreakPoint(Self, ThreadIndex, DebugEvent.Exception.ExceptionRecord, MBPIndex, ReleaseMBP) else CallUnhandledExceptionEvents(ThreadIndex, ecGuard, DebugEvent); end else CallUnhandledExceptionEvents(ThreadIndex, ecGuard, DebugEvent); FBreakpointList[MBPIndex].Active := False; SetSingleStepMode(ThreadIndex, False); if ReleaseMBP then RemoveBreakpoint(MBPIndex) else FRestoreMBPIndex := MBPIndex; end else CallUnhandledExceptionEvents(ThreadIndex, ecGuard, DebugEvent); end; - . ExceptionRecord.ExceptionInformation , . , — .
CheckIsAddrInRealMemoryBPRegion .
, BreakOnWrite.
ExceptionInformation. BreakOnWrite , ExceptionInformation , , BreakOnWrite , .
, , EIP. SetSingleStepMode False.
EXCEPTION_SINGLE_STEP FRestoreMBPIndex.
:
procedure TFWDebugerCore.ToggleMemoryBreakpoint(Index: Integer; Active: Boolean); var Dummy: DWORD; begin CheckBreakpointIndex(Index); if FBreakpointList[Index].bpType <> btMemoryBreakpoint then Exit; if FBreakpointList[Index].Active = Active then Exit; if Active then Check(VirtualProtectEx(FProcessInfo.AttachedProcessHandle, FBreakpointList[Index].Memory.Address, FBreakpointList[Index].Memory.Size, FBreakpointList[Index].Memory.PreviosRegionProtect or PAGE_GUARD, Dummy)) else Check(VirtualProtectEx(FProcessInfo.AttachedProcessHandle, FBreakpointList[Index].Memory.Address, FBreakpointList[Index].Memory.Size, FBreakpointList[Index].Memory.PreviosRegionProtect, Dummy)); FBreakpointList[Index].Active := Active; end; - .
- , , . .
, . EIP . , Delphi .
. .
:
Hardware BreakPoint ( HBP). . . , , .
.
:
— ( )
— /.
— , , /, IO ( /) .
Those. ( ) ( — /). , .. 1, 2 4 .
, DR , CONTEXT_DEBUG_REGISTERS.
. Dr0..Dr3, Dr6, Dr7. (Dr4 Dr5 ).
4 . Dr7 . Dr6 .
TFWDebugerCore :
THWBPIndex = 0..3; THWBPSize = (hsByte, hdWord, hsDWord); THWBPMode = (hmExecute, hmWrite, hmIO, hmReadWrite); THardwareBreakpoint = packed record Address: array [THWBPIndex] of Pointer; Size: array [THWBPIndex] of THWBPSize; Mode: array [THWBPIndex] of THWBPMode; Description: array [THWBPIndex] of ShortString; Active: array [THWBPIndex] of Boolean; end; 4 , .
ID = hThreadHandle. :
TThreadData = record ThreadID: DWORD; ThreadHandle: THandle; Breakpoint: THardwareBreakpoint; end; TThreadList = array of TThreadData; Those. , .
, .
:
procedure TFWDebugerCore.SetHardwareBreakpoint(ThreadIndex: Integer; Address: Pointer; Size: THWBPSize; Mode: THWBPMode; HWIndex: THWBPIndex; const Description: string); begin if ThreadIndex < 0 then Exit; FThreadList[ThreadIndex].Breakpoint.Address[HWIndex] := Address; FThreadList[ThreadIndex].Breakpoint.Size[HWIndex] := Size; FThreadList[ThreadIndex].Breakpoint.Mode[HWIndex] := Mode; FThreadList[ThreadIndex].Breakpoint.Description[HWIndex] := ShortString(Description); FThreadList[ThreadIndex].Breakpoint.Active[HWIndex] := True; UpdateHardwareBreakpoints(ThreadIndex); end; UpdateHardwareBreakpoints.
:
procedure TFWDebugerCore.ToggleHardwareBreakpoint(ThreadIndex: Integer; Index: THWBPIndex; Active: Boolean); begin if ThreadIndex < 0 then Exit; if FThreadList[ThreadIndex].Breakpoint.Active[Index] = Active then Exit; FThreadList[ThreadIndex].Breakpoint.Active[Index] := Active; UpdateHardwareBreakpoints(ThreadIndex); end; Active UpdateHardwareBreakpoints.
:
procedure TFWDebugerCore.DropHardwareBreakpoint(ThreadIndex: Integer; Index: THWBPIndex); begin if ThreadIndex < 0 then Exit; if FThreadList[ThreadIndex].Breakpoint.Address[Index] = nil then Exit; FThreadList[ThreadIndex].Breakpoint.Address[Index] := nil; UpdateHardwareBreakpoints(ThreadIndex); end; UpdateHardwareBreakpoints.
UpdateHardwareBreakpoints.
Dr0-Dr3 Dr7.
- .
, :
4 (31-28) Dr3.
It looks like this:
2 (LENi) .
00 — 1
01 — 2
10 — .
11 — 4
2 (RWi) 4
00 — Execute
01 — Write
10 — IO Read/Write
11 — Read/Write
, Dr3 4 , Dr3, 4 Dr7 1101.
4 (27-24) Dr2
23-20 Dr1 , , 19-16 Dr0.
13 Dr7 (GD — Global Debug Register Access Detect) — . , .
9 Dr7 (GE — Global Exact data breakpoint match) — .
8 Dr7 (LE — Local Exact data breakpoint match) — .
LE , .
8 (7-0) Gi Li HBP .
7 (Gi — Global breakpoint enable) — Dr3
6 (Li — Local breakpoint enable) — Dr3
5- 4 Dr2
3- 2 Dr1 1-0 Dr0
?
:

.
procedure TFWDebugerCore.UpdateHardwareBreakpoints(ThreadIndex: Integer); const DR7_SET_LOC_DR0 = $01; DR7_SET_GLB_DR0 = $02; DR7_SET_LOC_DR1 = $04; DR7_SET_GLB_DR1 = $08; DR7_SET_LOC_DR2 = $10; DR7_SET_GLB_DR2 = $20; DR7_SET_LOC_DR3 = $40; DR7_SET_GLB_DR3 = $80; DR7_SET_LOC_ON = $100; DR7_SET_GLB_ON = $200; DR7_PROTECT = $2000; DR_SIZE_BYTE = 0; DR_SIZE_WORD = 1; DR_SIZE_DWORD = 3; DR_MODE_E = 0; DR_MODE_W = 1; DR_MODE_I = 2; DR_MODE_R = 3; DR7_MODE_DR0_E = DR_MODE_E shl 16; DR7_MODE_DR0_W = DR_MODE_W shl 16; DR7_MODE_DR0_I = DR_MODE_I shl 16; DR7_MODE_DR0_R = DR_MODE_R shl 16; DR7_SIZE_DR0_B = DR_SIZE_BYTE shl 18; DR7_SIZE_DR0_W = DR_SIZE_WORD shl 18; DR7_SIZE_DR0_D = DR_SIZE_DWORD shl 18; DR7_MODE_DR1_E = DR_MODE_E shl 20; DR7_MODE_DR1_W = DR_MODE_W shl 20; DR7_MODE_DR1_I = DR_MODE_I shl 20; DR7_MODE_DR1_R = DR_MODE_R shl 20; DR7_SIZE_DR1_B = DR_SIZE_BYTE shl 22; DR7_SIZE_DR1_W = DR_SIZE_WORD shl 22; DR7_SIZE_DR1_D = DR_SIZE_DWORD shl 22; DR7_MODE_DR2_E = DR_MODE_E shl 24; DR7_MODE_DR2_W = DR_MODE_W shl 24; DR7_MODE_DR2_I = DR_MODE_I shl 24; DR7_MODE_DR2_R = DR_MODE_R shl 24; DR7_SIZE_DR2_B = DR_SIZE_BYTE shl 26; DR7_SIZE_DR2_W = DR_SIZE_WORD shl 26; DR7_SIZE_DR2_D = DR_SIZE_DWORD shl 26; DR7_MODE_DR3_E = DR_MODE_E shl 28; DR7_MODE_DR3_W = DR_MODE_W shl 28; DR7_MODE_DR3_I = DR_MODE_I shl 28; DR7_MODE_DR3_R = DR_MODE_R shl 28; DR7_SIZE_DR3_B = DR_SIZE_BYTE shl 30; DR7_SIZE_DR3_W = DR_SIZE_WORD shl 30; DR7_SIZE_DR3_D = $C0000000; //DR_SIZE_DWORD shl 30; DR_On: array [THWBPIndex] of DWORD = ( DR7_SET_LOC_DR0, DR7_SET_LOC_DR1, DR7_SET_LOC_DR2, DR7_SET_LOC_DR3 ); DR_Mode: array [THWBPIndex] of array [THWBPMode] of DWORD = ( (DR7_MODE_DR0_E, DR7_MODE_DR0_W, DR7_MODE_DR0_I, DR7_MODE_DR0_R), (DR7_MODE_DR1_E, DR7_MODE_DR1_W, DR7_MODE_DR1_I, DR7_MODE_DR1_R), (DR7_MODE_DR2_E, DR7_MODE_DR2_W, DR7_MODE_DR2_I, DR7_MODE_DR2_R), (DR7_MODE_DR3_E, DR7_MODE_DR3_W, DR7_MODE_DR3_I, DR7_MODE_DR3_R) ); DR_Size: array [THWBPIndex] of array [THWBPSize] of DWORD = ( (DR7_SIZE_DR0_B, DR7_SIZE_DR0_W, DR7_SIZE_DR0_D), (DR7_SIZE_DR1_B, DR7_SIZE_DR1_W, DR7_SIZE_DR1_D), (DR7_SIZE_DR2_B, DR7_SIZE_DR2_W, DR7_SIZE_DR2_D), (DR7_SIZE_DR3_B, DR7_SIZE_DR3_W, DR7_SIZE_DR3_D) ); var Context: TContext; I: THWBPIndex; begin if ThreadIndex < 0 then Exit; ZeroMemory(@Context, SizeOf(TContext)); Context.ContextFlags := CONTEXT_DEBUG_REGISTERS; for I := 0 to 3 do begin if not FThreadList[ThreadIndex].Breakpoint.Active[I] then Continue; if FThreadList[ThreadIndex].Breakpoint.Address[I] <> nil then begin Context.Dr7 := Context.Dr7 or DR7_SET_LOC_ON; case I of 0: Context.Dr0 := DWORD(FThreadList[ThreadIndex].Breakpoint.Address[I]); 1: Context.Dr1 := DWORD(FThreadList[ThreadIndex].Breakpoint.Address[I]); 2: Context.Dr2 := DWORD(FThreadList[ThreadIndex].Breakpoint.Address[I]); 3: Context.Dr3 := DWORD(FThreadList[ThreadIndex].Breakpoint.Address[I]); end; Context.Dr7 := Context.Dr7 or DR_On[I]; Context.Dr7 := Context.Dr7 or DR_Mode[I, FThreadList[ThreadIndex].Breakpoint.Mode[I]]; Context.Dr7 := Context.Dr7 or DR_Size[I, FThreadList[ThreadIndex].Breakpoint.Size[I]]; end; end; Check(SetThreadContext(FThreadList[ThreadIndex].ThreadHandle, Context)); end; , , Dr7 .
Context.Dr7 := Context.Dr7 or DR_On[I]; Context.Dr7 := Context.Dr7 or DR_Mode[I, FThreadList[ThreadIndex].Breakpoint.Mode[I]]; Context.Dr7 := Context.Dr7 or DR_Size[I, FThreadList[ThreadIndex].Breakpoint.Size[I]]; LE DR7_SET_LOC_ON.
.
EXCEPTION_BREAKPOINT.
EXCEPTION_GUARD_PAGE.
EXCEPTION_DEBUG_EVENT EXCEPTION_SINGLE_STEP, ( ).
EXCEPTION_SINGLE_STEP :
function TFWDebugerCore.ProcessHardwareBreakpoint(ThreadIndex: Integer; DebugEvent: TDebugEvent): Boolean; var Index: Integer; Context: TContext; ReleaseBP: Boolean; begin ZeroMemory(@Context, SizeOf(TContext)); Context.ContextFlags := CONTEXT_DEBUG_REGISTERS; Check(GetThreadContext(FThreadList[ThreadIndex].ThreadHandle, Context)); Result := Context.Dr6 and $F <> 0; if not Result then Exit; Index := -1; if Context.Dr6 and 1 <> 0 then Index := 0; if Context.Dr6 and 2 <> 0 then Index := 1; if Context.Dr6 and 4 <> 0 then Index := 2; if Context.Dr6 and 8 <> 0 then Index := 3; if Index < 0 then begin Result := False; Exit; end; ReleaseBP := False; if Assigned(FHardwareBreakpoint) then FHardwareBreakpoint(Self, ThreadIndex, DebugEvent.Exception.ExceptionRecord, Index, ReleaseBP); ToggleHardwareBreakpoint(ThreadIndex, Index, False); SetSingleStepMode(ThreadIndex, False); if ReleaseBP then DropHardwareBreakpoint(ThreadIndex, Index) else begin // HWBP , // .. // ProcessExceptionSingleStep, HWBP // HWBP if (FRestoredThread >= 0) and (FRestoredHWBPIndex >= 0) then ToggleHardwareBreakpoint(FRestoredThread, FRestoredHWBPIndex, True); FRestoredHWBPIndex := Index; FRestoredThread := ThreadIndex; end; end; , .
Dr6 .
4 1 , DrX .
, , , ( EIP) , , EXCEPTION_SINGLE_STEP .
, .
EXCEPTION_SINGLE_STEP.
:
procedure TFWDebugerCore.ProcessExceptionSingleStep(ThreadIndex: Integer; DebugEvent: TDebugEvent); var Handled: Boolean; begin // HWBP Handled := ProcessHardwareBreakpoint(ThreadIndex, DebugEvent); // - HWPB HWBP if not Handled and (FRestoredThread >= 0) and (FRestoredHWBPIndex >= 0) then begin ToggleHardwareBreakpoint(FRestoredThread, FRestoredHWBPIndex, True); FRestoredThread := -1; FRestoredHWBPIndex := -1; end; // if FRestoreBPIndex >= 0 then begin CheckBreakpointIndex(FRestoreBPIndex); if FBreakpointList[FRestoreBPIndex].bpType = btBreakpoint then ToggleInt3Breakpoint(FRestoreBPIndex, True); FRestoreBPIndex := -1; end; // M if FRestoreMBPIndex >= 0 then begin CheckBreakpointIndex(FRestoreMBPIndex); if FBreakpointList[FRestoreMBPIndex].bpType = btMemoryBreakpoint then ToggleMemoryBreakpoint(FRestoreMBPIndex, True); FRestoreMBPIndex := -1; end; // // if ResumeAction <> raRun then begin CallUnhandledExceptionEvents(ThreadIndex, ecSingleStep, DebugEvent); // DoResumeAction(ThreadIndex); end; end; , . , ToggleHardwareBreakpoint .
, FRestoreBPIndex FRestoreMBPIndex , .
ToggleInt3Breakpoint ToggleMemoryBreakpoint.
:
, — , .
: « » :)
.
— . VCL , «test_app», .
— . , ( ) TMemo TRichEdit, .
We write:
type TdlgDebuger = class(TForm) Panel1: TPanel; btnStart: TButton; btnStop: TButton; edLog: TRichEdit; procedure btnStartClick(Sender: TObject); procedure btnStopClick(Sender: TObject); private FCore: TFWDebugerCore; FNeedStop: Boolean; procedure Writeln(const Value: string = ''); end; ... procedure TdlgDebuger.btnStartClick(Sender: TObject); var Path: string; begin FNeedStop := False; // Path := ExtractFilePath(ParamStr(0)) + '..\test_app\test_app.exe'; FCore := TFWDebugerCore.Create(50); try btnStart.Enabled := False; btnStop.Enabled := True; if not FCore.DebugNewProcess(Path, True) then RaiseLastOSError; FCore.RunMainLoop; finally FCore.Free; btnStart.Enabled := True; btnStop.Enabled := False; end; Writeln; Writeln('Debug stop'); end; procedure TdlgDebuger.Writeln(const Value: string); begin edLog.Lines.Add(Value); end; procedure TdlgDebuger.btnStopClick(Sender: TObject); begin FNeedStop := True; end; - :

«Start», .
.
, TFWDebugerCore.RunMainLoop, .
, .
, ( — ) OnIdle TFWDebugerCore, :
procedure TdlgDebuger.OnIdle(Sender: TObject); begin if FNeedStop then FCore.StopDebug else Application.ProcessMessages; end; Application.ProcessMessages .
, Delphi. OnCreateProcess OnLoadDll.
:
procedure TdlgDebuger.OnCreateProcess(Sender: TObject; ThreadIndex: Integer; Data: TCreateProcessDebugInfo); var T: TThreadData; begin T := FCore.GetThreadData(ThreadIndex); Writeln(Format('CreateThread ID: %d', [T.ThreadID])); Writeln(Format('ProcessStart ID: %d', [FCore.DebugProcessData.ProcessID])); end; :
procedure TdlgDebuger.OnLoadDll(Sender: TObject; ThreadIndex: Integer; Data: TLoadDLLDebugInfo); const FormatStrKnownDLL = 'Load Dll at instance %p handle %d "%s"'; FormatStrUnknownDLL = 'Load unknown Dll at instance %p handle %d'; var DllName: AnsiString; IsUnicodeData: Boolean; begin FCore.ContinueStatus := DBG_EXCEPTION_NOT_HANDLED; IsUnicodeData := Data.fUnicode = 1; DllName := FCore.GetDllName(Data.lpImageName, Data.lpBaseOfDll, IsUnicodeData); if DllName <> '' then begin if IsUnicodeData then Writeln(Format(FormatStrKnownDLL, [Data.lpBaseOfDll, Data.hFile, PWideChar(@DllName[1])])) else Writeln(Format(FormatStrKnownDLL, [Data.lpBaseOfDll, Data.hFile, PAnsiChar(@DllName[1])])); end else Writeln(Format(FormatStrUnknownDLL, [Data.lpBaseOfDll, Data.hFile])); end; «Start»
:

— .
:
. , TF , MBP. 40 . :

, / . . DebugNewProcess. True, . OnBreakPoint .
procedure TdlgDebuger.OnBreakPoint(Sender: TObject; ThreadIndex: Integer; ExceptionRecord: Windows.TExceptionRecord; BreakPointIndex: Integer; var ReleaseBreakpoint: Boolean); begin // Writeln(Format('!!! --> Breakpoint "%s"', [FCore.BreakpointItem(BreakPointIndex).Description])); // ( ) ReleaseBreakpoint := True; // FCore.ResumeAction := raTraceInto; // FStepCount := 0; end; OnSingleStep, :
procedure TdlgDebuger.OnSingleStep(Sender: TObject; ThreadIndex: Integer; ExceptionRecord: Windows.TExceptionRecord); begin // Inc(FStepCount); Writeln(Format('!!! --> trace step №%d at addr 0x%p', [FStepCount, ExceptionRecord.ExceptionAddress])); // if FStepCount > 10 then FCore.ResumeAction := raRun else FCore.ResumeAction := raTraceInto; end; :

StepIn, , 0x00409FF4, _InitExe(), 0x00409C53. , _InitExe(), , .
— .
, OnPageGuard , SetMemoryBreakpoint . , OnBreakPoint . , , RemoveBreakpoint ( ), // , ReleaseBreakpoint , RemoveCurrentBreakpoint . TFWDebugerCore , .
, , , .
:
, OutputDebugString. :
// // // ============================================================================= procedure TForm1.btnDebugStringClick(Sender: TObject); begin OutputDebugString('Test debug string'); end; OnDebugString, :
procedure TdlgDebuger.OnDebugString(Sender: TObject; ThreadIndex: Integer; Data: TOutputDebugStringInfo); begin if Data.fUnicode = 1 then Writeln('DebugString: ' + PWideChar(FCore.ReadStringW(Data.lpDebugStringData, Data.nDebugStringLength))) else Writeln('DebugString: ' + PAnsiChar(FCore.ReadStringA(Data.lpDebugStringData, Data.nDebugStringLength))); end; , . «Test debug string» ? , :)
:
? - . :
// // // ============================================================================= procedure TForm1.btnExceptClick(Sender: TObject); begin try asm int 3 end; ShowMessage('Debugger detected.'); except ShowMessage('Debugger not found.'); end; end; , .
: , ContinueStatus, ContinueDebugEvent, DBG_CONTINUE. What does this mean? .
: «INT3» . , exception..end, . , .
, , — .
, OnUnknownBreakPoint (int3 — , , ). :
procedure TdlgDebuger.OnUnknownBreakPoint(Sender: TObject; ThreadIndex: Integer; ExceptionRecord: Windows.TExceptionRecord); var ApplicationBP: Boolean; begin ApplicationBP := (DWORD(ExceptionRecord.ExceptionAddress) > FCore.DebugProcessData.EntryPoint) and (DWORD(ExceptionRecord.ExceptionAddress) < $500000); Writeln; if ApplicationBP then begin Writeln(Format('!!! --> Unknown application breakpoint at addr 0X%p', [ExceptionRecord.ExceptionAddress])); Writeln('!!! --> Exception not handled.'); FCore.ContinueStatus := DBG_EXCEPTION_NOT_HANDLED; end else begin Writeln(Format('!!! --> Unknown breakpoint at addr 0X%p', [ExceptionRecord.ExceptionAddress])); Writeln('!!! --> Exception handled.'); FCore.ContinueStatus := DBG_CONTINUE; end; Writeln; end; , , ( $500000). — - . , , DBG_EXCEPTION_NOT_HANDLED, , - .
, , , :)
:
, , . , :
// // // ============================================================================= procedure TForm1.btnKillStackClick(Sender: TObject); procedure T; var HugeBuff: array [0..10000] of DWORD; begin if HugeBuff[0] <> HugeBuff[10000] then Inc(HugeBuff[0]); T; end; begin try T; except T; end; end; . , — . ? , , , PAGE_GUARD. , - , , . EXCEPTION_STACK_OVERFLOW. « » , . , PAGE_GUARD , , - . , EXCEPTION_ACCESS_VIOLATION - «», , DBG_CONTROL_C ( AV).
OnUnknownException, .. TFWDebugerCore . :
procedure TdlgDebuger.OnUnknownException(Sender: TObject; ThreadIndex: Integer; ExceptionRecord: Windows.TExceptionRecord); var Cause: string; begin Writeln; case ExceptionRecord.ExceptionCode of EXCEPTION_STACK_OVERFLOW: begin Writeln('!!! --> Stack overflow detected. Probe to continue.'); FCore.ContinueStatus := DBG_CONTINUE; end; EXCEPTION_ACCESS_VIOLATION: begin { The first element of the array contains a read-write flag that indicates the type of operation that caused the access violation. If this value is zero, the thread attempted to read the inaccessible data. If this value is 1, the thread attempted to write to an inaccessible address. If this value is 8, the thread causes a user-mode data execution prevention (DEP) violation. The second array element specifies the virtual address of the inaccessible data. } case ExceptionRecord.ExceptionInformation[0] of 0: Cause := 'read'; 1: Cause := 'write'; 8: Cause := 'DEP violation'; else Cause := 'unknown cause'; end; Writeln(Format('!!! --> Access violation at addr 0x%p %s of address 0x%p', [ ExceptionRecord.ExceptionAddress, Cause, Pointer(PDWORD(@ExceptionRecord.ExceptionInformation[1])^) ])); Writeln('!!! --> Process Stopped.'); FCore.ContinueStatus := DBG_CONTROL_C; end; else Writeln(Format('!!! --> Unknown exception code %p at addr 0x%p', [ Pointer(ExceptionRecord.ExceptionCode), ExceptionRecord.ExceptionAddress ])); end; Writeln; end; :

Summarizing:
. , .
, , , . , , .
, :)
: http://rouse.drkb.ru/blog/dbg_part2.zip
, :)
.
© (Rouse_)
, 2012
Source: https://habr.com/ru/post/178159/
All Articles