The technology maturity cycle for 2013 according to Gartner
The research company Gartner is well known in the IT analytics market. I would even say - is one of the leaders in this market. Every year she puts on a very interesting schedule, called the "Technology Maturity Cycle" (in English Hype cycle, or literally - the "hype cycle"). On this graph, in chronological order, the technologies are decomposed, which are either already ready for use or are just entering the research stage.
Here is the schedule for 2013 (made as of July 2012):

So, the schedule is divided into five parts. The first is “technological trigger”. Those. that time when the technology only begins the existence (at least in the form of idea). Stage two - "the peak of high expectations." Those. period of time when the public begins to learn about technology. At the top of this peak, everything is said about technology and at every corner, and even the tabloid press begins to write about it as an almost accomplished fact. Next comes the “abyss of disappointment” the time when it turns out that in reality technology allows you to do something different from what you wanted. Far from all are chosen from this abyss. And then comes the "slope of enlightenment" and "plateau of productivity", in fact - the last stages before the mass introduction.
')
In addition, the graph shows the approximate timing of technology implementation. White and blue circles - from 2 to 5 years before implementation. Blue circles - from 5 to 10 years. Yellow triangles are more than 10 years old, and crossed out red circles are what died without reaching the consumer.
As you can see, voice recognition systems (hi Siri and Google Now), biometric human recognition systems and media tablets (hi Amazon Kindle) have almost reached the mass introduction. In the abyss are virtual worlds (until Second Live) and home health monitors. At the peak of expectations, 3D printing, BYOD and wireless energy transfer rule (by the way, another wireless technology - payment of bills via NFC began to descend and rushes to the “abyss”). On the approach to the “peak” there are gamification, Big data and others, and holographic displays, 3D printing of organs and quantum computers are just beginning their ascent.
As usual, it is interesting to compare how these graphs looked in the past. Here, the maturity cycle of the sample in 2011 ( in Russian / eng ). NFC payments were just at the peak of expectations.

And this is how it looked in 2006:
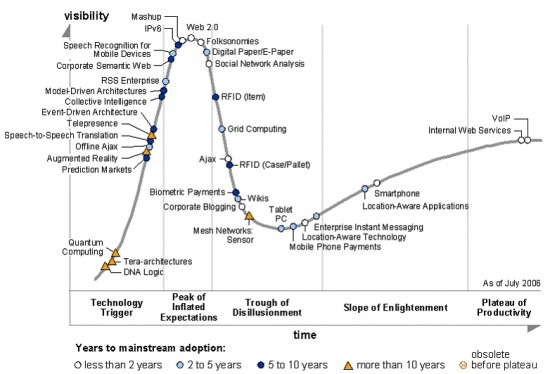
As you can see, the hits are pretty accurate. Therefore, these studies can be regarded as a vector of technologies. At least, they respond well to the question of when and what exactly we can see in the future.
Here is the schedule for 2013 (made as of July 2012):
So, the schedule is divided into five parts. The first is “technological trigger”. Those. that time when the technology only begins the existence (at least in the form of idea). Stage two - "the peak of high expectations." Those. period of time when the public begins to learn about technology. At the top of this peak, everything is said about technology and at every corner, and even the tabloid press begins to write about it as an almost accomplished fact. Next comes the “abyss of disappointment” the time when it turns out that in reality technology allows you to do something different from what you wanted. Far from all are chosen from this abyss. And then comes the "slope of enlightenment" and "plateau of productivity", in fact - the last stages before the mass introduction.
')
In addition, the graph shows the approximate timing of technology implementation. White and blue circles - from 2 to 5 years before implementation. Blue circles - from 5 to 10 years. Yellow triangles are more than 10 years old, and crossed out red circles are what died without reaching the consumer.
As you can see, voice recognition systems (hi Siri and Google Now), biometric human recognition systems and media tablets (hi Amazon Kindle) have almost reached the mass introduction. In the abyss are virtual worlds (until Second Live) and home health monitors. At the peak of expectations, 3D printing, BYOD and wireless energy transfer rule (by the way, another wireless technology - payment of bills via NFC began to descend and rushes to the “abyss”). On the approach to the “peak” there are gamification, Big data and others, and holographic displays, 3D printing of organs and quantum computers are just beginning their ascent.
As usual, it is interesting to compare how these graphs looked in the past. Here, the maturity cycle of the sample in 2011 ( in Russian / eng ). NFC payments were just at the peak of expectations.
And this is how it looked in 2006:
As you can see, the hits are pretty accurate. Therefore, these studies can be regarded as a vector of technologies. At least, they respond well to the question of when and what exactly we can see in the future.
Source: https://habr.com/ru/post/178059/
All Articles