We study the debugger, part one
I think you know that software is not cracked by some kind of mystical “hackers” - it is implemented by the same programmers as most people who read this article. At the same time, they use the same tools as the software developers themselves. Of course, with reservations, since for the most part the toolkit is quite specific, but, one way or another, a debugger is used in software analysis.
Since most of my articles are focused on people interested in applying protection in their software, I decided that submitting material with specific pieces of protection code (like those previously published) will only confuse the reader. It is much easier to start from the basics and slowly give new material on the already prepared base.
Therefore, this article will be considered one of the basic tools of the programmer - debugger.
Objectives of the article: consider the basic methods of working with the debugger, show its advanced and rarely used features, give an insight into the operation of the debugger mechanisms with examples and consider a certain set of countermeasures.
')
The volume of the article turned out unexpectedly large, so I divided it into three parts:
Actually, let's get started.
One of the most commonly used tools of the integrated debugger is a breakpoint (BreakPoint - hereafter BP). After installing BP, the program will work until it reaches a stopping point, after which its work will be interrupted and control will be transferred to the debugger.
The easiest way to install and remove BP is the F5 hot key (or its equivalent in the Debug-> Toggle breakpoint menu). There are other ways, but about them later.
After the program is stopped, we can examine the values of the local variables of the procedure in which the execution of the application was stopped, as well as analyze the stack of calls preceding the call of this procedure. Here we can change the values of these variables.
Where to put BP - of course there is no general answer. In fact, BP is designed to facilitate the study of the operation of the code, the correctness of which we are not sure of, or explicitly containing an error, which we cannot immediately detect.
It is much easier to set a stopping point and consistently execute each line of code than to spend hours studying the same code, trying to figure out where it started to work in a different way than we intended.
Let's consider the following example.
There is a task: to write code that will increase the value of the initially numbered variable by one 5 times and one more time by the number 123, after which it will display the result as a 10-bit and hexadecimal value. Expected values will be as follows: 128 and 00000080.
Let's say the code will be written with an error:
This code will output any values, but not the ones we wanted, because we did not initialize the variable “A” to zero. And since the variable "A" is local, it means that it is located on the stack, and we can never predict what value it will take at the beginning of this procedure. But we will assume that it is already the end of the working day, we are really tired (our eyes are blurred) and just forgot to write a line with variable initialization.
As a result, we have code that displays incorrect values, and we want to quickly understand the reason for this behavior. We put BP in the procedure body and run the program for execution:
It should look something like the picture. BP is set to Inc (A). At the bottom left you can observe the value of all local variables of the FormCreate procedure (the window is called “Local Variables”), namely, the Self variable (it is implicitly transmitted and always present in the class methods), the Sender parameter, and the local A variable itself. Its value is 19079581. On the left in the center in “WatchList” the value of the variable “B”.
Even a quick glance at the values of both variables and the three lines of code executed, we can understand that the value of the variable “A” does not correspond to the expected one. Since there had to be two increments per unit and another increase of 123, we had to see the value of the variable “A”, the number 125, and if there was a different value, it could mean only one thing - the initial value of the variable “A” was not true to.
To check the correctness of our assumption, let's change the current value of the variable “A” to the correct one and continue the program execution to check whether those results will return the procedure that was expected.
To change the values of variables in the debugger there are two tools.
The first one is “Evaluate / Modify”, it is called either via the menu or by pressing the “Ctrl + F7” hot key. This is a very simple tool with a minimum of functionality, it is most often used.
Looks like that:
To change the value of a variable in it, it is enough to specify a new value in the “New value” field and press the “Enter” key or the “Modify” button.
The second tool, Inspect, is also available through the Run menu or directly from the Evaluate / Modify dialog. This is a more advanced parameter editor, about it a bit later.
After changing the value of the variable "A", notice the changes in the list of values of local variables:
The variable "A" took the correct value, and now we can continue the execution of our application by pressing "F9" or through the menu by selecting the "Run" item. As a result of such intervention using the debugger, the procedure will give us the expected numbers 128 and 00000080, and we can safely correct the procedure code, since we found the cause of the error in it and checked its execution with the correctly set value of the variable "A".
Now back to Inspect. In addition to these two ways to call it, it is also called by double-clicking on a variable in the “Local Variables” window, or through the context menu when right-clicking on it, or by pressing the “Alt + F5” hot key.
This is a more “advanced” property variable editor, but its use is justified when changing the properties of objects. It is somewhat inconvenient for changing a regular variable, and here’s why.
When you call it, first you will see the following dialog:
It will contain the description of the variable, its location in memory and its current value, and to change, you will need to press the button with the three-point one more time, after which an additional window will appear:

The extra gestures for such a simple operation as changes in the value of a normal variable are clearly redundant. But if you use it to change the properties of objects, the picture will change a bit.
Through Evaluate / Modify, access to the properties of the object is somewhat hampered by the fact that it does not provide information directly about the object under study. For example, to get the handle of a form, we’ll have to type the following text in it: “(Sender as TForm1) .Canvas.Handle” - which is somewhat inconvenient, because we can be sealed, and it’s just banal to forget the name of one or another property.
In the case of Inspect, there will be no such problem.
For example, let's open the “Inspect” dialog not for the variable “A”, but for the variable Self (which, as I said earlier, is always implicitly present for all methods of objects).

As you can see, in this case, we have access to almost all fields of the object, which can be changed as we like, and we will not be confused in the names of properties.
The essence of tracing is to step through each line of code.
Suppose we stopped at a preset BP, we analyzed the code and want to go to the next line. In principle, we can also put BP on it and run the program. And for the next, and for those after it.
Practically, exposing the BP on each line of the procedure code, we manually imitate what the debugger can do (in more detail in the second section).
And he can do the following:
These teams do not require detailed consideration. Let's stop only on the “Trace Into” team (“F7”).
For example, take the following code:
When performing tracing, at the moment when we are on the line S.Add (), we can have two options for the debugger reaction:
This behavior is due to the settings of your compiler. The fact is that Delphi ships with two sets of DCUs for system modules. One with debug information, the second without. If we have a second module connected, then the “Trace Into” (“F7”) command in this case will work as “Step Over” (“F8”). Switching between modules in the compiler settings is configured:
And the parameter “Use Debug DCUs” is responsible for this functionality.
The options in the tab with the compiler settings directly affect what code will be generated when building your project. It is very important not to forget that when changing any of the items in this tab, a complete reassembly of the project (“Project> Build”) is required in order for the changes to take effect. These settings directly affect the behavior of your code in various situations, as well as the composition of the information available to you when debugging a project.
Consider them in more detail:
Group "Code generation"
Optimization Parameter
This parameter directly affects code optimization: when enabled, the code will be generated in the most optimal way, taking into account both its size and the speed of execution. This can lead to loss of accessibility (even for reading) to some local variables, because due to the optimization of the code, they can already be removed from memory at the moment when we broke off at BP.
As an example, let's take the code from the first chapter and dwell on the same BP, but with optimization turned on.
As you can see, the values of previously available Self and Sender variables are no longer available. Also, due to the disabled parameter “Use Debug DCUs”, there was a cardinal change in the “Call Stack” window, previously filled with more detailed information about the call list.
Moreover, the Inspect tool also refuses to work with the Self object, producing the following error:
“Stack Frames” and “Pentiom-safe FDIV” parameters
I’ll skip the description of these parameters - they are not interesting at the debugging stage. In short: the first will help with the independent analysis of the stack, the second is responsible for the nuances when working with the mathematical coprocessor. If someone is interested in nuances, then my coordinates for communication in the profile.
“Record field alignment” parameter
Global alignment of unpacked records, which can be changed locally within the module by the directive "{$ Align x}" or "{$ A x}"
For example, consider the following code:
The size of this record, which we can get through SizeOf (T), will be different for each of the alignment settings:
{$ Align 1} = 14
{$ Align 2} = 16
{$ Align 4} = 20
{$ Align 8} = 24
Group "Syntax options"
It's better not to touch anything at all. For if you try, you can even make it so that the standard VCL refuses to assemble.
The only focus on the parameter “Complete boolen eval”, for periodically, some include it. It faces an error when executing the following code:
Since, when this setting is turned on, the boolean expression will be checked in its entirety, an error will occur when accessing Value.Count, despite the fact that the first check determined that the Value parameter is nullified. And if you turn on (for example) the “Extended syntax” parameter, then this code will not be collected at all by complaining about the undeclared Result variable.
Group "Runtime errors"
“Range checking” parameter
This is one of the most requested parameters when debugging an application. He is responsible for checking boundaries when accessing an array of data.
In the simplest case, you will get an exception when executing this code:
Here we are just trying to turn to an element of the array, and in principle, with the “Range checking” option disabled, if we don’t go beyond the bounds of the allocated memory, this code threatens us only with a kind of incomprehensible line appearing in the form header.

Which is unpleasant, but uncritical for program execution. It is much worse if you make a mistake with the block boundaries when attempting to write to it - in this case, the application memory may be destroyed.
Consider this example, disable the optimization:
What do you think, what will the value of the HazardVariable number be after the execution of this code? No, not 100. It will be equal to 4. Since we made a mistake when choosing the type of iterator and instead of TMyEnum2 we wrote TMyEnum1, we went beyond the range of the array boundaries and got the data on the stack, changing the values of local variables stored on it.
With optimization turned on, the situation will be even worse. We will get the following error:

According to this description, we can’t even guess where exactly the exception occurred, and why it happened, because the addresses mentioned in the error text do not belong to the application memory, and if, God forbid, the client’s error will be corrected by this error. description we can not.
Therefore, make it a rule - debugging of the application should always occur with the “Range checking” setting enabled!
Also, this parameter controls the overshooting of the permissible values when the values of variables change. For example, an exception will be raised when trying to assign a negative value to unsigned types like Cardinal / DWORD, or when trying to assign a value greater than a variable of this type can contain, for example, when assigning 500 to a Byte variable, etc.
Parameter "I / O cheking"
Responsible for validating I / O results when working with Pascal-style files.
I'm not sure that there is still software using this approach, but if you are still working with Append / Assign / Rewrite, etc., then enable this option when debugging the application.
“Overflow cheking” parameter
Monitors the results of arithmetic operations and raises an exception in cases where the result is outside the range of a variable.
To make it easier to understand the differences between this parameter and “Range checking”, consider the following code:
This code will not raise an exception when the “Overflow cheking” parameter is enabled. Although here variables are assigned not valid values, but no mathematical operations are performed on them. However, an exception will be raised when the “Range checking” parameter is enabled.
And now consider the second version of the code:
There will no longer be a reaction from the “Range checking” parameter, but an EIntegerOverflow exception will be raised, for which “Overflow cheking” is responsible, on the lines Inc (B) and C: = C - 1 due to the fact that the result of an arithmetic operation cannot be stored in the corresponding variable.
Thus, when working with variables, both parameters complement each other.
“Overflow cheking” is not as critical as “Range checking”, but it is still advisable to keep it turned on when debugging an application.
A small nuance: if you suddenly implement cryptographic algorithms, then, as a rule, the overflow operation is regular. In such situations, take the code to a separate module and, at the beginning of the module, write the directive "{$ OVERFLOWCHECKS OFF}" to disable overflow checking in the current module.
Debugging Group
With this tab, everything is very simple. All parameters, with the exception of the “Assertions” parameter, do not in any way affect the final code of your application. Depending on the activity of certain parameters, the completeness of debugging information in the DCU file for each module changes. Based on this information, the debugger synchronizes the assembler listing of the program with its real code, implemented by the programmer, recognizes local variables, etc. When compiling an application, this debugging information does not fit in the body of the application.
The only exception is the “Assertions” parameter - it is responsible for the operation of the Assert () procedure. If this parameter is disabled, Assert is not executed; otherwise, it is executed, and its code will also be placed in the application body at the compilation stage.
Summarizing.
At the stage of debugging the application, it is desirable to keep all the parameters from the “Runtime errors” and “Debugging” groups enabled, and disable them during the final compilation of the release application. In Delphi 7 and below, this will have to be done by hand, but, starting with Delphi 2005 and above, there is a normal support for project builds, in which you can specify these flag combinations personally for each type of assembly.
If BP is our main tool when debugging an application, then “Call Stack” is the second in importance.
This window looks like this:
It contains a complete description of the calls that were made before the debugger interrupted the execution of the program on the installed BP (or stopped due to an error). For example, the screenshot shows a stack of calls that occurred when a button was pressed on a form. It began with the arrival of the WM_COMMAND (273) message in the TWinControl.DefaultHandler procedure.
Having this list in hand, we can quickly switch between calls by double-clicking (or through the “View Source” menu), view the list of local variables for each call (“View Locals”), and set BP on any call.
Of course, there are not many possibilities, but nevertheless, it greatly simplifies the work during debugging, as in most cases it allows you to quickly localize the location of the error.
For example, the call stack will look like this when an EAbstractError error occurs:
In this case, it is enough to find the first call from above, whose code is located not in the Delphi system modules, in order to most likely say that the error is in it. This call is Unit1.TForm1.Button1Click () - this is the handler of the Button1 button in which the following code was executed:
Another use case is to track calls to certain functions. For example, we have a very large application code, and somewhere deep inside it there is a call to MessageBox, but we cannot find this place with a hitch to locate the place to call this particular MessageBox. To do this, you can use the following method:
As soon as the MessageBox is called from any place in the program, our BP will work and we will be able, on the basis of the “Call Stack” data, to find out the exact place of its call.
, , , , , , , .
. BP .
«Breakpoint list» BP.
:

«Condition» .
The “Pass count” parameter indicates how many such conditions need to be skipped before BP is activated, and the number of positives is counted from the very first one, taking into account the value of the “Condition” parameter.
Consider an abstract example:
Suppose BP is installed on the seventh line (RandomValue: = ...). If we just start the program, we will receive exactly 100 BP triggers. In order for this BP to trigger every tenth call, it is necessary to set the value of the Pass count property to 10. In this case, we will get exactly ten BP triggerings, at that moment the iterator of the code “I” will be a multiple of ten.
Suppose now we want to start the analysis after the 75th iteration, inclusive, for this we set the following condition in the “Condition” parameter: I> 75. In this case, this BP will work only two times: at that moment, when the iterator “I” will be equal to 85, and the second time, with a value of 95. This
happened for the following reasons:
, , , . . «Pass count», , , «Pass count». ( ).
«Condition», . ., «I» 75, , . , , «Pass count» , «I» 85.
, , «I» 75, «Pass count» .
.
.
, , . Those. ( ), , , 100 , , .
: (, ), .
:
We set the BP on the same seventh line and specify the value I = 9999 in the “Condition” parameter. Even on such a small cycle we will have to wait for the condition to trigger in the region of 3-5 seconds. Of course, this is not convenient. In such cases, it is easier to modify the code as follows:
… Beep, . .
( DEBUG , , , Beep-. )
«» , (SEH), Delphi try..finally..except. SEH «» . , :
Test1 Test2 100 .
210 , – , – try..finally.
, «» – , …
«Group», BP . – , , , , BP, .
:
: «Enable group» – , «Disable group» – .
«Break», . , .
– .
– , .
, .
Before compiling the example, be sure to enable the “Overflow cheking” option in the compiler settings and disable optimization.
After running this code, an exception will occur on the sixteenth line
, , , , . : , , , «F9» , .
, , , , .
:
— , :
rouse.drkb.ru/blog/bp3.mp4 (17 ).
( , , , , )
, , .
«Pass Count», «Condition»? , «Pass Count» . (. . «Condition») , .
It remains to consider a few more options.
The “Ignorecelation exceptions” option disables the debugger's response to any exception that occurred after executing the BP with this option turned on.
The parameter “Handlelative exceptions” cancels the effect of the previous parameter, returning the debugger to normal operation.
To see what this looks like, create the following code:
On the first ShowMessage, set BP, disable it by unchecking the “Break” parameter, and enable the “Ignore subsequent exceptions” parameter.
On the second ShowMessage, do the same, just turn on the “Handle subsequent exceptions” option.
Start the application from the debugger and click the buttons in the following order:
, Button2 Button3 , 2 3 , 5 6 , Button4.
2 :
«Log message» – , .
«Eval expression» – , ( «Log result») . , «123 * 2».
Everything that we considered earlier belonged to the so-called “Source Breakpoint”. That is, to the breakpoints set directly in the application code.
But, in addition to the code, we work with data (variables, arrays, just with allocated memory areas) and the debugger has the ability to set BP to the addresses at which this data is located in memory, using the “Data breakpoint”.
BP is set to a memory address via the Watch List (not in all Delphi versions) or in the Breakpoint List window using Add Breakpoint-> Data Breakpoint, where, in the dialog that appears, specify the required address, size of the monitored area or variable name. If you specify a variable name, the debugger will try to calculate its location in memory and (if possible) set BP.
The trouble is that getting this value is quite difficult due to the fact that every time the application starts, the address where the variable is located will be different each time.
– . , , , «Data breakpoint» . , , , . . – , , , , , , . «Data breakpoint» , .
Those who have previously worked with professional debuggers will probably find out in the “Data breakpoint” one of the basic analysis tools of the application - “Memory Breakpoint”.
Unfortunately, the Delphi debugger is not positioned as a professional tool for debugging third-party applications, so such a useful tool as the “Memory Breakpoint” is presented in it in a truncated version, where only the control of the memory address is recorded from it.
But even in this limited version, it remains an excellent tool for monitoring changes in the application's memory, especially for tracking errors in address arithmetic.
Consider the following code:
, :
«Break», - «system»:
, , , «Call Stack», , ShowCaption .
BP , , , Caption, :
, - Caption. «Data breakpoint».
After performing these actions, the program will stop at line 68 - Inc (Value). The peculiarity of the “Data breakpoint” is that it stops immediately after the changes, and not when trying to change the monitored memory, so the place where it writes to the address of the FP.Caption variable is located above - this is the string Value ^: = ValueData [I ].
Now, having found a problem place, we can correct the error itself. It lies in the fact that the length of the ValueData string, which we write to the Data buffer, exceeds the buffer size, which is why memory is overwritten, in which the Caption and Description variables are located.
This concludes a brief overview of the features of the integrated debugger. There are a few pending nuances, such as: setting ignored exceptions, BP when loading a module, etc., but they are insignificant and are rarely used in practice.
Also, the debugging mode in the “CPU-View” window and the Address Breakpoint associated with it remained unresolved. I also decided to skip it, because to readers who are not familiar with assembler, my explanation will not give anything, but more savvy specialists will know what CPU-View is and without me how to apply it correctly :)
In the second part of the article , . , BreakPoint, Data Breakpoint, Delphi, ( , TF GUARD ), Hardware Breakpoint, Delphi.
« » , aka Inovet, aka Palladin aka .
Alexander (Rouse_) Bagel
, 2012
Since most of my articles are focused on people interested in applying protection in their software, I decided that submitting material with specific pieces of protection code (like those previously published) will only confuse the reader. It is much easier to start from the basics and slowly give new material on the already prepared base.
Therefore, this article will be considered one of the basic tools of the programmer - debugger.
Objectives of the article: consider the basic methods of working with the debugger, show its advanced and rarely used features, give an insight into the operation of the debugger mechanisms with examples and consider a certain set of countermeasures.
')
The volume of the article turned out unexpectedly large, so I divided it into three parts:
- In the first part, the possibilities of the debugger integrated into IDE Delphi will be considered, recommendations on its optimal use and general tips on environment configuration are given. The material in this section is intended for both novice developers and more trained professionals.
- In the second part of the article, the reverse side of the debugger will be examined using the example of its source code, the mechanisms used by it for debugging the application are described in detail, and the options for modifying the application memory made by the debugger during operation are shown.
- The third part of the article will discuss the practical use of a debugger by the example of circumventing the protection of an application using a certain set of anti-debugging tricks.
Actually, let's get started.
1.1. Applying breakpoints and modifying local variables
One of the most commonly used tools of the integrated debugger is a breakpoint (BreakPoint - hereafter BP). After installing BP, the program will work until it reaches a stopping point, after which its work will be interrupted and control will be transferred to the debugger.
The easiest way to install and remove BP is the F5 hot key (or its equivalent in the Debug-> Toggle breakpoint menu). There are other ways, but about them later.
After the program is stopped, we can examine the values of the local variables of the procedure in which the execution of the application was stopped, as well as analyze the stack of calls preceding the call of this procedure. Here we can change the values of these variables.
Where to put BP - of course there is no general answer. In fact, BP is designed to facilitate the study of the operation of the code, the correctness of which we are not sure of, or explicitly containing an error, which we cannot immediately detect.
It is much easier to set a stopping point and consistently execute each line of code than to spend hours studying the same code, trying to figure out where it started to work in a different way than we intended.
Let's consider the following example.
There is a task: to write code that will increase the value of the initially numbered variable by one 5 times and one more time by the number 123, after which it will display the result as a 10-bit and hexadecimal value. Expected values will be as follows: 128 and 00000080.
Let's say the code will be written with an error:
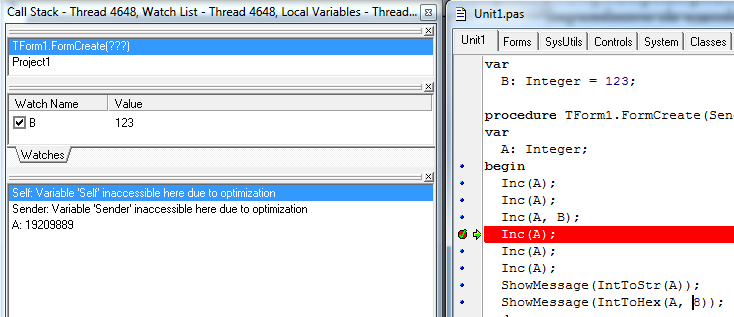
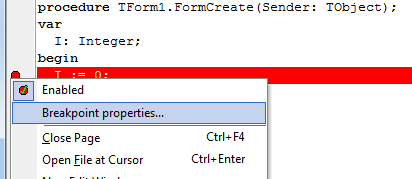
var B: Integer = 123; procedure TForm1.FormCreate(Sender: TObject); var A: Integer; begin Inc(A); Inc(A); Inc(A, B); Inc(A); Inc(A); Inc(A); ShowMessage(IntToStr(A)); ShowMessage(IntToHex(A, 8)); end; This code will output any values, but not the ones we wanted, because we did not initialize the variable “A” to zero. And since the variable "A" is local, it means that it is located on the stack, and we can never predict what value it will take at the beginning of this procedure. But we will assume that it is already the end of the working day, we are really tired (our eyes are blurred) and just forgot to write a line with variable initialization.
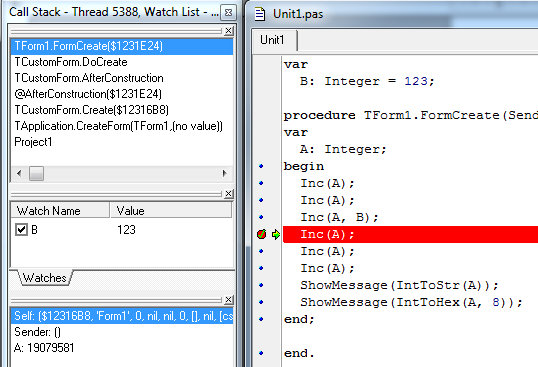
As a result, we have code that displays incorrect values, and we want to quickly understand the reason for this behavior. We put BP in the procedure body and run the program for execution:
It should look something like the picture. BP is set to Inc (A). At the bottom left you can observe the value of all local variables of the FormCreate procedure (the window is called “Local Variables”), namely, the Self variable (it is implicitly transmitted and always present in the class methods), the Sender parameter, and the local A variable itself. Its value is 19079581. On the left in the center in “WatchList” the value of the variable “B”.
Even a quick glance at the values of both variables and the three lines of code executed, we can understand that the value of the variable “A” does not correspond to the expected one. Since there had to be two increments per unit and another increase of 123, we had to see the value of the variable “A”, the number 125, and if there was a different value, it could mean only one thing - the initial value of the variable “A” was not true to.
To check the correctness of our assumption, let's change the current value of the variable “A” to the correct one and continue the program execution to check whether those results will return the procedure that was expected.
To change the values of variables in the debugger there are two tools.
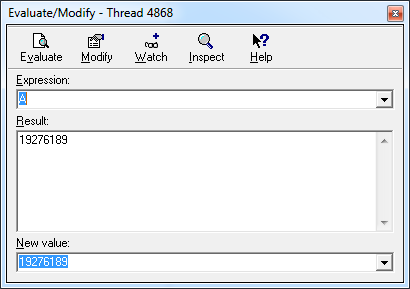
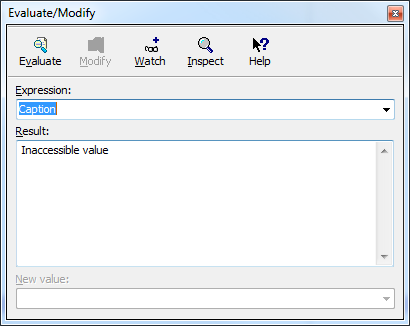
The first one is “Evaluate / Modify”, it is called either via the menu or by pressing the “Ctrl + F7” hot key. This is a very simple tool with a minimum of functionality, it is most often used.
Looks like that:
To change the value of a variable in it, it is enough to specify a new value in the “New value” field and press the “Enter” key or the “Modify” button.
The second tool, Inspect, is also available through the Run menu or directly from the Evaluate / Modify dialog. This is a more advanced parameter editor, about it a bit later.
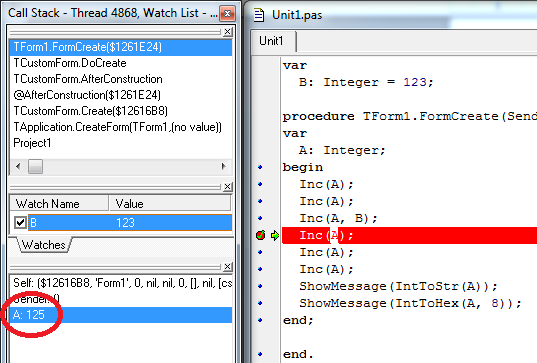
After changing the value of the variable "A", notice the changes in the list of values of local variables:
The variable "A" took the correct value, and now we can continue the execution of our application by pressing "F9" or through the menu by selecting the "Run" item. As a result of such intervention using the debugger, the procedure will give us the expected numbers 128 and 00000080, and we can safely correct the procedure code, since we found the cause of the error in it and checked its execution with the correctly set value of the variable "A".
Now back to Inspect. In addition to these two ways to call it, it is also called by double-clicking on a variable in the “Local Variables” window, or through the context menu when right-clicking on it, or by pressing the “Alt + F5” hot key.
This is a more “advanced” property variable editor, but its use is justified when changing the properties of objects. It is somewhat inconvenient for changing a regular variable, and here’s why.
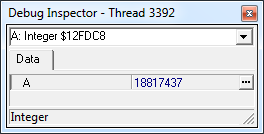
When you call it, first you will see the following dialog:
It will contain the description of the variable, its location in memory and its current value, and to change, you will need to press the button with the three-point one more time, after which an additional window will appear:
The extra gestures for such a simple operation as changes in the value of a normal variable are clearly redundant. But if you use it to change the properties of objects, the picture will change a bit.
Through Evaluate / Modify, access to the properties of the object is somewhat hampered by the fact that it does not provide information directly about the object under study. For example, to get the handle of a form, we’ll have to type the following text in it: “(Sender as TForm1) .Canvas.Handle” - which is somewhat inconvenient, because we can be sealed, and it’s just banal to forget the name of one or another property.
In the case of Inspect, there will be no such problem.
For example, let's open the “Inspect” dialog not for the variable “A”, but for the variable Self (which, as I said earlier, is always implicitly present for all methods of objects).
As you can see, in this case, we have access to almost all fields of the object, which can be changed as we like, and we will not be confused in the names of properties.
1.2. Trace (step by step debugging)
The essence of tracing is to step through each line of code.
Suppose we stopped at a preset BP, we analyzed the code and want to go to the next line. In principle, we can also put BP on it and run the program. And for the next, and for those after it.
Practically, exposing the BP on each line of the procedure code, we manually imitate what the debugger can do (in more detail in the second section).
And he can do the following:
- “Trace Into” command (“F7”) - the debugger will execute the code of the current line of code and stop at the next one. If the current line of code calls any procedure, then the next line will be the first line of the called procedure.
- The “Step Over” command (“F8”) is similar to the first command, but the input to the body of the called procedure does not occur.
- The “Trace to Next Source Line” command (“Shift + F7”) is also a practically complete analogue of the first command, but is used in the “CPU-View” window (this debug mode is not covered in the article).
- “Run to Cursor” command (“F4”) - the debugger will execute the program code up to the line where the cursor is located (with the condition that no other BPs were encountered during execution).
- “Run Until Return” command (“Shift + F8”) - the debugger will execute the code of the current procedure until it exits. (Often used as a counter-reception on a randomly pressed “F7” and also with the condition that no other BPs were encountered during the execution).
- In older versions of Delphi, the “Set Next Statement” command is available, with which we can change the course of the program execution by setting any line of code as the current one. This feature is also available in the code editor where you can drag the arrow pointing to the current active line to a new position.
These teams do not require detailed consideration. Let's stop only on the “Trace Into” team (“F7”).
For example, take the following code:
procedure TForm1.FormCreate(Sender: TObject); var S: TStringList; begin S := TStringList.Create; try S.Add('My value'); finally S.Free; end; end; When performing tracing, at the moment when we are on the line S.Add (), we can have two options for the debugger reaction:
- we will go inside the TStringList.Add method,
- we will not go there.
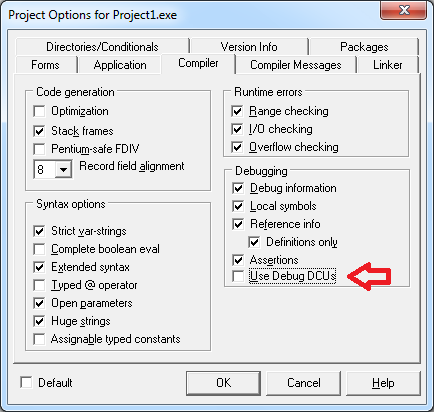
This behavior is due to the settings of your compiler. The fact is that Delphi ships with two sets of DCUs for system modules. One with debug information, the second without. If we have a second module connected, then the “Trace Into” (“F7”) command in this case will work as “Step Over” (“F8”). Switching between modules in the compiler settings is configured:
And the parameter “Use Debug DCUs” is responsible for this functionality.
1.3. More on compiler settings
The options in the tab with the compiler settings directly affect what code will be generated when building your project. It is very important not to forget that when changing any of the items in this tab, a complete reassembly of the project (“Project> Build”) is required in order for the changes to take effect. These settings directly affect the behavior of your code in various situations, as well as the composition of the information available to you when debugging a project.
Consider them in more detail:
Group "Code generation"
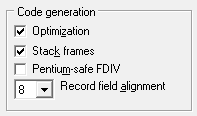
Optimization Parameter
This parameter directly affects code optimization: when enabled, the code will be generated in the most optimal way, taking into account both its size and the speed of execution. This can lead to loss of accessibility (even for reading) to some local variables, because due to the optimization of the code, they can already be removed from memory at the moment when we broke off at BP.
As an example, let's take the code from the first chapter and dwell on the same BP, but with optimization turned on.
As you can see, the values of previously available Self and Sender variables are no longer available. Also, due to the disabled parameter “Use Debug DCUs”, there was a cardinal change in the “Call Stack” window, previously filled with more detailed information about the call list.
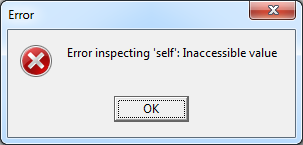
Moreover, the Inspect tool also refuses to work with the Self object, producing the following error:
“Stack Frames” and “Pentiom-safe FDIV” parameters
I’ll skip the description of these parameters - they are not interesting at the debugging stage. In short: the first will help with the independent analysis of the stack, the second is responsible for the nuances when working with the mathematical coprocessor. If someone is interested in nuances, then my coordinates for communication in the profile.
“Record field alignment” parameter
Global alignment of unpacked records, which can be changed locally within the module by the directive "{$ Align x}" or "{$ A x}"
For example, consider the following code:
type T = record a: Int64; b: Byte; c: Integer; d: Byte; end; The size of this record, which we can get through SizeOf (T), will be different for each of the alignment settings:
{$ Align 1} = 14
{$ Align 2} = 16
{$ Align 4} = 20
{$ Align 8} = 24
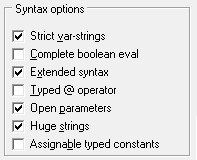
Group "Syntax options"
It's better not to touch anything at all. For if you try, you can even make it so that the standard VCL refuses to assemble.
The only focus on the parameter “Complete boolen eval”, for periodically, some include it. It faces an error when executing the following code:
function IsListDataPresent(Value: TList): Boolean; begin Result := (Value <> nil) and (Value.Count > 0); end; procedure TForm1.FormCreate(Sender: TObject); begin if IsListDataPresent(nil) then ShowMessage('boo...'); end; Since, when this setting is turned on, the boolean expression will be checked in its entirety, an error will occur when accessing Value.Count, despite the fact that the first check determined that the Value parameter is nullified. And if you turn on (for example) the “Extended syntax” parameter, then this code will not be collected at all by complaining about the undeclared Result variable.
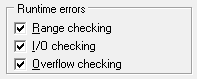
Group "Runtime errors"
“Range checking” parameter
This is one of the most requested parameters when debugging an application. He is responsible for checking boundaries when accessing an array of data.
In the simplest case, you will get an exception when executing this code:
const A: array [0..1] of Char = ('A', 'B'); procedure TForm1.FormCreate(Sender: TObject); var I: Integer; begin for I := 0 to 100 do Caption := Caption + A[I]; end; Here we are just trying to turn to an element of the array, and in principle, with the “Range checking” option disabled, if we don’t go beyond the bounds of the allocated memory, this code threatens us only with a kind of incomprehensible line appearing in the form header.
Which is unpleasant, but uncritical for program execution. It is much worse if you make a mistake with the block boundaries when attempting to write to it - in this case, the application memory may be destroyed.
Consider this example, disable the optimization:
type TMyEnum1 = (en1, en2, en3, en4, en5); TMyEnum2 = en1..en3; procedure TForm1.FormCreate(Sender: TObject); var I: TMyEnum1; HazardVariable: Integer; Buff: array [TMyEnum2] of Integer; begin HazardVariable := 100; for I := Low(I) to High(I) do Buff[I] := Integer(I); ShowMessage(IntToStr(HazardVariable)); end; What do you think, what will the value of the HazardVariable number be after the execution of this code? No, not 100. It will be equal to 4. Since we made a mistake when choosing the type of iterator and instead of TMyEnum2 we wrote TMyEnum1, we went beyond the range of the array boundaries and got the data on the stack, changing the values of local variables stored on it.
With optimization turned on, the situation will be even worse. We will get the following error:
According to this description, we can’t even guess where exactly the exception occurred, and why it happened, because the addresses mentioned in the error text do not belong to the application memory, and if, God forbid, the client’s error will be corrected by this error. description we can not.
Therefore, make it a rule - debugging of the application should always occur with the “Range checking” setting enabled!
Also, this parameter controls the overshooting of the permissible values when the values of variables change. For example, an exception will be raised when trying to assign a negative value to unsigned types like Cardinal / DWORD, or when trying to assign a value greater than a variable of this type can contain, for example, when assigning 500 to a Byte variable, etc.
Parameter "I / O cheking"
Responsible for validating I / O results when working with Pascal-style files.
I'm not sure that there is still software using this approach, but if you are still working with Append / Assign / Rewrite, etc., then enable this option when debugging the application.
“Overflow cheking” parameter
Monitors the results of arithmetic operations and raises an exception in cases where the result is outside the range of a variable.
To make it easier to understand the differences between this parameter and “Range checking”, consider the following code:
procedure TForm1.FormCreate(Sender: TObject); var C: Cardinal; B: Byte; I: Integer; begin I := -1; B := I; C := I; ShowMessage(IntToStr(C - B)); end; This code will not raise an exception when the “Overflow cheking” parameter is enabled. Although here variables are assigned not valid values, but no mathematical operations are performed on them. However, an exception will be raised when the “Range checking” parameter is enabled.
And now consider the second version of the code:
procedure TForm1.FormCreate(Sender: TObject); var C: Cardinal; B: Byte; begin B := 255; Inc(B); C := 0; C := C - 1; ShowMessage(IntToStr(C - B)); end; There will no longer be a reaction from the “Range checking” parameter, but an EIntegerOverflow exception will be raised, for which “Overflow cheking” is responsible, on the lines Inc (B) and C: = C - 1 due to the fact that the result of an arithmetic operation cannot be stored in the corresponding variable.
Thus, when working with variables, both parameters complement each other.
“Overflow cheking” is not as critical as “Range checking”, but it is still advisable to keep it turned on when debugging an application.
A small nuance: if you suddenly implement cryptographic algorithms, then, as a rule, the overflow operation is regular. In such situations, take the code to a separate module and, at the beginning of the module, write the directive "{$ OVERFLOWCHECKS OFF}" to disable overflow checking in the current module.
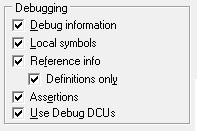
Debugging Group
With this tab, everything is very simple. All parameters, with the exception of the “Assertions” parameter, do not in any way affect the final code of your application. Depending on the activity of certain parameters, the completeness of debugging information in the DCU file for each module changes. Based on this information, the debugger synchronizes the assembler listing of the program with its real code, implemented by the programmer, recognizes local variables, etc. When compiling an application, this debugging information does not fit in the body of the application.
The only exception is the “Assertions” parameter - it is responsible for the operation of the Assert () procedure. If this parameter is disabled, Assert is not executed; otherwise, it is executed, and its code will also be placed in the application body at the compilation stage.
Summarizing.
At the stage of debugging the application, it is desirable to keep all the parameters from the “Runtime errors” and “Debugging” groups enabled, and disable them during the final compilation of the release application. In Delphi 7 and below, this will have to be done by hand, but, starting with Delphi 2005 and above, there is a normal support for project builds, in which you can specify these flag combinations personally for each type of assembly.
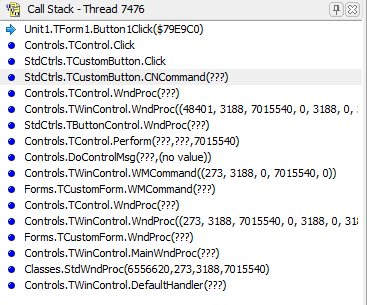
1.4. Call Stack Window ("Call Stack")
If BP is our main tool when debugging an application, then “Call Stack” is the second in importance.
This window looks like this:
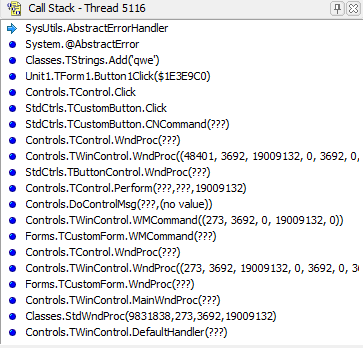
It contains a complete description of the calls that were made before the debugger interrupted the execution of the program on the installed BP (or stopped due to an error). For example, the screenshot shows a stack of calls that occurred when a button was pressed on a form. It began with the arrival of the WM_COMMAND (273) message in the TWinControl.DefaultHandler procedure.
Having this list in hand, we can quickly switch between calls by double-clicking (or through the “View Source” menu), view the list of local variables for each call (“View Locals”), and set BP on any call.
Of course, there are not many possibilities, but nevertheless, it greatly simplifies the work during debugging, as in most cases it allows you to quickly localize the location of the error.
For example, the call stack will look like this when an EAbstractError error occurs:
In this case, it is enough to find the first call from above, whose code is located not in the Delphi system modules, in order to most likely say that the error is in it. This call is Unit1.TForm1.Button1Click () - this is the handler of the Button1 button in which the following code was executed:
procedure TForm1.Button1Click(Sender: TObject); begin TStrings.Create.Add('qwe'); end; Another use case is to track calls to certain functions. For example, we have a very large application code, and somewhere deep inside it there is a call to MessageBox, but we cannot find this place with a hitch to locate the place to call this particular MessageBox. To do this, you can use the following method:
- go to the module where the call of the function of interest is announced (in this case, it is windows.pas),
- find its announcement (line with blue dot function MessageBox; external user32 ...),
- install on this line BP and run the program.
As soon as the MessageBox is called from any place in the program, our BP will work and we will be able, on the basis of the “Call Stack” data, to find out the exact place of its call.
1.5. Work with extended stopping point properties
, , , , , , , .
. BP .
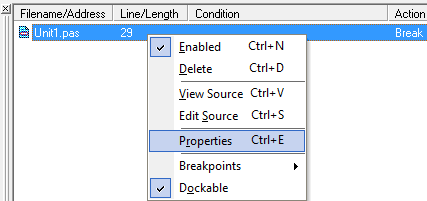
«Breakpoint list» BP.
:
«Condition» .
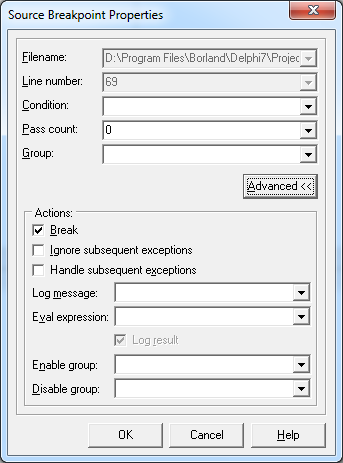
The “Pass count” parameter indicates how many such conditions need to be skipped before BP is activated, and the number of positives is counted from the very first one, taking into account the value of the “Condition” parameter.
Consider an abstract example:
procedure TForm1.FormCreate(Sender: TObject); var I, RandomValue: Integer; begin RandomValue := Random(100); for I := 1 to 100 do RandomValue := RandomValue + I; ShowMessage(IntToStr(RandomValue)); end; Suppose BP is installed on the seventh line (RandomValue: = ...). If we just start the program, we will receive exactly 100 BP triggers. In order for this BP to trigger every tenth call, it is necessary to set the value of the Pass count property to 10. In this case, we will get exactly ten BP triggerings, at that moment the iterator of the code “I” will be a multiple of ten.
Suppose now we want to start the analysis after the 75th iteration, inclusive, for this we set the following condition in the “Condition” parameter: I> 75. In this case, this BP will work only two times: at that moment, when the iterator “I” will be equal to 85, and the second time, with a value of 95. This
happened for the following reasons:
, , , . . «Pass count», , , «Pass count». ( ).
«Condition», . ., «I» 75, , . , , «Pass count» , «I» 85.
, , «I» 75, «Pass count» .
.
.
, , . Those. ( ), , , 100 , , .
: (, ), .
:
procedure TForm1.FormCreate(Sender: TObject); var I, RandomValue: Integer; begin RandomValue := Random(100); for I := 1 to 10000 do RandomValue := RandomValue + I; ShowMessage(IntToStr(RandomValue)); end; We set the BP on the same seventh line and specify the value I = 9999 in the “Condition” parameter. Even on such a small cycle we will have to wait for the condition to trigger in the region of 3-5 seconds. Of course, this is not convenient. In such cases, it is easier to modify the code as follows:
procedure TForm1.FormCreate(Sender: TObject); var I, RandomValue: Integer; begin RandomValue := Random(100); for I := 1 to 10000 do begin RandomValue := RandomValue + I; {$IFDEF DEBUG} if I = 9999 then Beep; {$ENDIF} end; ShowMessage(IntToStr(RandomValue)); end; … Beep, . .
( DEBUG , , , Beep-. )
«» , (SEH), Delphi try..finally..except. SEH «» . , :
function Test1(var Value: Integer): Cardinal; var I: Integer; begin Result := GetTickCount; for I := 1 to 100000000 do Inc(Value); Result := GetTickCount - Result; end; function Test2(var Value: Integer): Cardinal; var I: Integer; begin Result := GetTickCount; for I := 1 to 100000000 do try Inc(Value); finally end; Result := GetTickCount - Result; end; procedure TForm1.FormCreate(Sender: TObject); var A: Integer; begin A := 0; ShowMessage(IntToStr(Test1(A))); A := 0; ShowMessage(IntToStr(Test2(A))); end; Test1 Test2 100 .
210 , – , – try..finally.
, «» – , …
«Group», BP . – , , , , BP, .
:
: «Enable group» – , «Disable group» – .
«Break», . , .
– .
– , .
, .
Before compiling the example, be sure to enable the “Overflow cheking” option in the compiler settings and disable optimization.
function Level3(Value: Integer): Integer; var I: Integer; begin Result := Value; for I := 0 to 9 do Inc(Result); end; function Level2(Value: Integer): Integer; var I: Integer; begin Result := Value; for I := 0 to 9 do Inc(Result, Level3(Result) shr 1); end; function Level1(Value: Integer): Integer; var I: Integer; begin Result := Value; for I := 0 to 9 do Inc(Result, Level2(Result) shr 3); end; procedure TForm1.FormCreate(Sender: TObject); begin ShowMessage(IntToStr(Level1(0))); end; After running this code, an exception will occur on the sixteenth line
Inc(Result, Level3(Result) shr 1);. , , , , . : , , , «F9» , .
, , , , .
:
- «level2BP».
- , . FormCreate ShowMessage «Disable group» «level2BP». , «Break».
- Level1 №25. , .
- , 9 ( I ). , 8 , , «level2BP». «Condition» I=8, «Break» «Enable group» «level2BP».
- , Level2, – . F9, , , , I 5. «Condition» I=5, .
- , .
— , :
rouse.drkb.ru/blog/bp3.mp4 (17 ).
( , , , , )
, , .
«Pass Count», «Condition»? , «Pass Count» . (. . «Condition») , .
It remains to consider a few more options.
The “Ignorecelation exceptions” option disables the debugger's response to any exception that occurred after executing the BP with this option turned on.
The parameter “Handlelative exceptions” cancels the effect of the previous parameter, returning the debugger to normal operation.
To see what this looks like, create the following code:
procedure TForm1.Button1Click(Sender: TObject); begin ShowMessage('All exceptions ignored'); end; procedure TForm1.Button2Click(Sender: TObject); begin PInteger(0)^ := 123; end; procedure TForm1.Button3Click(Sender: TObject); var S: TStrings; begin S := TStrings.Create; try S.Add('abstract') finally S.Free; end; end; procedure TForm1.Button4Click(Sender: TObject); begin ShowMessage('All exceptions handled'); end; On the first ShowMessage, set BP, disable it by unchecking the “Break” parameter, and enable the “Ignore subsequent exceptions” parameter.
On the second ShowMessage, do the same, just turn on the “Handle subsequent exceptions” option.
Start the application from the debugger and click the buttons in the following order:
- Button1
- Button2
- Button3
- Button4
- Button2
- Button3
, Button2 Button3 , 2 3 , 5 6 , Button4.
2 :
«Log message» – , .
«Eval expression» – , ( «Log result») . , «123 * 2».
1.6. «Data breakpoint», «Watch List» «Call Stack»
Everything that we considered earlier belonged to the so-called “Source Breakpoint”. That is, to the breakpoints set directly in the application code.
But, in addition to the code, we work with data (variables, arrays, just with allocated memory areas) and the debugger has the ability to set BP to the addresses at which this data is located in memory, using the “Data breakpoint”.
BP is set to a memory address via the Watch List (not in all Delphi versions) or in the Breakpoint List window using Add Breakpoint-> Data Breakpoint, where, in the dialog that appears, specify the required address, size of the monitored area or variable name. If you specify a variable name, the debugger will try to calculate its location in memory and (if possible) set BP.
The trouble is that getting this value is quite difficult due to the fact that every time the application starts, the address where the variable is located will be different each time.
– . , , , «Data breakpoint» . , , , . . – , , , , , , . «Data breakpoint» , .
Those who have previously worked with professional debuggers will probably find out in the “Data breakpoint” one of the basic analysis tools of the application - “Memory Breakpoint”.
Unfortunately, the Delphi debugger is not positioned as a professional tool for debugging third-party applications, so such a useful tool as the “Memory Breakpoint” is presented in it in a truncated version, where only the control of the memory address is recorded from it.
But even in this limited version, it remains an excellent tool for monitoring changes in the application's memory, especially for tracking errors in address arithmetic.
Consider the following code:
type TTest = class Data: array [0..10] of Char; Caption: string; Description: string; procedure ShowCaption; procedure ShowDescription; procedure ShowData; end; TForm1 = class(TForm) procedure FormCreate(Sender: TObject); private FT: TTest; procedure InitData(Value: PChar); end; var Form1: TForm1; implementation {$R *.DFM} { TTest } procedure TTest.ShowCaption; begin ShowMessage(Caption); end; procedure TTest.ShowData; begin ShowMessage(PChar(@Data[0])); end; procedure TTest.ShowDescription; begin ShowMessage(Description); end; { TForm1 } procedure TForm1.FormCreate(Sender: TObject); begin FT := TTest.Create; try FT.Caption := 'Test caption'; FT.Description := 'Test Description'; InitData(@FT.Data[0]); FT.ShowCaption; FT.ShowDescription; FT.ShowData; finally FT.Free; end; end; procedure TForm1.InitData(Value: PChar); const ValueData = 'Test data value'; var I: Integer; begin for I := 1 to Length(ValueData) do begin Value^ := ValueData[I]; Inc(Value); end; end; , :
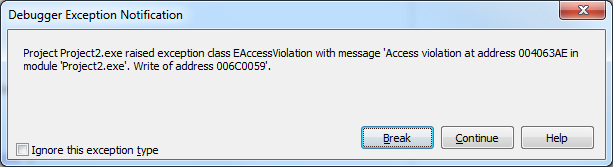
«Break», - «system»:
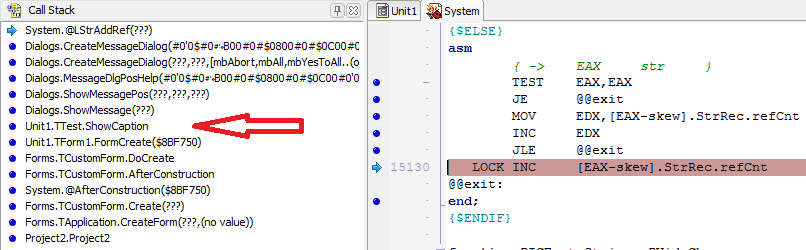
, , , «Call Stack», , ShowCaption .
BP , , , Caption, :
, - Caption. «Data breakpoint».
- Caption, FT.Description := 'Test Description';.
- , FP.Caption «Watch List» «Break When Changed». (, Delphi 2010 ), «Data breakpoint» . «Breakpoint List» «Add->Data Breakpoint», FP.Caption .
- .
After performing these actions, the program will stop at line 68 - Inc (Value). The peculiarity of the “Data breakpoint” is that it stops immediately after the changes, and not when trying to change the monitored memory, so the place where it writes to the address of the FP.Caption variable is located above - this is the string Value ^: = ValueData [I ].
Now, having found a problem place, we can correct the error itself. It lies in the fact that the length of the ValueData string, which we write to the Data buffer, exceeds the buffer size, which is why memory is overwritten, in which the Caption and Description variables are located.
1.7. Finally
This concludes a brief overview of the features of the integrated debugger. There are a few pending nuances, such as: setting ignored exceptions, BP when loading a module, etc., but they are insignificant and are rarely used in practice.
Also, the debugging mode in the “CPU-View” window and the Address Breakpoint associated with it remained unresolved. I also decided to skip it, because to readers who are not familiar with assembler, my explanation will not give anything, but more savvy specialists will know what CPU-View is and without me how to apply it correctly :)
In the second part of the article , . , BreakPoint, Data Breakpoint, Delphi, ( , TF GUARD ), Hardware Breakpoint, Delphi.
« » , aka Inovet, aka Palladin aka .
Alexander (Rouse_) Bagel
, 2012
Source: https://habr.com/ru/post/178007/
All Articles