App Annie Index: Mobile Application Market Report, Q1 '13
That week, 04/17/2013, another report was released on App Annie's global market for mobile applications. This is a company that provides sales and download analytics for all platforms. We often use this service in our work, and translations of some reports are provided to those clients who turn to us for advice. I share the translation here, too. The report should be useful to anyone interested in the mobile application market and the digital sphere in general. In fact, in it we see the result of everything that, in particular, has been observed over the past months. The current situation looks especially fascinating in the context of reports for the previous quarters: the mobile application market is extremely active and dynamic. The original report is here .
')
In the quarterly market report from App Annie, not only the latest trends in downloads and sales on Google Play and the App Store (hereinafter referred to as “stores”) are considered, but also macro-level trends. It helps, among other things, to determine the most profitable investment opportunities.
Key trends in stores, countries and categories
Over the last quarter, Google Play has achieved higher growth rates than the iOS App Store, both in downloads and in revenue. However, despite the fact that in the first quarter of 2013, Google Play approached 90% of the number of downloads on the App Store, the latter maintains a strong leading position in terms of monetization, earning about 2.6 times more than Google Play. For comparison, in the previous quarter, Google Play was 4 times behind on this indicator.
Several countries showed a remarkable growth during the 4th quarter of 2012 and the 1st quarter of 2013.
In all the countries mentioned above, games still lead as a growth factor, especially in terms of revenue growth. By 2013, the category of games has reached such a level, which is the source of almost 70% of the App Store revenue and 80% of Google Play revenue. There are several more categories, the incomes from which put them on high positions in ranking:
Application downloads on the App Store vs. Google play
Google Play downloads accounted for about 90% of the App Store downloads in the first quarter of 2013.

Revenues from the App Store vs. App. Google play
The iOS App Store received 2.6 times more revenue from apps than Google Play in the first quarter of 2013.
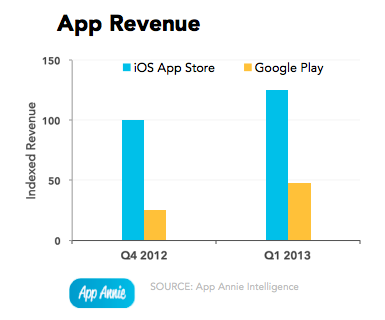
From the fourth quarter of 2012 to the first quarter of 2013, iOS App Store’s quarterly revenue grew by about a quarter. Meanwhile, revenue from Google Play applications has grown by about 90%.
App Store: Leading countries in terms of downloads in Q1 2013
China leads in downloads on the App Store
Leading countries in the number of downloads in the first quarter of 2013
* index change in comparison with the previous quarter
In the past quarter, the United States maintained its leadership position. In recent months, China began to increase turnover in the iOS App Store and became the leading factor in the growth of downloads from Q4 2012 to Q1 2013. Although the games were the main category in download growth in China, revenues were also observed in many other categories. Meanwhile, the United Kingdom and Japan were alternately in third and fourth positions over the past year. Together, these leading countries came from about half the iOS downloads.
App Store: Leading countries in revenue in Q1 2013
China reached the fourth position. The USA and Japan gave half the store revenue.
Leading countries in revenue in Q1 2013
* index change in comparison with the previous quarter
The United States and Japan remain the leaders of the App Store, providing about half of all store revenue. Although the App Store in the US has shown greater revenue growth over the past quarter with the leading category of “games,” China has raised its figure. Last year, China barely hit the top 10 countries. During the past quarter, he moved up to fourth place from the sixth, which he held in the fourth quarter of 2012. The games became the category that provided most of the revenue growth in China; This category has grown in China by about 90%, which is the highest figure in the entire App Store.
Google Play: Top download countries in Q1 2013
Games - the source of download growth in Russia
Leading countries on Google Play downloads in Q1 2013
* index change in comparison with the previous quarter
The leading countries of Google Play provided about 40% of downloads in the first quarter of 2013 compared with 50% on the App Store. Russia's performance has been steadily growing over the past year and climbed to fourth position in the last quarter. Here, the “games” category became a key source and gave about half of the downloads in the Russian Google Play in Q1 2013 (which is a higher figure compared to 40% in Q4 2012). South Korea and India retained second and third places after the United States, showing how much the Google Play Store differs from the App Store in the global market.
Google Play: Leading countries in revenue in Q1 2013
First Japan, now South Korea ahead of USA
Leading countries in revenue in Q1 2013
* index change in comparison with the previous quarter
Japan and South Korea continue their significant growth in 1 square. 2013 revenue by Google Play. Japan advanced above the US in the top in 4 square meters. 2012, while South Korea outstripped the UK and ranked second in the first quarter of 2013. These three countries dominate Google Play, covering approximately 70% of the store’s global revenue. Their income is due to games more than in any other countries of Google Play. South Korea surpassed the 95% mark, while Japan reached 90%.
App Store: leading download categories in Q1 2013
Photo and video applications have reached the top 3 downloads.
* index change in comparison with the previous quarter
The “games” category remains the absolute leader as a source of growth in the App Store and provides about 40% of store downloads in Q1 2013. The “photo” and “video” categories rose in terms of downloads and broke into the top 3 in 1 sq. 2013
App Store: leading categories in revenue in 1 square. 2013
Games lead, and educational applications are better with monetization
* index change in comparison with the previous quarter
The “games” category continues to boom in revenue, providing about 70% of the App Store revenue in Q1 2013. The education category also brings revenue, which allows it to move up to rank 4.
Google Play: Leading categories on downloads in 1 square. 2013
Google Play Store is becoming more social
* index change in comparison with the previous quarter
On Google Play, the category of games has grown steadily over the previous year. Social category networks also shows a steady income in downloads and currently ranks 5th.
Google Play: leading categories in revenue in 1 square. 2013
Games give you more revenue on Google Play than on the App Store.
As of 1 square. In 2013, the category of igor grew and provided about 80% of Google Play revenue, compared with 70% in the App Store.
')
In the quarterly market report from App Annie, not only the latest trends in downloads and sales on Google Play and the App Store (hereinafter referred to as “stores”) are considered, but also macro-level trends. It helps, among other things, to determine the most profitable investment opportunities.
Key trends in stores, countries and categories
Over the last quarter, Google Play has achieved higher growth rates than the iOS App Store, both in downloads and in revenue. However, despite the fact that in the first quarter of 2013, Google Play approached 90% of the number of downloads on the App Store, the latter maintains a strong leading position in terms of monetization, earning about 2.6 times more than Google Play. For comparison, in the previous quarter, Google Play was 4 times behind on this indicator.
Several countries showed a remarkable growth during the 4th quarter of 2012 and the 1st quarter of 2013.
- The United States showed the largest growth in App Store revenue, and in China, not only did they download the most apps on the App Store, but also made purchases for a larger amount than in any other country.
- Russia has become a key factor in the growth of downloads on Google Play.
- In Japan and South Korea, Google Play continues to see a marked increase in revenue.
In all the countries mentioned above, games still lead as a growth factor, especially in terms of revenue growth. By 2013, the category of games has reached such a level, which is the source of almost 70% of the App Store revenue and 80% of Google Play revenue. There are several more categories, the incomes from which put them on high positions in ranking:
- Photo and video applications have reached the third place in the number of downloads on the App Store
- Educational apps ranked fourth for iOS revenue sources worldwide
- Social apps rank fifth in Google Play categories
Shopping figures
Application downloads on the App Store vs. Google play
Google Play downloads accounted for about 90% of the App Store downloads in the first quarter of 2013.
Revenues from the App Store vs. App. Google play
The iOS App Store received 2.6 times more revenue from apps than Google Play in the first quarter of 2013.
From the fourth quarter of 2012 to the first quarter of 2013, iOS App Store’s quarterly revenue grew by about a quarter. Meanwhile, revenue from Google Play applications has grown by about 90%.
Country Indicators
App Store: Leading countries in terms of downloads in Q1 2013
China leads in downloads on the App Store
Leading countries in the number of downloads in the first quarter of 2013
- USA
- China
- UK + 1 *
- Japan, -1 *
- France
* index change in comparison with the previous quarter
In the past quarter, the United States maintained its leadership position. In recent months, China began to increase turnover in the iOS App Store and became the leading factor in the growth of downloads from Q4 2012 to Q1 2013. Although the games were the main category in download growth in China, revenues were also observed in many other categories. Meanwhile, the United Kingdom and Japan were alternately in third and fourth positions over the past year. Together, these leading countries came from about half the iOS downloads.
App Store: Leading countries in revenue in Q1 2013
China reached the fourth position. The USA and Japan gave half the store revenue.
Leading countries in revenue in Q1 2013
- USA
- Japan
- Great Britain
- China + 2 *
- Australia, -1 *
* index change in comparison with the previous quarter
The United States and Japan remain the leaders of the App Store, providing about half of all store revenue. Although the App Store in the US has shown greater revenue growth over the past quarter with the leading category of “games,” China has raised its figure. Last year, China barely hit the top 10 countries. During the past quarter, he moved up to fourth place from the sixth, which he held in the fourth quarter of 2012. The games became the category that provided most of the revenue growth in China; This category has grown in China by about 90%, which is the highest figure in the entire App Store.
Google Play: Top download countries in Q1 2013
Games - the source of download growth in Russia
Leading countries on Google Play downloads in Q1 2013
- USA
- South Korea
- India
- Russia, +2
- Japan, -1 *
* index change in comparison with the previous quarter
The leading countries of Google Play provided about 40% of downloads in the first quarter of 2013 compared with 50% on the App Store. Russia's performance has been steadily growing over the past year and climbed to fourth position in the last quarter. Here, the “games” category became a key source and gave about half of the downloads in the Russian Google Play in Q1 2013 (which is a higher figure compared to 40% in Q4 2012). South Korea and India retained second and third places after the United States, showing how much the Google Play Store differs from the App Store in the global market.
Google Play: Leading countries in revenue in Q1 2013
First Japan, now South Korea ahead of USA
Leading countries in revenue in Q1 2013
- Japan
- South Korea, + 1 *
- USA, -1 *
- Great Britain
- Germany
* index change in comparison with the previous quarter
Japan and South Korea continue their significant growth in 1 square. 2013 revenue by Google Play. Japan advanced above the US in the top in 4 square meters. 2012, while South Korea outstripped the UK and ranked second in the first quarter of 2013. These three countries dominate Google Play, covering approximately 70% of the store’s global revenue. Their income is due to games more than in any other countries of Google Play. South Korea surpassed the 95% mark, while Japan reached 90%.
Indicators by category
App Store: leading download categories in Q1 2013
Photo and video applications have reached the top 3 downloads.
Leading categories for downloads in Q1 2013
- Games
- Entertainment
- Photo and video + 1 *
- Utilities, -1 *
- Life style
* index change in comparison with the previous quarter
The “games” category remains the absolute leader as a source of growth in the App Store and provides about 40% of store downloads in Q1 2013. The “photo” and “video” categories rose in terms of downloads and broke into the top 3 in 1 sq. 2013
App Store: leading categories in revenue in 1 square. 2013
Games lead, and educational applications are better with monetization
Leading categories of income in 1 square. 2013
- Games
- Performance
- Social networks
- Education, + 1 *
- Entertainment, -1 *
* index change in comparison with the previous quarter
The “games” category continues to boom in revenue, providing about 70% of the App Store revenue in Q1 2013. The education category also brings revenue, which allows it to move up to rank 4.
Google Play: Leading categories on downloads in 1 square. 2013
Google Play Store is becoming more social
Leading categories on downloads Q1 2013
- Games
- Instruments
- Entertainment
- Communications
- Social networks, + 1 *
* index change in comparison with the previous quarter
On Google Play, the category of games has grown steadily over the previous year. Social category networks also shows a steady income in downloads and currently ranks 5th.
Google Play: leading categories in revenue in 1 square. 2013
Games give you more revenue on Google Play than on the App Store.
Leading categories for revenue Google Play 1 square. 2013
- Games
- Communications
- Social networks
- Instruments
- Performance
As of 1 square. In 2013, the category of igor grew and provided about 80% of Google Play revenue, compared with 70% in the App Store.
Source: https://habr.com/ru/post/177277/
All Articles