Methods for assessing the subjective quality of speech
Anyway, the most important resource in data transmission networks is the bandwidth of communication channels. In addition to increasing the maximum bandwidth of communication channels and their number, it is obvious that it makes sense to optimize the use of existing ones. For example, using compression algorithms. For each case, the most optimal algorithm (in terms of computational complexity, compression ratio, etc.) can be its own.
A feature of sound compression is the subjectivity of its perception by man. This at the same time makes it possible to exclude insignificant information from the signal, but also complicates the compression algorithm.
In order to achieve the highest compression ratio with minimal loss of subjective quality, it is necessary to know the laws of its perception. This deals with psychoacoustics .
When using psychoacoustic properties, traditional methods of quality assessment are no longer suitable for compression. For example, the signal-to-noise ratio becomes almost useless, because compression occurs without taking into account those parts that a person does not perceive. Thus, the quality assessment should also take into account the properties of the human hearing system.
Under the cat will be considered some properties of speech signals and features of their perception by man, objective and subjective ways of assessing the quality of these signals.
PS This article used my thesis, defended in 2011 at the Moscow Aviation Institute at the Faculty of Radio Electronics Flying Devices of the Department. 402. Previously, the work has not been published anywhere.
')
In the general case, a speech signal in telecommunications systems means a process that performs the function of transmitting a voice message. It can be acoustic, mechanical, electrical and other processes. A speech message is usually created in the human brain. Then it turns into signals of the nervous system that control the articulation movements of the speech organ. In turn, these movements control the formation of speech signals in the speech-forming path. The speech-forming tract consists of laryngeal, pharyngeal, oral and nasal cavities, the volume and elasticity of the walls of which vary with time. Changes in the configuration of the speech-forming path in the process of making speech sounds affect the acoustic wave passing through the path. The received signals are emitted into the surrounding space as an acoustic signal. Next, the acoustic signal in the transmission path of the telecommunications system is converted into an electrical signal.
In the future, the signal can undergo various transformations, remaining electric. In some cases, after amplification, the electrical signal directly enters the electroacoustic transducer, in other cases, after a series of transformations in form (modulation and demodulation, quantization, coding, companding, etc.) eventually also turns into an acoustic signal, however, the signal may remain digital, for example, in speech recognition tasks. Acoustic signal, acting on the eardrum, turns into a mechanical signal, and in the inner ear - a signal of the nervous system. This signal in the central nervous system is, as it were, decoded, as a result of which the original message is recreated. In some cases, this message may differ from the original one, which is associated with distortions in communication systems.
The frequency of the sound wave can vary greatly, but a person perceives frequencies from 20 to 22 000 Hz (wavelength from 1.56 cm to 17.19 m). The dynamic range of the volume levels perceived by a person is very large.
It was established experimentally that the power of the weakest audible sound is 1 µW. There is also a volume scale in units of sound pressure, where the pressure of 10 ^ –5 N / cm2 is taken as the zero level. For this scale, dB SPL (Sound Pressure Level - SPL) is used.
Practically, the transmission of a voice message via electrical communication is solved by means of a digital representation, processing, and transmission of a speech signal through a communication channel — an acoustic wave represented in the form of electrical oscillation. In such a case, speech represents the vibrations of a complex form, depending on the words being spoken, the timbre of the voice, intonation, gender and age of the speaker. Under the frequency range of speech understand the bandwidth occupied by the speech signal. It lies in the frequency range from 100 to 8000 Hz. However, in accordance with the recommendations of the CCITT (International Advisory Committee on Telephony and Telegraphy), during signal conversion and processing, they are limited to the frequency range from 300 to 3400 Hz.
As already noted, the human hearing aid perceives sounds whose frequency is in the range from 20 to 22,000 Hz. but
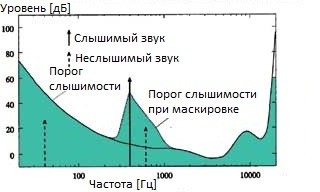
The sensitivity of the human ear is not the same throughout the perceived range.
The figure shows areas of the auditory perception, including the corresponding speech and music:

The frequency range of human speech is approximately in the range from 100 to 8000 Hz.
The existence of a hearing threshold is the basis for the construction of lossy sound compression algorithms.
In addition, for effective compression, two more properties of human hearing organs are used: frequency masking and time masking.
Frequency (auditory) masking occurs when a normally audible sound is covered by another loud sound with a close frequency. The figure schematically depicts the masking and masked sounds:
The audible (masking) sound raises the threshold of hearing in its surroundings (threshold of hearing during masking). As a result, the sound
shown by the dotted line is no longer heard, since it is masked by a louder sound. This property is used in compression. Signals corresponding to such sounds are simply removed from the data set, since they will not be heard anyway. Frequency masking depends on the frequency of the signal. It ranges from 100 Hz at low audible frequencies to 4,000 Hz at high frequencies. Consequently, the range of audible frequencies can be divided into several critical bands, within which the ear sensitivity falls.
Critical bars are another sound characteristic along with frequency. In contrast to frequency, the critical bands are determined in accordance with the auditory perception.
The critical bands can be described as follows: due to the limited hearing of sound frequencies, the threshold of hearing
the frequency f is raised by the adjacent sound, if the sound is in the critical band f. The width of the critical band is called its size.
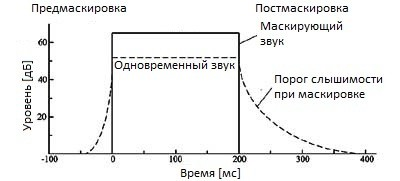
Temporal masking is observed when a loud sound of frequency f in time is preceded or followed by a less loud sound of close frequency (and also with a simultaneous sound of close frequency). The masking of the preceding sound manifests itself in an interval of not more than 10 ms, whereas the subsequent sound can be masked in an interval from 100 to 200 ms.
Given the audience of the portal, there is no special reason to consider the processes of discretization and quantization.
Methods of assessing the quality of the audio signal transmission system are mainly determined by the purpose of this system (speech, music, etc.). A common feature for these systems is that they all eventually come to the human hearing system. When transmitting via communication channels, speech is considered as a random process, the characteristics of which determine the parameters of the transmitted signal (dynamic range, band, signal-to-noise ratio). All these parameters are measurable and can be accurately determined. However, considering that, on the other hand, the speech signal is perceived by a person, it should be noted that, from the person’s point of view, the speech signal is evaluated subjectively, obeying the laws of the psychophysiology of hearing. Thus, we get the following picture: the quality of the speech signal is objectively evaluated by a number of indicators that can never fully replace the system of perception of sound by man. Disregarding the nuances of directly transmitting a speech signal, one can say that an objective assessment of speech quality should correlate with a subjective assessment.
The quality of a codec can be evaluated by two criteria:
Since rigorous mathematical relationships that establish a connection between the objective parameters of the sound path and perception have not yet been obtained, none of the existing methods can provide an accurate assessment of the sound quality. Currently, there are three types of methods for assessing the quality of sound signals: subjective, objective, and psychoacoustic.
To assess the signal distortion, subjective statistical tests (FID) are performed with the help of a group of experts.
Subjective quality assessments are based on the statistical processing of subjective quality assessments of a fairly large number of expert listeners. These assessments significantly depend on the age and gender of the speaker, the speed of pronunciation of phrases and other circumstances. Tests for obtaining subjective assessments are carried out with imitation of real conditions, for example, ambient noise, background speech of other people, etc. The quantitative results of these tests reflect the average quality, level of effort of the listener, intelligibility, and natural sound.
Each separate outcome of the FID is a random event, and the apparatus of probability theory and mathematical statistics is used to analyze the results. However, even taking into account these measures, it is impossible to repeat the test results exactly.
MOS (Mean Opinion Score) expert assessment is a subjective measurement defined in ITU-T Recommendation P.800 for assessing the quality of transmission in telephone networks.
For different tasks, different 5-point category rating scales can be used. The three most used scales of opinion in ITU-T studies are:
The estimated value (average score of opinions) is indicated by
MOS characters. MOS estimates are given in the table:
The absolute values of MOS depend on the context of the tests, they are influenced by differences in the level of knowledge of the language, etc.
Objective methods offer less time-consuming methods compared to subjective ones. Objective methods are based on an assessment of the degree of difference between the encoded and original signals.
The parameters are diverse and for different types of coding may differ fundamentally. Despite the fact that there is some correlation between objective indicators and subjective quality, it is impossible to clearly judge subjective quality, which, in fact, explains the quality assessment method for each of the codecs. Thus, it is obvious that at the moment there is no universal objective method for assessing subjective quality.
The most common estimate is the signal to noise ratio. This method is also called the general signal-to-noise ratio. It takes into account the overall ratio of signal power and noise throughout the duration of the signal. However, at a low intensity of the useful signal, at some segment it may be masked by another part of the signal with a higher intensity of the useful signal, which ultimately distorts the estimate.
It is a development of the signal-to-noise ratio method. In this case, the signal-to-noise ratio is estimated at intervals of 15 to 20 ms, which makes it possible to obtain a more accurate estimate as a whole, since the uneven signal intensity will not distort the whole picture.
Psychoacoustic quality assessment methods take into account the peculiarities of human perception of sound in general and speech in particular. The peculiarity of these methods is that only the subjective quality of the signal is assessed using hardware and software. Thus, strictly speaking, they relate to objective methods, but are built on the basis of the peculiarities of the subjective perception of sound by man.
With the development of ways to eliminate redundancy of audio signals, it became impossible to evaluate the quality by objective parameters, and the subjective statistical tests remained (and remain) very laborious. The elimination of redundancy was based on the features of the perception of sound and speech by man, which led to the application of knowledge about these features in the methods of quality assessment.
The task of any method of assessing the quality of a speech signal is to achieve a high degree of correlation with the subjective statistical tests, which still remains the most accurate assessment of speech quality.
Most of the methods are based on a comparison of the original and coded signals using some psychoacoustic model. The degree of noticeable distortion in the coded signal for a person is evaluated. A psychoacoustic model is a model that converts a sound signal into its internal representation from the point of view of the human hearing aid, which is compared with the internal representation of the original signal.
The most common is weighted spectrum distortion (WSS) and the PESQ estimate, as defined in ITU-T Rec . P.862 .
The WSS method estimates spectrum distortion in 25 critical hearing bands between the original and distorted signal segments.
First, the signal energy is determined in each of the 25 critical bands and the peak critical band is determined, the energy of which is greater than the others. After that, taking into account the information about the peak, the weight coefficient of each critical band is determined. Further, the assessment is formed taking into account the weight and energy of each critical band.
This algorithm is an objective method for determining the quality of voice communication in telephone systems, which predicts the results of a subjective assessment of the quality of this type of communication by expert listeners. To determine the quality of voice transmission, PESQ provides for a comparison of the input, or reference, signal with its distorted version at the output of the communication system. This process is shown schematically in the figure:
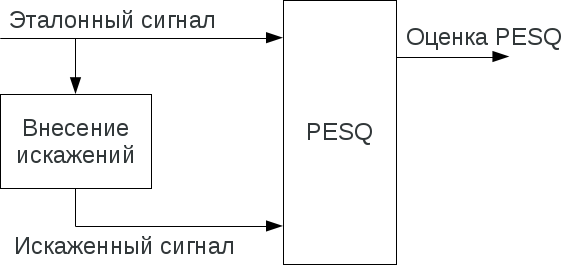
The result of comparing the input and output signals is a communication quality assessment, which is similar to the average subjective MOS score (Mean Opinion Score), determined by a group of expert listeners according to ITU-T P.800 specification. PESQ scores are calibrated using a huge MOS rating database.
PESQ incorporates many new developments, which favorably distinguishes its previous speech codec performance evaluation algorithms, for example, PSQM and MNB [ITU-T P.861]. These innovations make it possible to confidently use PESQ both to determine the quality of end-to-end speech transmission, and to assess the impact on the communication quality of individual elements of network equipment, including codecs.
In the process of developing the PESQ standard, ITU-T specialists selected the best methods for determining the quality of voice communication from the point of view of the correlation of their results with the MOS estimates under various communication conditions, which is a guarantee of good performance of the standardized algorithm when testing conventional (fixed and mobile) networks and transmission systems packet data.
The PESQ algorithm takes into account the following causes of signal quality degradation: coding distortion, transmission errors, packet loss, packet transfer delay time and fluctuation of this time, signal filtering in analog network components.
Signal processing in PESQ:
Thus, the algorithm gives two distortion parameters in which the error values of each type are summed up. At the final stage of the algorithm, these distortion parameters are converted into an estimate of the quality of communication, which is a linear combination of the average values of symmetric and asymmetric distortions.
The PESQ algorithm evaluates speech quality on a five-point scale standardized in the telecommunications industry - from 1 to 5 [ITU-T P.800]. However, the PESQ score does not exceed 4.5, since it is usually the maximum value obtained by subjective testing of MOS.
PESQ assessment characterizes the perception of the quality of communication by users. A higher score of 4.5 means that the algorithm did not reveal any distortions.
A feature of sound compression is the subjectivity of its perception by man. This at the same time makes it possible to exclude insignificant information from the signal, but also complicates the compression algorithm.
In order to achieve the highest compression ratio with minimal loss of subjective quality, it is necessary to know the laws of its perception. This deals with psychoacoustics .
When using psychoacoustic properties, traditional methods of quality assessment are no longer suitable for compression. For example, the signal-to-noise ratio becomes almost useless, because compression occurs without taking into account those parts that a person does not perceive. Thus, the quality assessment should also take into account the properties of the human hearing system.
Under the cat will be considered some properties of speech signals and features of their perception by man, objective and subjective ways of assessing the quality of these signals.
PS This article used my thesis, defended in 2011 at the Moscow Aviation Institute at the Faculty of Radio Electronics Flying Devices of the Department. 402. Previously, the work has not been published anywhere.
')
Speech signal and its basic properties
In the general case, a speech signal in telecommunications systems means a process that performs the function of transmitting a voice message. It can be acoustic, mechanical, electrical and other processes. A speech message is usually created in the human brain. Then it turns into signals of the nervous system that control the articulation movements of the speech organ. In turn, these movements control the formation of speech signals in the speech-forming path. The speech-forming tract consists of laryngeal, pharyngeal, oral and nasal cavities, the volume and elasticity of the walls of which vary with time. Changes in the configuration of the speech-forming path in the process of making speech sounds affect the acoustic wave passing through the path. The received signals are emitted into the surrounding space as an acoustic signal. Next, the acoustic signal in the transmission path of the telecommunications system is converted into an electrical signal.
In the future, the signal can undergo various transformations, remaining electric. In some cases, after amplification, the electrical signal directly enters the electroacoustic transducer, in other cases, after a series of transformations in form (modulation and demodulation, quantization, coding, companding, etc.) eventually also turns into an acoustic signal, however, the signal may remain digital, for example, in speech recognition tasks. Acoustic signal, acting on the eardrum, turns into a mechanical signal, and in the inner ear - a signal of the nervous system. This signal in the central nervous system is, as it were, decoded, as a result of which the original message is recreated. In some cases, this message may differ from the original one, which is associated with distortions in communication systems.
The frequency of the sound wave can vary greatly, but a person perceives frequencies from 20 to 22 000 Hz (wavelength from 1.56 cm to 17.19 m). The dynamic range of the volume levels perceived by a person is very large.
Therefore, when measuring the sound volume using a logarithmic scale
Level = 10 * lg (P1 / P2) [dB]
It was established experimentally that the power of the weakest audible sound is 1 µW. There is also a volume scale in units of sound pressure, where the pressure of 10 ^ –5 N / cm2 is taken as the zero level. For this scale, dB SPL (Sound Pressure Level - SPL) is used.
Practically, the transmission of a voice message via electrical communication is solved by means of a digital representation, processing, and transmission of a speech signal through a communication channel — an acoustic wave represented in the form of electrical oscillation. In such a case, speech represents the vibrations of a complex form, depending on the words being spoken, the timbre of the voice, intonation, gender and age of the speaker. Under the frequency range of speech understand the bandwidth occupied by the speech signal. It lies in the frequency range from 100 to 8000 Hz. However, in accordance with the recommendations of the CCITT (International Advisory Committee on Telephony and Telegraphy), during signal conversion and processing, they are limited to the frequency range from 300 to 3400 Hz.
Subjective perception of sound
As already noted, the human hearing aid perceives sounds whose frequency is in the range from 20 to 22,000 Hz. but
The sensitivity of the human ear is not the same throughout the perceived range.
The figure shows areas of the auditory perception, including the corresponding speech and music:
The frequency range of human speech is approximately in the range from 100 to 8000 Hz.
The existence of a hearing threshold is the basis for the construction of lossy sound compression algorithms.
Frequency masking
In addition, for effective compression, two more properties of human hearing organs are used: frequency masking and time masking.
Frequency (auditory) masking occurs when a normally audible sound is covered by another loud sound with a close frequency. The figure schematically depicts the masking and masked sounds:
The audible (masking) sound raises the threshold of hearing in its surroundings (threshold of hearing during masking). As a result, the sound
shown by the dotted line is no longer heard, since it is masked by a louder sound. This property is used in compression. Signals corresponding to such sounds are simply removed from the data set, since they will not be heard anyway. Frequency masking depends on the frequency of the signal. It ranges from 100 Hz at low audible frequencies to 4,000 Hz at high frequencies. Consequently, the range of audible frequencies can be divided into several critical bands, within which the ear sensitivity falls.
Critical stripes
Critical bars are another sound characteristic along with frequency. In contrast to frequency, the critical bands are determined in accordance with the auditory perception.
25 approximate areas of critical bands are given in the table.
| No | Region | No | Region | No | Region | No | Region | No | Region |
|---|---|---|---|---|---|---|---|---|---|
| one | 0-100 | 6 | 510-630 | eleven | 1270-1480 | sixteen | 2700-3150 | 21 | 6400-7700 |
| 2 | 100-200 | 7 | 630-770 | 12 | 1480-1720 | 17 | 3150-3700 | 22 | 7700-9500 |
| 3 | 200-300 | eight | 770-920 | 13 | 1720-2000 | 18 | 3700-4400 | 23 | 9500-12000 |
| four | 300-400 | 9 | 920-1080 | 14 | 2000-2320 | nineteen | 4400-5300 | 24 | 12000-15500 |
| five | 400-510 | ten | 1080-1270 | 15 | 2320-2700 | 20 | 5300-6400 | 25 | 15500-23500 |
The critical bands can be described as follows: due to the limited hearing of sound frequencies, the threshold of hearing
the frequency f is raised by the adjacent sound, if the sound is in the critical band f. The width of the critical band is called its size.
Temporary masking
Temporal masking is observed when a loud sound of frequency f in time is preceded or followed by a less loud sound of close frequency (and also with a simultaneous sound of close frequency). The masking of the preceding sound manifests itself in an interval of not more than 10 ms, whereas the subsequent sound can be masked in an interval from 100 to 200 ms.
Converting speech signals to digital form
Given the audience of the portal, there is no special reason to consider the processes of discretization and quantization.
Methods for assessing speech quality
Methods of assessing the quality of the audio signal transmission system are mainly determined by the purpose of this system (speech, music, etc.). A common feature for these systems is that they all eventually come to the human hearing system. When transmitting via communication channels, speech is considered as a random process, the characteristics of which determine the parameters of the transmitted signal (dynamic range, band, signal-to-noise ratio). All these parameters are measurable and can be accurately determined. However, considering that, on the other hand, the speech signal is perceived by a person, it should be noted that, from the person’s point of view, the speech signal is evaluated subjectively, obeying the laws of the psychophysiology of hearing. Thus, we get the following picture: the quality of the speech signal is objectively evaluated by a number of indicators that can never fully replace the system of perception of sound by man. Disregarding the nuances of directly transmitting a speech signal, one can say that an objective assessment of speech quality should correlate with a subjective assessment.
The quality of a codec can be evaluated by two criteria:
- Objective quality preservation
Distortion detection using hardware. - Preservation of subjective quality
Determination of the visibility of distortion by subjective statistical
tests.
Since rigorous mathematical relationships that establish a connection between the objective parameters of the sound path and perception have not yet been obtained, none of the existing methods can provide an accurate assessment of the sound quality. Currently, there are three types of methods for assessing the quality of sound signals: subjective, objective, and psychoacoustic.
Subjective methods
To assess the signal distortion, subjective statistical tests (FID) are performed with the help of a group of experts.
Subjective quality assessments are based on the statistical processing of subjective quality assessments of a fairly large number of expert listeners. These assessments significantly depend on the age and gender of the speaker, the speed of pronunciation of phrases and other circumstances. Tests for obtaining subjective assessments are carried out with imitation of real conditions, for example, ambient noise, background speech of other people, etc. The quantitative results of these tests reflect the average quality, level of effort of the listener, intelligibility, and natural sound.
Each separate outcome of the FID is a random event, and the apparatus of probability theory and mathematical statistics is used to analyze the results. However, even taking into account these measures, it is impossible to repeat the test results exactly.
MOS (Mean Opinion Score) expert assessment is a subjective measurement defined in ITU-T Recommendation P.800 for assessing the quality of transmission in telephone networks.
For different tasks, different 5-point category rating scales can be used. The three most used scales of opinion in ITU-T studies are:
Quality scale when listening
| Speech quality | Evaluation |
|---|---|
| Great | five |
| Good | four |
| Satisfactory | 3 |
| Mediocre | 2 |
| The bad | one |
Effort when listening
| The effort required to understand the meaning of phrases | Evaluation |
|---|---|
| Perhaps complete relaxation, no effort required. | five |
| Attention needed, does not require noticeable effort | four |
| Requires moderate effort | 3 |
| Significant effort required | 2 |
| The meaning is not clear under any conditions. | one |
Preference scale by volume
| Volume Preference | Evaluation |
|---|---|
| Much louder than preferred level | five |
| Louder than preferred | four |
| Preferred level | 3 |
| Quiet preferred level | 2 |
| Significantly quieter preferred level | one |
The estimated value (average score of opinions) is indicated by
MOS characters. MOS estimates are given in the table:
| Subjective quality assessment speech sound | The level of perception of speech information | Evaluation |
|---|---|---|
| Fine | Speech is perceived completely and effortlessly. | five |
| Good | Speech is perceived freely, without appreciable effort. | four |
| Satisfactorily | Speech is perceived with moderate effort, the presence of defects is indisputable | 3 |
| poorly | Speech is perceived attention | 2 |
| Very bad | Speech is not perceived in whole or in part. | one |
The absolute values of MOS depend on the context of the tests, they are influenced by differences in the level of knowledge of the language, etc.
Objective methods
Objective methods offer less time-consuming methods compared to subjective ones. Objective methods are based on an assessment of the degree of difference between the encoded and original signals.
The parameters are diverse and for different types of coding may differ fundamentally. Despite the fact that there is some correlation between objective indicators and subjective quality, it is impossible to clearly judge subjective quality, which, in fact, explains the quality assessment method for each of the codecs. Thus, it is obvious that at the moment there is no universal objective method for assessing subjective quality.
Signal to noise ratio (SNR)
The most common estimate is the signal to noise ratio. This method is also called the general signal-to-noise ratio. It takes into account the overall ratio of signal power and noise throughout the duration of the signal. However, at a low intensity of the useful signal, at some segment it may be masked by another part of the signal with a higher intensity of the useful signal, which ultimately distorts the estimate.
Segment signal / noise ratio (segSNR)
It is a development of the signal-to-noise ratio method. In this case, the signal-to-noise ratio is estimated at intervals of 15 to 20 ms, which makes it possible to obtain a more accurate estimate as a whole, since the uneven signal intensity will not distort the whole picture.
Psychoacoustic methods
Psychoacoustic quality assessment methods take into account the peculiarities of human perception of sound in general and speech in particular. The peculiarity of these methods is that only the subjective quality of the signal is assessed using hardware and software. Thus, strictly speaking, they relate to objective methods, but are built on the basis of the peculiarities of the subjective perception of sound by man.
With the development of ways to eliminate redundancy of audio signals, it became impossible to evaluate the quality by objective parameters, and the subjective statistical tests remained (and remain) very laborious. The elimination of redundancy was based on the features of the perception of sound and speech by man, which led to the application of knowledge about these features in the methods of quality assessment.
The task of any method of assessing the quality of a speech signal is to achieve a high degree of correlation with the subjective statistical tests, which still remains the most accurate assessment of speech quality.
Most of the methods are based on a comparison of the original and coded signals using some psychoacoustic model. The degree of noticeable distortion in the coded signal for a person is evaluated. A psychoacoustic model is a model that converts a sound signal into its internal representation from the point of view of the human hearing aid, which is compared with the internal representation of the original signal.
The most common is weighted spectrum distortion (WSS) and the PESQ estimate, as defined in ITU-T Rec . P.862 .
Weighted Spectral Distortion (WSS)
The WSS method estimates spectrum distortion in 25 critical hearing bands between the original and distorted signal segments.
First, the signal energy is determined in each of the 25 critical bands and the peak critical band is determined, the energy of which is greater than the others. After that, taking into account the information about the peak, the weight coefficient of each critical band is determined. Further, the assessment is formed taking into account the weight and energy of each critical band.
PESQ Evaluation
This algorithm is an objective method for determining the quality of voice communication in telephone systems, which predicts the results of a subjective assessment of the quality of this type of communication by expert listeners. To determine the quality of voice transmission, PESQ provides for a comparison of the input, or reference, signal with its distorted version at the output of the communication system. This process is shown schematically in the figure:
The result of comparing the input and output signals is a communication quality assessment, which is similar to the average subjective MOS score (Mean Opinion Score), determined by a group of expert listeners according to ITU-T P.800 specification. PESQ scores are calibrated using a huge MOS rating database.
PESQ incorporates many new developments, which favorably distinguishes its previous speech codec performance evaluation algorithms, for example, PSQM and MNB [ITU-T P.861]. These innovations make it possible to confidently use PESQ both to determine the quality of end-to-end speech transmission, and to assess the impact on the communication quality of individual elements of network equipment, including codecs.
In the process of developing the PESQ standard, ITU-T specialists selected the best methods for determining the quality of voice communication from the point of view of the correlation of their results with the MOS estimates under various communication conditions, which is a guarantee of good performance of the standardized algorithm when testing conventional (fixed and mobile) networks and transmission systems packet data.
The PESQ algorithm takes into account the following causes of signal quality degradation: coding distortion, transmission errors, packet loss, packet transfer delay time and fluctuation of this time, signal filtering in analog network components.
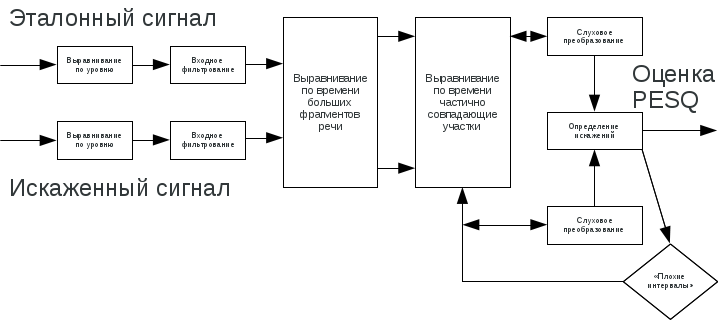
Signal processing in PESQ:
- Leveling
To correctly compare input and output speech signals, their power level must be equalized. This is necessary because the input signal cannot be of any particular level, and the gain of the system under test is unknown before testing.
In PESQ, it is assumed that the level of the signal being heard is constant and equal to 79 dB of sound pressure at the ERP point (Ear Reference Point) [ITU-T P.830 Section 8.1.2]. To bring to the specified level, both signals are amplified - input and output. - Input filtering
Analog connections often filter the signals transmitted through them to one degree or another. For example, the transmitting part of the handset usually filters the speech signal, having an amplitude-frequency characteristic (AFC), which is similar to the standard Modified IRS (Intermediate Reference System) send [ITU-T P.830]. As a rule, this is permissible, since this kind of signal processing has a smaller impact on the quality of communication than the signal distortions that occur during its coding. - Time alignment
A variable signal transmission delay may occur in a communication system. To correctly compare the input and output signals, they must be aligned relative to each other in time. In PESQ, the signal is listened on, but there is no information about the latency of the latter on the network. A voice is detected in the PESQ to identify the speech parts of the signal and discard the noise.
Time alignment is performed in three stages:- In the first stage, PESQ aligns large portions of active speech identified by a voice detector. These fragments may contain pauses, the duration of which does not exceed a predetermined threshold value (200 ms). In this process, a delay is detected in the transmission of large fragments of the output signal compared to the input signal.
- In the second stage, PESQ evens out partially coinciding small sections of speech (frames). This process reveals a delay, which is not constant during the transmission of a large fragment of active speech; in packet networks, such a delay can be quite significant.
- The third stage is carried out after the operation of the auditory transformation. At this stage, the so-called “bad intervals” (fragments of speech with very large distortions) are re-aligned. This step improves the accuracy of the algorithm when using a small number of files, the transfer of which incorrectly determines the delay variation during the initial time alignment process.
- Auditory conversion
Comparison of the input and output signals is preceded by their auditory transformation, which mimics certain features of human hearing. This gives information about the perceived loudness of the signal depending on time and frequency, represented as a sensation surface. Determination of the distortion parameters. The difference between the perceptual surfaces of the input and output files is called the error surface; it indicates all audible differences in the sound of these files appearing in the system under test. The error surface is analyzed taking into account the effect on the communication quality of those small signal distortions that are not audible against the background of high-volume signals (masking effect). Based on information about positive and negative errors, two distortion parameters are calculated as nonlinear means over specific areas of the error surface. These parameters are:- Absolute (symmetric) distortion absolute audible error
- Additional (asymmetric) distortion - characterize audible errors that are significantly louder than the input signal
Thus, the algorithm gives two distortion parameters in which the error values of each type are summed up. At the final stage of the algorithm, these distortion parameters are converted into an estimate of the quality of communication, which is a linear combination of the average values of symmetric and asymmetric distortions.
The PESQ algorithm evaluates speech quality on a five-point scale standardized in the telecommunications industry - from 1 to 5 [ITU-T P.800]. However, the PESQ score does not exceed 4.5, since it is usually the maximum value obtained by subjective testing of MOS.
PESQ assessment characterizes the perception of the quality of communication by users. A higher score of 4.5 means that the algorithm did not reveal any distortions.
Used sources
- Sergeenko V.S., Barinov V.V., Data compression, speech, sound and images in telecommunication systems, 2009, IP "Radiosoft"
- Richter SG, Coding and voice transmission in digital mobile communication systems, 2009, Hotline - Telecom
- ITU-T P.800
Source: https://habr.com/ru/post/177099/
All Articles