Nonlinear dimension compression using a limited Boltzmann machine
 Hey. In this post we will continue to experiment with the limited Boltzmann machine . In the previous post on regularization in the BSR, we saw how to get more local features that have a greater generalizing ability. But we did not appreciate their robustness compared to simpler and faster algorithms. For this experiment, we turn to the linear method of principal components (you can familiarize yourself with this method and look at the implementation on c # in my first post ). Those wishing to familiarize themselves with the original source on the theory of compression of dimension using the RBM recommend looking through the articles of Jeffrey Hinton here and here . We will continue testing on a set of printed large letters: train the BSR, build the main components, generate compressed data representations, and restore the original images from them, and then evaluate the difference between the original and recovered images.
Linear main components
')
It is understood that you are familiar with the main component method, if not, then you are here . For this experiment, I use a variety of images of 29 by 29 pixels, which show large letters of the English alphabet of four different fonts and three styles, as well as the same images with noises, a total of 4,056 images. The test set consists of the same set of letters, but with a lot of noise - 3432 pieces. So let's get started, in R the code looks quite simple:
m.pca <- eigen(cov(m)) . The importance of the main components can be estimated by their main values, first normalizing them by the sum of these values. The result will be the following graphics. The first one shows what percentage of variation describes each main component , the second one shows the sum of the explained variation at each step.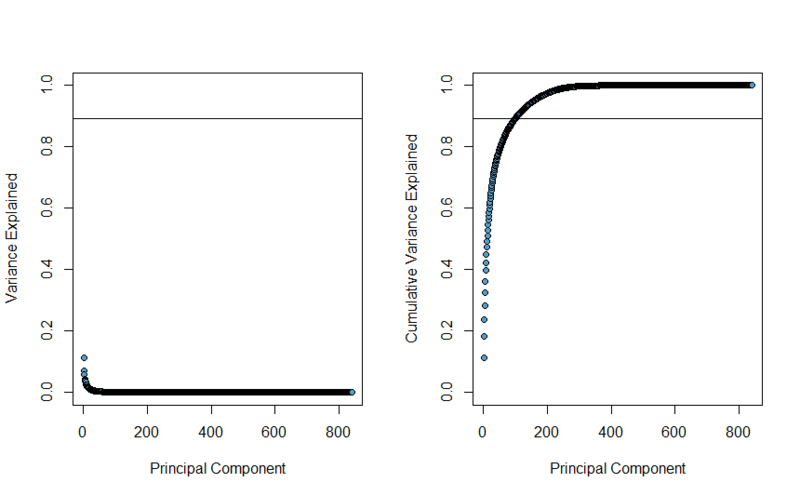
In the BSR, we will use 100 hidden states, so for honesty, we will select the first 100 main components, which explain 89.36% of variability, this level is shown as a line in the graphs above.
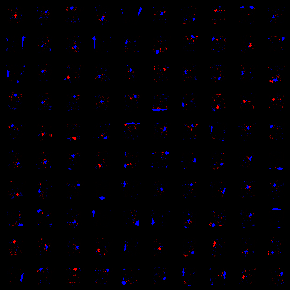
Each major component can be interpreted as a 29 by 29 pixel image that detects some features of the data set. You can draw an analogy with the weights of hidden neurons of the limited Boltzmann machine, and visualize as we did in previous posts . Let me remind you that in the second image the black color corresponds to the zero value, the increase in the red component - the increase in the value in the positive direction, the blue, respectively - in the negative.
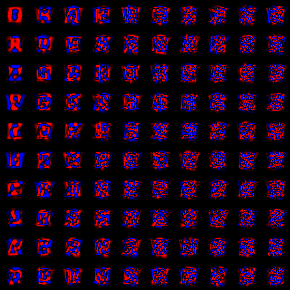
The order of the main components from left to right, top to bottom. The features turned out pretty big, each of them has approximately the average size of the letter from the training set. At the expense of speech interpretation does not go at all, well, except for the first few components.
Restricted Boltzmann machine
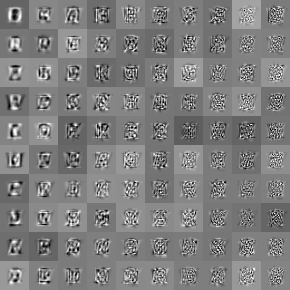
For this experiment, I used the settings described in the previous post for L1 regularization, the only thing that was changed is the training set (as described above) and the number of iterations was 5000, it took about 14 hours (I feel it's time to rewrite the GPU). At this point, the cross-qualification error was still falling, so the training could continue. The result was the following weight.
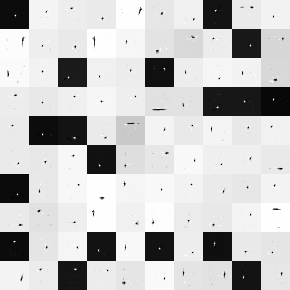
As you can see, the features are very local, mostly these are primitives of the type of small spots and boundary lines, by combining some of them you can study the topological features of the images from the training set. Due to their locality, very small receptor fields of neurons can be built, i.e. reset to 95% of the weights of each neuron, which will significantly increase the speed of the data projection algorithm, which is really important.
Regenerating ability
Let's take a look at some examples of images reconstructed using two models. In the first column, the original images, in the second, recovered using PCA, in the third, using RBM.
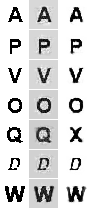

When I saw that the background in the PCA-reconstructions is too gray, I tried, by analogy with the eigenface , to do a normalization by the mean value, but in the end, the reconstructed images did not differ much from the above. The enlarged example shows that the image is blurred along the borders, although in the case of PCA it is slightly larger.
As an estimate of the distance between the images, we will use the L1-metric :

The result was the following, I recall that the test set did not participate either in the construction of the BSR model or in the calculation of the main components:
| PCA | RBM | |
|---|---|---|
| Train set | 29.134736802449488 | 21.79797897303671 |
| Test set | 49.231927648058118 | 29.970740205433025 |
As you can see, the result in both cases is on the RBM side.
Conclusion
The RBM has several ways to improve quality. First, I stopped learning at 5,000 iterations, although we could continue learning, say, until the cross-qualification error starts to grow. Secondly, you can continue to play with the parameters of training. Thirdly, the features are quite local, which can increase the speed of the algorithm. Fourth, it is easy to see that many features in the BSR are almost identical, which gives us the ability to cluster the features and merge the clusters so as not to calculate their value several times, or train the BSR with fewer hidden neurons.
Source: https://habr.com/ru/post/176257/
All Articles