SSAS 2012: from multidimensional to tabular data model
Introduction
The Tabular Data Model as the basis for business intelligence solutions was proposed by Microsoft in a component called PowerPivot , a modest addition to Microsoft Office Excel. Since then, discussions about the meaning of this model have not subsided to this day. The apologists of the new technology are convinced of its revolutionism, skeptics believe that this is nothing more than an evolutionary movement. In SQL Server 2012 Analysis Services (SSAS 2012), Microsoft introduced the now server-side version of an analytical database based on the principles of the Tabular Model. Naturally, this can not add to the debates a fresh stream.
At first glance, skeptics are right. Indeed, as will be shown later, from a purely technical point of view, this technology does not contain anything outstanding. Nevertheless, the Tabular Data Model can be considered a revolutionary step. Simply, the main revolutionary achievement is not in the technical field.
In this essay, I will try, first, to show what causes and circumstances led to the emergence of this model, and, secondly, to clarify the issue of its revolutionism.
Prerequisites
Each significant technical solution has its own prerequisites. Of course, the appearance of the Tabular model also has its reasons.
')
The main (though not the only) prerequisite was the sharply increased interest in the methods of IT business intelligence from small and medium-sized businesses . As a result, the search for convenient tools and methods for interactive business analysis. In the course of this search, it turned out that the so-called Multidimensional Data Analysis occupies almost a monopoly position in this area. At the same time, it became obvious that this technology, providing remarkable flexibility and performance in solving analytical problems in large organizations, is too cumbersome and unnecessarily difficult for business analysis in small enterprises.
Accordingly, there is a need for simplified technologies adapted for the business objectives of small enterprises. Tabular Data Analysis on the basis of the Tabular Model has become just such a wonderful solution.
(The natural consequence was the “overthrow” of the monopoly of the Multidimensional Analysis in the area of interactive business intelligence - what a revolutionary transformation costs without overthrowing? However, nobody canceled the Multidimensional Analysis, it only slightly pressed it so that now it will have to divide another very promising technology.)
Another introduction to business analytics
For the sake of coherence, further presentation, alas, cannot be done without a small introduction to business analysis. Detailed introductions to business analytics can be found easily on the Internet, so I will try to be as brief as possible.
First , we give a definition. Business analysis is a process in which conclusions are drawn, business solutions are proposed, and forecasts are made. Of course, all this should be done by a person who is an expert in the relevant field of business: finance, logistics, marketing, etc. Such a specialist is, in fact, an analyst. The initial information for the analysis process is traditionally placed in IT structures, so that the analyst cannot do without the services of an IT specialist to extract it. Thus, two aspects are involved in the business intelligence process: the analyst and the IT specialist as an information provider. The overall effectiveness of the process depends on the success of their “symbiosis”.
Second , what materials does the analyst need? More precisely, what materials does he need from an IT specialist? Here the answer is unexpectedly simple - pivot tables and charts are required. Many and different.
Thirdly , the relationship between an IT specialist and an analyst is built in accordance with the well-known dilemma: “What should a fish or a fishing rod give to the needy?”. That is, either an IT specialist will produce the necessary analytics tables and charts (the fish option), or the analyst himself will create his own tables and diagrams, and the IT specialist will only provide him with the necessary data and tools (the fishing rod option). Without going into the pros and cons of each of these approaches, we note that current trends clearly show in favor of the second option.
Fourth , since the analyst himself will construct tables and diagrams for himself, it is necessary to provide him with convenient and relatively simple tools. The choice of such software tools is large enough, so if you want you can find for every taste. Microsoft, in particular, offers the wonderful and most popular Microsoft Office Excel tool with the PivotTable functionality for these tasks (not to be confused with PowerPivot - this is not the same thing).
Finally, the fifth . For an IT specialist, the main problem is to provide the source data needed by the analyst in the most convenient, comfortable way. This task, in turn, is based on several simple approaches: a) select only those data that are really needed for work; b) define logical connections between them; c) assign clear names to this data; d) categorize them. Such a convenient and understandable data placement for further business analysis is called a semantic model . Traditionally, such models are sets of tables connected in the form of a "star" or "snowflake".
Thus, the main task of an IT professional specializing in business intelligence is summarized as follows: creating a semantic data model.
For many years, the Multidimensional Cube acted as such a semantic model. And it is his goal to replace, at least in certain areas of business, the new semantic model - the Tabular Data Model.
Typical process chain
To show the logic of this transition, I will allow myself a few illustrations.
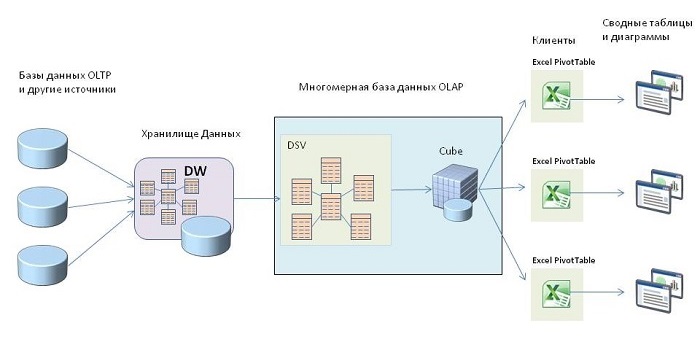
First, let's take a look at a simplified image showing a typical technological chain for business intelligence of a large enterprise.

- Traditionally, the original source of data is the online transaction processing database (OLTP), which displays current business processes (for example, placement and promotion of orders). Without going into details, I note that the specificity of these bases is such that they, as a rule, are not very suitable for direct business analysis.
- Accordingly, the data from these databases are exported to special Data Warehouses (DW - Data Warehouses). Such storage facilities are able to accumulate and combine data from a wide variety of sources. We note an important point - the data structure in the storages usually does not repeat the structure of the original OLTP databases. On the contrary, they try to place information in a relatively convenient and understandable form - usually in the form of a “star” or “snowflake”, so that at this level one can discern a prototype of a semantic model.
- The repositories, in turn, act as sources for the so-called Multidimensional OLAP Databases (Online Analytical Processing). There are two logical levels in such databases: Data Source View (DSV - Data Source View) and the Multidimensional Cube itself. The purpose of DSV is to provide an intermediate model for the subsequent creation of cubes: first, DSV selects (filters) to display only the necessary tables; secondly, these tables, selected from various sources, are united by links into a single model. DSV is the original structure for creating Multidimensional Cubes, which are the final semantic models. As you can see in the picture, one OLAP database can contain several DSVs, and, in turn, one DSV can serve as the basis for creating several cubes.
- Analysts, using client applications such as Excel PivotTable, connect to the OLAP database, select the desired cube, and use its structure and data to create their pivot tables and charts.
- In this chain, we see four levels of data models: OLTP database structure, storage structure, DSV and cube. It is important to note that the last three models - DW, DSV and Cube - usually have a completely understandable form for the analyst and, with certain reservations, can be considered semantic.
From multidimensional model to tabular
It is natural to ask the question - are there too many semantic models in this sequence? The answer depends on the size of the enterprise. For a large enterprise that has hundreds, and possibly thousands of OLTP databases, dozens of cubes and storages, such a chain is by no means redundant. On the contrary, it provides the maximum flexibility of decisions and, accordingly, is completely justified.
Otherwise, the situation with a small enterprise looks like, where the OLTP account goes to the units, and for the analysis only one storage and, often, one cube is enough. Here, the presence of three consecutive semantic (or almost semantic) models may be an obvious redundancy.
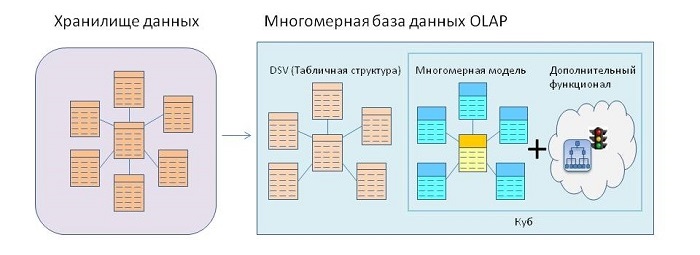
A simplified image in this case will look like this:
Here, perhaps, it is time to look “inside” of the Multidimensional cube itself, which so far in our consideration was a “black box”.
The basis of the cube is the so-called Multidimensional Model. This model assumes that the ultimate goal is to produce pivot tables, which are aggregated data sets. Accordingly, in the model, all the data are initially divided into two types: those that are intended for subsequent aggregation — the so-called measures (measures), and those that set the context of aggregation — they are called dimensions. For example, we are going to create a table where the vertical names of the stores are indicated, horizontally - years, and inside the total sales volumes by years and stores. In this case, the volume of sales in the model appears as a measure, years and stores - as attributes of measurements, and summation is a special case of aggregation. For added convenience, the logical connections between measures and measurements are specified directly in the model, and the aggregation functions are tied directly to the measures also within the model. So, to create a pivot table, all you need to do is choose the necessary measures and measurement attributes, all the rest — the logical connections between the selected components and the aggregation method are taken directly from the model itself, so to speak, “transparent” to the user.
Thus, the Multidimensional Model is, in fact, a collection of many measures and dimensions, logically interconnected . From here, by the way, the very name “multidimensional” itself, measures and measures themselves have a completely tabular, “two-dimensional” form.
It is important to note that in addition to the model itself, the cube has additional functionality that is interesting for the end user, for example, the ability to create hierarchies from dimension attributes and the currently very popular components - Key Performance Indicators (KPI).
Accordingly, the cube can be represented as follows:

Now back to our technology chain for a small business. For compactness, only those components that contain the semantic models we are interested in (DW, DSV and Cube) are displayed in the picture.
Here we face a situation that is often encountered in practice - all three models are very similar, especially DSV and the Multidimensional model. So the decision suggests itself - to throw something away. The question is what?
And here, the developers of Microsoft made, at first glance, a paradoxical decision - to remove the Multidimensional model from the chain , and with it the very concept of the Multidimensional Cube! Add the rest of the cube functionality (hierarchy, KPI, etc.) directly to the DSV! The paradox is that it would be technically easier to remove the DSV, and leave the cube along with all its existing and proven functionality intact. Still did as they did!
Before explaining the meaning of this paradoxical solution, let us see how our analytical base now looks. Now it is already called the Table Model Database . The DSV itself, which received the “cube” functionality, is also called differently the Tabular Data Model .
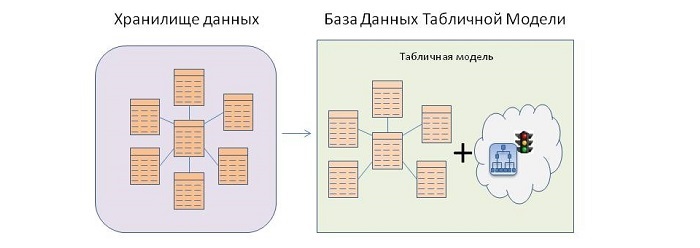
The overall picture of the technological chain will look something like this:

Immediately, we note that little has changed for customers here. You can connect to the Table Model Database, using familiar methods, for example, using the already mentioned Excel PivotTable tool (a slight technical difference - there can be only one model in the database).
So what's the revolutionism?
And now we will return to the main question of our essay - so what is the revolutionary nature of this decision? All that has been considered so far, it would seem, pours water on the skeptics mill. In fact, for final consumers - analysts - virtually nothing has changed. From the point of view of IT-technology, it also seems to be nothing outstanding: the removal of the redundant link in the technological chain is, of course, a technical trifle.
To answer, let us once again return to the paradox, to which we have already paid attention: instead of following the path of least resistance and throwing the DSV as an extra link, the Microsoft developers came unexpectedly - withdrew the Multidimensional model. And after the removal of the Multidimensional Model, the Multidimensional Cube disappeared from the base, and after that the very concept of Multidimensional Analysis disappeared.
No matter how paradoxical it may seem, it is this removal of “multidimensionality” that is the main revolutionary achievement!
To put it simply, the Microsoft developers took the opportunity to get rid of these "multidimensional" terms, which are real horror stories for the uninitiated and create a serious psychological barrier for those who are only going to step on the path of business analysts.
In fact, for those beginners who still remember something from the institute course in higher mathematics, “multidimensional data analysis” causes a definite association with “mathematical multidimensional analysis”. The latter is a highly respected area of mathematics with such remarkable concepts as double, triple, and curvilinear integrals, but has nothing to do with business intelligence. Nevertheless, the proposal to engage in business analytics and, accordingly, “multidimensional analysis” by the uninitiated is perceived (often subconsciously) as an invitation to plunge into the wilds of mathematical analysis and linear algebra again. This usually causes emotions far from enthusiastic.
And for those who are not burdened by such associations, the phrase “let's mentally imagine an N-dimensional cube” , with which the study of technology usually begins, may well contribute to the development of an inferiority complex.
The terms "multidimensional cube", "multidimensional" model, "multidimensional analysis" put pressure on the psyche of an ordinary person, create a psychological barrier and, accordingly, are a brake on the development of this field - this is a simple truth discovered by Microsoft developers. Get rid of the "multidimensional" terminology, replace it with such simple and familiar "flat" terms as tables and columns - and the psychological barrier will disappear.
Getting rid of the “multidimensional” terminology and, accordingly, removing the psychological barrier preventing new fresh forces from entering the business analyst - this is a real revolutionary idea of the Tabular Model technology!
Conclusion
In conclusion, for those who consider the psychological barrier something far-fetched, I will give one illustrative example from the adjacent field - the story of PowerShell.
For many years, Microsoft tried to instill VBScript (a truncated version of Visual Basic) as a tool for automating administrative tasks. And all these years, sysadmins (not all of course, but many - such things in general appear only statistically) strongly opposed this quite worthy tool, preferring to create automation scripts in a much more primitive command line language. The confrontation lasted for years, until someone had a bright mind to offer sysadmins a new advanced automation mechanism, but outwardly resembling their usual command line - PowerShell . And it went smoothly - the new toolkit was accepted with delight, although, we confess, to be frankly, PowerShell is not much simpler than VBScript. Just here the psychological moment was correctly taken into account.
Source: https://habr.com/ru/post/175587/
All Articles