Don Jones "Creating a unified IT monitoring system in your environment" Chapter 4.Monitoring: a look beyond the limits of the data center

This chapter discusses how to combine external and internal monitoring. What to look for when building the system, what are the limitations. How not to miss the little things and get the opportunity to view the picture not only from the bottom up, but also from the top down.
Content
Chapter 1. Managing your IT environment: four things you do wrong
Chapter 2. Elimination of management practices for individual sites in IT management
Chapter 3. We combine everything into a single IT management cycle
Chapter 4. Monitoring: a look beyond the data center
Chapter 5: Turning Problems into Solutions
Chapter 6: Unified Case Management
')
Chapter 4: Monitoring: A look beyond the data center
IT has already gone beyond our own data centers and virtually every organization has one or two services outsourced. Although we may always have our own home monitoring and management tools, we need to understand that in most cases, monitoring should continue outside of our data center. This also applies to the placement of remote services and to a more accurate understanding of what our users actually experience when working with such services.
Technical meter monitoring versus end user experience (EUE)
I call the traditional approach to IT monitoring “from the inside out” (or upside down). It starts in the data center and gradually moves to the end user. Figure 4.1 shows how a typical monitoring system starts with a backend: a DBMS server, applications, web servers, cloud servers, and so on. The most reasonable argument in favor of such a structure is that we have the best control over the equipment installed in our data center. If everything works well inside the datacenter, then there is every reason to believe that the end users who use the services of the datacenter should be quite happy.
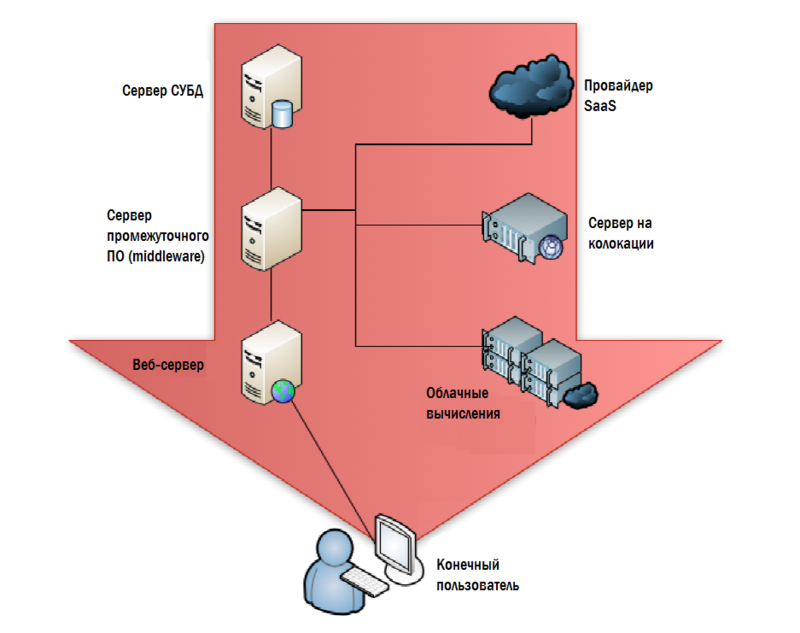
Figure 4.1: Monitoring by the data center.
Most SLAs are based on this approach. We prescribe in them a certain value of service availability, set threshold figures for metrics, information for which is collected in the data center: CPU utilization, networks, disks, etc. We are also interested in low-level parameters: response time to requests, disk response time, network latency, and so on.
There is something deeply wrong in the initial premises of this approach: if you got a beautiful brick during construction, it’s not a fact that you can build a house out of it that does not fall apart. In other words, what end users feel when working is not a simple sum of data center technical metrics. If the data center works well, then users are usually happy, but this is not always the case.
Obviously, tracking the key parameters of the data center is extremely important, but these are not the only things that need to be monitored and measured. Now in the industry there is a perception that we need direct measurements of what the user is experiencing. In fact, “end user experience” or EUE has become a common term in advanced circles of IT managers.
We can give another example. Suppose you come to a restaurant: your steak, it seems, is not roasted, they brought you the wrong side dish and the waiter is rude. And the manager, who is standing in the kitchen, thinks that everything is in order: the steak is hot, the vegetables, too, and the waiter smiles at him every time the manager sees him (her). He only thinks about the kitchen backend, and he knows nothing about your unfulfilled expectations. In restaurants, this problem is solved by the fact that the manager periodically goes into the hall and asks the guests if everything is in order? This is how EUE is monitored: instead of evaluating the metrics of our internal kitchen, we need to go into our pile of cubicles - in the sense of a restaurant - and check for ourselves what is happening there.
How EUE makes SLA better
You set the metrics for those values that in EUE will, in fact, be quite different: how many seconds are needed to complete such a transaction, and so on. If this metric does not correspond to the real situation, you can begin to understand the details of the infrastructure, why it is not so. And again we need to draw a traditional data center in the picture. But at the same time, instead of using the metric 'query execution time' or some other purely technical one, we take the 'user perception' metric and use it to troubleshoot when the user believes that something is wrong with us. Figure 4.2. shows how EUE monitoring turns our model.

Figure 4.2: EUE monitoring.
You still have thresholds and other restrictions, but they are all set at the historically established levels at which the EUE was executed. As shown in fig. 4.3., A non-operational EUE is your starting point, from which you must begin to understand the deeper and more technical levels of measurements that can be established, which is the problem of the end user.

Figure 4.3: Tracking the cause of a bad EUE.
In real life, the emerged EUE problem is not always accompanied by tangible changes in the backend. The response time of the DBMS server is reduced by a millisecond or two, which causes the application server to take an additional half-second to process transactions, which leads to a slowdown for a second of the front-end server displaying the next page of information, and as a result the user application runs two seconds more . Multiply these few seconds by the length of the working day, and you will find that an hour or more is lost, and the user is forced to say to many customers of the company: “Sorry for so long, the computer slows down something today. In fig. 4.3., Marked with red flags, the slow-responding DBMS server and cloud computing service. By separateness, none of them trigger an alarm, but their joint work causes a problem that is noticeable to the end user. Usually a small fluctuation on the DBMS server does not trigger the alarm - a whole cascade of events leads to a bad EUE. One thing we know for sure: if EUE starts to deviate from the expected one, this is a reason to start investigating the causes. Since we are looking for the source of the problem , and not just doing normal monitoring, we will look more closely at minor deviations in the operation of the infrastructure.
Being able to measure EUE allows you to create more realistic SLAs. Instead of telling your users “We guarantee the system’s response to a request within 2 seconds,” you say, “Such a transaction will take no more than 3 seconds to process”. This means that the user can measure these things by himself: “We press the input and count - one, two, three ... oh, it worked out!”. This type of SLA establishes a framework that is relative to the user and is understandable to him. They know when the system began to work slowly, because they measure the same things as you.
Ideally, you will be aware of a decrease in the system’s performance before it is learned by the user, or very close to that, because you have a tool for measuring processes from the point of view of users.
How to do it: Synthetic transactions, transaction tracking, etc.
This type of monitoring is not always simple. Of course, it is not so difficult to place monitoring agents on end-user computers, but what to do with a web application, where end users are actually external clients of your company? They will be completely unhappy with the proposal to install agent monitoring software, and only so that you can measure the performance of your application.
Instead, modern monitoring systems rely on transaction tracking methods. In this case, monitoring components at your end allows you to see how a particular transaction goes through the entire system with an accurate measurement of the time from its inception to its completion. This can be done at various levels of detail. For example, a toolkit that allows software performance profiling can perform very detailed information tracking through individual software modules. At the system management level, which is just above, you can only track the start and end time of a transaction.
Often, this approach to determining the real state of a system can be accomplished by inserting synthetic transactions into it. The monitoring system pretends to be a client, puts transactions into the system, and the result will not make any changes to the data and will be ignored. This allows the monitoring system to understand in more detail the actual execution time of various operations. This approach is illustrated in Figure 4.4.
Figure 4.4: Using transaction tracking to monitor EUE.
There is a large number of variations of these methods, as well as specialized software, with the help of which all this can be implemented. To summarize, I would like to say that we must always remember that all this activity is aimed at measuring only one thing: EUE. From this point of view, you are not trying to understand the state of your system performance, or to find the main source of the problem. You are just trying to understand if there is a problem at all.
Monitoring from top to bottom: from EUE to the root of all evil
EUE is considered an extremely high level diagnostic; she simply says - “something went wrong,” but she doesn’t say specifically. To understand the reasons, you need to return to the traditional monitoring system that you have always known and loved, only this time, you will no longer look in an empty place: you will look for the source of a guaranteed existing problem.
By the way, this is not the moment to uncover special software - we discussed this in previous chapters. You still intend to use a monitoring system that allows you to see everything on “one glass”. However, this does not necessarily mean a certain shell that unites specialized tools, it means a monitoring system that allows you to see each of your systems. If you have a correct understanding of what should be the performance at the level of each component, then such a system can quickly tell you where the problem is. And only now you can get a specialized tool and tackle a particular problem - again, knowing where the problem is and what component you are looking at is really its source.
Where does EUE come from
Why can't you just use a more careful selection of boundary values in your monitoring system, which monitors the state of your backend from which you can understand that EUE deviates from the expected values? The reason is that EUE evaluates the performance of the entire system. The database may run slower, but its behavior does not affect the rest of the infrastructure. A slow-running router does not necessarily lead to a deterioration of the EUE, although in combination with other factors it can be a turning point. That is why you need to look directly at how things are at the end users, and only then look for the root of all evil.
Monitoring using agents vs agentless monitoring
There are many arguments in favor of each of the best ways to monitor. Do you install agents? Some people do this and believe that agents provide the most detailed way to provide information. Others do not believe in the installation of agents and, quite rightly, indicate that not all elements of the environment can in principle be installed agents. Routers or services located outside of your responsibility usually do not give any information to the monitoring software, or support it with restrictions.
In one case, we can install agents, as shown in Figure 4.5.
Figure 4.5: Monitoring by agents.
Usually agents return information to a centralized monitoring system. Depending on the approach chosen, you can put these agents wherever they can in principle be installed, perhaps even on user computers for spot monitoring (although they usually try not to do this)
Some monitoring solutions will allow you to do without installing agents on each system (you may not need to do this everywhere). As shown in Figure 4.6, these solutions typically use external tools to evaluate system performance.
Figure 4.6: Agentless Monitoring.
Whether agentless monitoring can collect a large amount of data, or in general, all data in principle depends largely on the type of components on your network and what technologies are used. This is an important competitive point among many software vendors, and this requires close attention.
The “monitoring provider” in Figure 4.6. is my starting point if we are talking about modern applications. You almost always have to deploy hybrid systems that rely partly on agents, and partly on agentless monitoring, if only because some of the monitoring objects will be outside of your data center.
Monitoring what doesn't belong to you
Equipment located outside our office and / or responsibility is the place where normal monitoring does not work. It is unlikely that Amazon will send you detailed statistics on the performance of their Elastic Compute Cloud (EC2), Microsoft is unlikely to do the same for its Windows Azure. SalesForce.com is not going to send you the response time values of the DBMS or the utilization parameters of the central processors of their web servers. Even the hosting company where you host your servers is not going to show you detailed information about the percentage of lost packets on your routers and other statistics from your infrastructure.
But, generally, these numbers are important to you. If you have an application that depends on cloud computing components, colocation servers, SaaS decisions, or any other outsourcing component, then the performance of these components will affect the performance of your applications and your EUE. In short, if Amazon has performance problems, your users will have the same thing. And this is where hybrid monitoring comes into play. Figure 4.7 shows that it looks like some kind of external monitoring application that collects key performance information from most of the outsourced providers for cloud components. The collected data is shown in red lines, the data that is transmitted to your central monitoring console is green.
A lot of what I listed in previous chapters is starting to form one picture:
- You need your internal systems and external components that are displayed in a single view. There is no way to work with your subsystems as a system if you do not have the ability to assemble all the component parts into a single monitoring space.
- A key competitive feature for hybrid monitoring services is the number of external components that can be monitored. Make sure that the solution you choose is able to monitor everything that you have, including services and equipment that is outsourced.
- Tracking EUE user expectations is important because there can be large fluctuations between external services and your use of them. For example, you absolutely do not need to be aware of whether Azure responds slowly during periods when users do not use this service. You need to pay attention to it, and receive notifications about its state only if your users experience problems while working with it.

Figure 4.7: Hybrid monitoring.
In fact, this way of monitoring external, outsourced components is key, because most organizations feel that they cannot rely on cloud computing. “How will we manage this?”, They ask themselves questions, “How will we monitor it?” In addition to data security, this is perhaps the most serious issue that arises when companies begin to consider adding “clouds” to their portfolio of IT solutions. They can be monitored in this way: using specialized monitoring services that add a “cloud” to your single control screen. Such tools place components outside the company at the same level of control as the local components and allow you to monitor them in a similar way.
An interesting path that some vendors choose when developing an architecture for such solutions. Many of them sell local solutions, which are in many ways similar to what is shown in Fig. 4.7. In fact, they monitor the cloud components on the provider side, but at the same time send this information to you; then their solution collects data from your local equipment and presents the information in a consolidated form.
But this is not the only way. In fig. 4.8. shows a diagram of a remote (hosted) monitoring solution in which your internal performance information is sent to the cloud (shown by blue lines), then the cloud is combined with information about the performance of your cloud components (red lines) and displayed in a single view on the web. portal or some other way.

Figure 4.8: External, hybrid monitoring.
This is a rather interesting model that removes most of your responsibility for monitoring, which allows you to concentrate on the services provided to users. But one should not think that it will be the right model for any organization, although, as an option, it should be considered.
Critical Limits: When you need to control everything
The last important element of the puzzle is to make sure that you monitor everything. All-all-all !!! See Figure 4.9, with the infrastructure we used throughout this chapter. Is there anything missing on it? If we track each of the components shown, will monitoring be sufficient?
Figure 4.9: Is everything here that needs to be controlled?
Definitely not. In this scheme there are many gaps and for the most part these are things that can have a significant impact on performance. Look at fig.4.10 - everything here is a little bit fuller and more detailed.
Figure 4.10: Make sure you control everything.
Routers, switches, firewalls, directory service servers, DNS - external and internal, and perhaps much more. If your EUE starts to deviate from the usual values, then navrenoe, you already have to look for the root of evil; but you can only do this if your monitoring solution can see any potential source of the problem.
It is for this reason that most monitoring solutions nowadays offer an autodiscovery function, and besides, there is always the possibility to add components yourself. Autodiscovery can catch the missing items, about which no one even imagined that they are also part of the overall system. Infrastructure elements such as marshurtizators and switches. Dependencies between directory services and DNS. Potential bottlenecks such as firewalls and proxy servers. This is all important for normal operation, and it is necessary that everything be assembled into a single picture, through which the overall state of the system will be monitored.
Conclusion
Monitoring is a solution that allows us to manage the SLA, helps to find out the place where the problem originates, and helps us keep the systems in a state suitable for the business to perform their tasks. But traditional monitoring does not always mean the only or best way to meet the needs of the business. More importantly, as businesses increasingly depend on components outside their local systems, traditional monitoring cannot gather all the necessary information into a single space. But these tasks are within the power of hybrid monitoring systems. Using a combination of traditional monitoring techniques, obtaining performance data from cloud systems, as well as other methods, we can collect information about the health of systems into a single view, a common panel of indicators and a complete picture.
In the next chapter ...
In the next chapter, we turn to the fundamental problem that every organization has to contend with: repeatability . In other words, after the problem is solved, how can you be able to solve it faster if it happens again? We will look at how to turn problems into solutions and how we can improve the provision of services in the future.
Source: https://habr.com/ru/post/174493/
All Articles