Github Visualizer - A service to visualize the history of repositories with GitHub
Being a fan of software products for visualizing repository activities such as code_swarm and gource . One day I was visited by a muse who inspired me to create an online service for visualizing statistics of repositories with GitHub .
And today I want to submit to your court my GitHub Visualizer project (a project on GitHub ).
Here is a screencast for pre-dating.
And not a big Gif'ka
In this project, there are three main visualizations that show information about repositories, their history and quantitative indicators.
Repository graph
After you upload information about the list of user repositories, you can select the repository you are interested in either in the graph or in the list of repositories in the panel of the second stage (here you can also set the number of recent revisions for analysis).
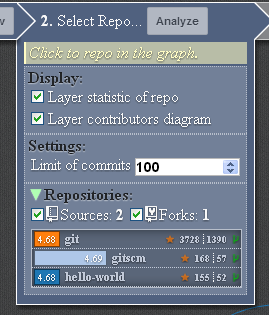
Then analyze it by pressing the “Analyze” button. The analysis of the repository history will be built during the analysis. Which displays information on the number of recent commits you specify (by default, 100 commits. It may be less than how many are in the repository).
History chart
For this all was the whole idea. I like what happens when rendering with the use of code_swarm , but every time it is not convenient to clone the repository to my computer and then visualize it.
In this visualization, I tried to embody all the ideas that are used in code_swarm and make changes to the settings on the fly.
Visualize the song-of-github , Link to launch , Article about the Song-of-github on habrabra
I get the data from api.github.com .
Data acquisition occurs by the JSONP method.
According to the GitHub API,
This is what I’m all about ... And besides, the restriction for this method of authorization is 5000 requests per hour, some repositories like mc have a rich history. And if you walk along it well, then the limit is quickly exhausted, what the system will tell you. If this happens, you can specify in the System settings menu with the right
GitHub has very good APIs, it’s enough to execute only one request, for example, requesting user information
In general, I express my gratitude to the API developers and those who wrote documentation on it, it is a pleasure to work with them.
I also thank D3js developers for a rich collection of examples (without which I probably wouldn’t have been inspired by this) and very complete documentation with all the explanations.
At the very beginning when I began to make a project it was a toy for myself, in fact, it remained so. If you forknite my repository and find a bunch of errors or screw something new, then please leave Pull Request or write to Issues .
When developing the application, it was checked only in Google Chrome dev-m (no, of course, I’ve seen obvious jambs that were fixed in other browsers), if you know how to make it work correctly in your favorite browser I will be infinitely grateful.
Waiting for healthy criticism.
Thank you for attention!
PS
Some interesting repositories are:
And today I want to submit to your court my GitHub Visualizer project (a project on GitHub ).
Here is a screencast for pre-dating.
And not a big Gif'ka
What is used
- SVG , Canvas - for interactive graphics.
- D3.js - javascript library makes it very convenient to work with data and visualize it.
Giant collection of examples from the author of the library Mike Bostock . - GitHub API
Description of graphs and their implementation
In this project, there are three main visualizations that show information about repositories, their history and quantitative indicators.
Repository list visualization
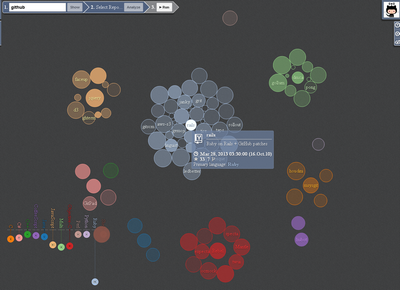
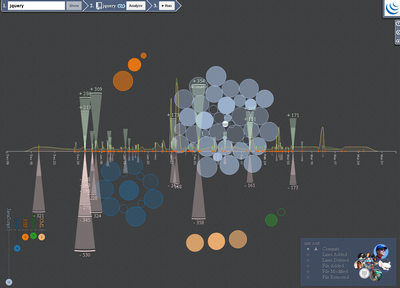
Repository graph
- Circles (vertices) are repositories.
- The size of the vertex depends on the age of the repository, the older, the smaller.
- Opacity depends on last modified date.
- The color and grouping of vertices depends on the primary repository language.

- Language histogram
- Shows summary information for each language.
- Displays language color
- Allows filtering vertices on hover.
To build the graph, we used D3.Layout.Force and the clustering method proposed in this example .A piece of code from the examplevar force = d3.layout.force() .nodes(nodes) .size([width, height]) .gravity(.02) .charge(0) .on("tick", tick) .start(); function tick(e) { circle .each(cluster(10 * e.alpha * e.alpha)) .each(collide(.5)) .attr("cx", function(d) { return dx; }) .attr("cy", function(d) { return dy; }); } // Move d to be adjacent to the cluster node. function cluster(alpha) { var max = {}; // Find the largest node for each cluster. nodes.forEach(function(d) { if (!(d.color in max) || (d.radius > max[d.color].radius)) { max[d.color] = d; } }); return function(d) { var node = max[d.color], l, r, x, y, i = -1; if (node == d) return; x = dx - node.x; y = dy - node.y; l = Math.sqrt(x * x + y * y); r = d.radius + node.radius; if (l != r) { l = (l - r) / l * alpha; dx -= x *= l; dy -= y *= l; node.x += x; node.y += y; } }; } // Resolves collisions between d and all other circles. function collide(alpha) { var quadtree = d3.geom.quadtree(nodes); return function(d) { var r = d.radius + radius.domain()[1] + padding, nx1 = dx - r, nx2 = dx + r, ny1 = dy - r, ny2 = dy + r; quadtree.visit(function(quad, x1, y1, x2, y2) { if (quad.point && (quad.point !== d)) { var x = dx - quad.point.x, y = dy - quad.point.y, l = Math.sqrt(x * x + y * y), r = d.radius + quad.point.radius + (d.color !== quad.point.color) * padding; if (l < r) { l = (l - r) / l * alpha; dx -= x *= l; dy -= y *= l; quad.point.x += x; quad.point.y += y; } } return x1 > nx2 || x2 < nx1 || y1 > ny2 || y2 < ny1; }); }; }
')Actually, this was the muse that visited me.
Functions are taken practically without change, with some exceptions and additions.
The implementation of the functionality for visualizing the list of repositories is in two files repo.js and langHg.js
Repository history visualization
After you upload information about the list of user repositories, you can select the repository you are interested in either in the graph or in the list of repositories in the panel of the second stage (here you can also set the number of recent revisions for analysis).
Then analyze it by pressing the “Analyze” button. The analysis of the repository history will be built during the analysis. Which displays information on the number of recent commits you specify (by default, 100 commits. It may be less than how many are in the repository).
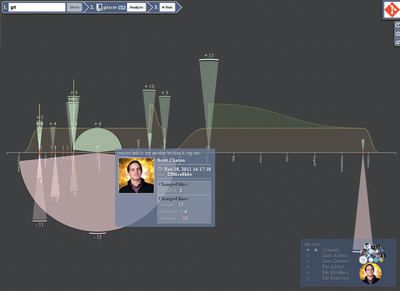
History chart
- X axis shows fixation dates.
- Each red dot represents a fix.
- The up and down arcs are the number of added and deleted lines in a commit.
- The areas in the background show the number of files being modified.
- Added files
- Modified Files
- Deleted files
- Member Chart - Shows member activity by various parameters.

In order to draw diagrams, I used a number of tools and their combination from the d3.js library.
The area calculation is performed by the d3.svg.area () component (example Stacked Area ). I consider the stack myself, but everything else is trivial for d3js.A piece of code where the stack countsvar layers = [ { color: colors.deletedFile, values: sorted.map(function (d) { return {t : 1, x: d.date, y0 : 0, y: (d.stats ? -d.stats.fd : 0)} }) }, { color: colors.modifiedFile, values: sorted.map(function (d) { return {x: d.date, y0 : 0, y: (d.stats ? d.stats.fm : 0)} }) }, { color: colors.addedFile, values: sorted.map(function (d) { return {x: d.date, y0: (d.stats ? d.stats.fm : 0), y : (d.stats ? d.stats.fa : 0)} }) } ] ; function interpolateSankey(points) { var x0 = points[0][0], y0 = points[0][1], x1, y1, x2, path = [x0, ",", y0], i = 0, n = points.length; while (++i < n) { x1 = points[i][0]; y1 = points[i][1]; x2 = (x0 + x1) / 2; path.push("C", x2, ",", y0, " ", x2, ",", y1, " ", x1, ",", y1); x0 = x1; y0 = y1; } return path.join(""); } var y1 = d3.scale.linear() .range([h6 * 4.5, h6 * 3, h6 * 1.5]) .domain([-data.stats.files, 0, data.stats.files]), area = d3.svg.area() .interpolate(interpolateSankey /*"linear" "basis"*/) .x(function(d) { return x(dx); }) .y0(function(d) { return y1(d.y0); }) .y1(function(d) { return y1(d.y0 + dy); }) ;
To build arcs I use d3.svg.arc () (there are many examples where this component is used: Arc Tween , Pie Multiples ).
I generate the X scale using the two components d3.time.scale () and d3.svg.axis . The implementation is taken from this Custom Time Format example.
The participant diagram is calculated by d3.layout.pack () (example of Circle Packing ). In order to sort and change the size of the circles, I change the properties of sort and value .
The code for this visualization is located in two files stat.js and usercommit.js
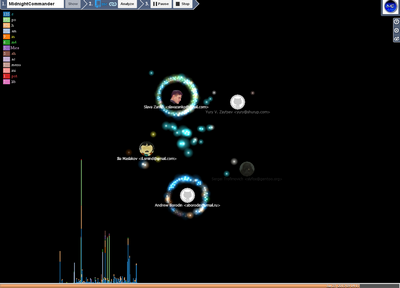
Dynamic visualization
For this all was the whole idea. I like what happens when rendering with the use of code_swarm , but every time it is not convenient to clone the repository to my computer and then visualize it.
In this visualization, I tried to embody all the ideas that are used in code_swarm and make changes to the settings on the fly.
Visualize the song-of-github , Link to launch , Article about the Song-of-github on habrabra
- Each particle is a file. They move from developer to developer.
- The particle size depends on the degree of its change, the more often it is changed so that it is larger.
- The color of the particle depends on its expansion.
- Over time, the particle disappears, as soon as all the particles disappear from the user, the user also melts. (This can be regulated by the corresponding settings in the panel 3 stage, User Life and File Life , the value 0 is immortal).
- Each participant collects around himself the files with which he performed the manipulations.
- If the files leave the user's orbit and no longer flies to anyone, then it is deleted.
- Every second is a day (plans to add the ability to change the step)
- The histogram shows the number of files involved in the commit, divided by extensions
- Legend shows the number of existing files at the moment for each extension.
Physics calculation is performed by the notorious D3.Layout.Force , but with a small omission there are two of them. One calculates the positions of users, the other considers the position of the files depending on the position of the user. How is this done? Each file has anauthorproperty, it writes the current at the moment (commit time) user if this file is in the current commit. The above mentioned clustering method gets it and considers the position of the given file in space.Clustering functionfunction tick() { if (_force.nodes()) { _force.nodes() .forEach(cluster(0.025)); _forceAuthor.nodes( _forceAuthor.nodes() .filter(function(d) { blink(d, !d.links && setting.userLife > 0); if (d.visible && d.links === 0 && setting.userLife > 0) { d.flash = 0; d.alive = d.alive / 10; } return d.visible; }) ); } _forceAuthor.resume(); _force.resume(); } // Move d to be adjacent to the cluster node. function cluster(alpha) { authorHash.forEach(function(k, d) { d.links = 0; }); return function(d) { blink(d, setting.fileLife > 0); if (!d.author || !d.visible) return; var node = d.author, l, r, x, y; if (node == d) return; node.links++; x = dx - node.x; y = dy - node.y; l = Math.sqrt(x * x + y * y); r = radius(nr(d)) / 2 + (nr(node) + setting.padding); if (l != r) { l = (l - r) / (l || 1) * (alpha || 1); x *= l; y *= l; dx -= x; dy -= y; } }; }
And the place of initialization force layouts_force = (_force || d3.layout.force() .stop() .size([w, h]) .friction(.75) .gravity(0) .charge(function(d) {return -1 * radius(nr(d)); } ) .on("tick", tick)) .nodes([]) ; ..... _forceAuthor = (_forceAuthor || d3.layout.force() .stop() .size([w, h]) .gravity(setting.padding * .001) .charge(function(d) { return -(setting.padding + d.size) * 8; })) .nodes([]) ;
Two threads (if you can say so) are working; one issetIntervalother is therequestAnimationFrame. The first is responsible for moving in time, the second for drawing. But in fact, force also has its own timers and asyncForEach (needed so that there is a good response from the system and the files from one commit did not fly out all at once, but with a slight delay) also starts setTimeouts.
The code can be viewed in the show.js file.
Data acquisition
I get the data from api.github.com .
Data acquisition occurs by the JSONP method.
According to the GitHub API,
Client_id and Client_Secret , but then the request limit will be 60 for one ip per hour. That's why I created the application in the profile settings on GitHub and the required authorization information is added to the request.This is what I’m all about ... And besides, the restriction for this method of authorization is 5000 requests per hour, some repositories like mc have a rich history. And if you walk along it well, then the limit is quickly exhausted, what the system will tell you. If this happens, you can specify in the System settings menu with the right
client_id and client_secret your application (having previously created it if it is not already there).GitHub has very good APIs, it’s enough to execute only one request, for example, requesting user information
api.github.com/users{user} api.github.com/users{user} all other links will be answered. And if this is a lot of page request (let's say getting a list of repositories, the answer is only information on 10 repositories) then in the response object in the meta parameter there is a link to the next page with a full set of authorization parameters.In general, I express my gratitude to the API developers and those who wrote documentation on it, it is a pleasure to work with them.
I also thank D3js developers for a rich collection of examples (without which I probably wouldn’t have been inspired by this) and very complete documentation with all the explanations.
Conclusion
At the very beginning when I began to make a project it was a toy for myself, in fact, it remained so. If you forknite my repository and find a bunch of errors or screw something new, then please leave Pull Request or write to Issues .
When developing the application, it was checked only in Google Chrome dev-m (no, of course, I’ve seen obvious jambs that were fixed in other browsers), if you know how to make it work correctly in your favorite browser I will be infinitely grateful.
Waiting for healthy criticism.
Thank you for attention!
PS
Some interesting repositories are:
- Nothing interesting project repository
- D3js ( launch visualization )

- jQuery ( start visualization )
- MidnightCommander ( start visualization )
Source: https://habr.com/ru/post/174375/
All Articles