Tuning JVM on the example of one project
In this article I want to talk about the experience gained in optimizing applications from memory using standard JVM optimization mechanisms such as various types of links, garbage collection strategies, a set of keys affecting garbage collection. I am sure that each of you had to juggle with parameters to improve performance and you will not find any black magic or a recipe for lack of memory in the article, I just want to share my experience.
It all started fine and cloudless. For the needs of one large bank, it was necessary to implement a calculator that calculates the Value-at-Risk value for a specific investment portfolio. Like most financial applications, the methodology does not imply "heavy" calculations, but the data flow is sometimes truly huge.
The problems of processing large amounts of data are usually solved by two known types of scaling: vertical and horizontal. With the vertical everything was quite acceptable. We had a machine about 16 cores, with 16 GB of RAM, Red Hat and Java 1.6. On such a gland it was possible to unfold well enough, which, in fact, we successfully did for several months.
Everything was fine until the customer did not knock on us and did not say that the IT infrastructure was revised and instead of 16x16 we have 4x1-2:

Naturally, the requirement of application running time was increased several times, but. To convey our emotions at that time was difficult enough, but the speech, suddenly, became strongly flavored with various allegories, allusions and comparisons.
')
First, I’ll explain what the Value-at-Risk calculator is. This is a program with a large number of “simple” calculations that allows a large amount of data to pass through.
Optimization keys that were most helpful:
Naturally, such a simple technique did not give the desired results, and we continued to dig in the direction of further possibilities of “tapping” the application. The first thing that was decided to do was remove unnecessary caches and optimize existing ones (those that give a 20% performance increase of 80%). Unnecessary ones were quickly removed, and to work on the remaining ones, we decided to look at the different types of links in Java.
So, we have the following types of links:
The dependencies between them look like this:
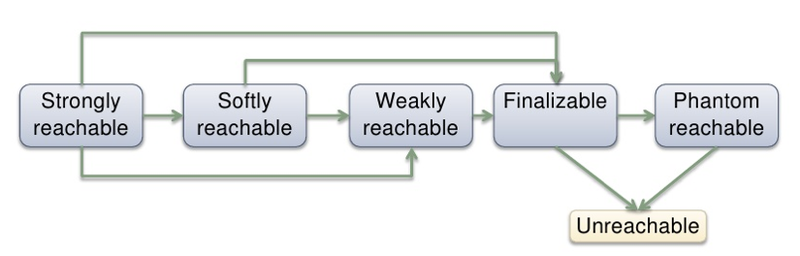
Let's see what the specification guarantees for working with these types of links.
Hard / Strong links are the most common links that are created when we use the keyword "new". Such a link will be deleted when the number of links to the created object reaches zero. Soft links (Soft) can be removed in case the virtual machine does not have enough memory for further work. Weak links can be collected at any time, if GC so decides. Phantom link (Phantom) is a special type of link that is required for more flexible object fi nalization than the classic finalize.
Hard and Phantom links were immediately removed from our consideration due to the fact that they do not provide the required functionality and flexibility. Hard is not deleted at the right time, but everything was in order with the fainalization.
Consider, for example, how Weak links are collected:
We see that we have no guarantee that the object will be available all the time and can be deleted at an arbitrary point in time. Because of this specificity, it was decided to rebuild the internal, most "heavy" caches on the Soft links. We were driven by something like the following statement: “Let the object live in the cache as long as possible, but if there is a shortage of memory, we will be able to calculate it again, due to the fact that the time requirements have been increased.”
The results were significant, but the work of the application in the coveted 4GB did not bring.
Further studies were carried out using various profiling tools:
Data collection took not much time, as opposed to analysis. After spending several wonderful days observing numbers and letters, the following conclusions were made: many objects are being created and the old generation is very overloaded. In order to solve this problem, we began to look in the direction of various garbage collectors and methods of working with them.
First, it was necessary to reduce the number of objects generated. It was noted that most of the data have a similar structure: "XXX1: XXX2: XXX3, etc.". All patterns like “XXX” were replaced with links to objects from the pool, which resulted in a significant reduction in the number of objects created (about five times), and also freed up additional amount of precious memory.
Secondly, we decided to work in more detail with garbage collection strategies. As we know, we have the following garbage collection strategies:
G1 was not available to us due to the fact that the sixth version of Java was used. Serial and Parallel are not much different and did not perform well on our task. Parallel compacting was and is interesting due to the phase, allowing to reduce data defragmentation. Concurrent Mark-Sweep was interesting due to the fact that it allowed to reduce the time for the phase of the stop-the-world and also did not allow strong fragmentation.
After comparing Parallel compacting and Concurrent Mark-Sweep collectors, it was decided to stop at the second, which turned out to be a good solution.
After the combat test of all the above techniques, the application was fully compatible with the new requirements and successfully launched in production! Everyone sighed with relief!
A more detailed version of the problem and the stages of the solution can be heard at the upcoming JPoint conference, which will be held in St. Petersburg.

Project history
It all started fine and cloudless. For the needs of one large bank, it was necessary to implement a calculator that calculates the Value-at-Risk value for a specific investment portfolio. Like most financial applications, the methodology does not imply "heavy" calculations, but the data flow is sometimes truly huge.
The problems of processing large amounts of data are usually solved by two known types of scaling: vertical and horizontal. With the vertical everything was quite acceptable. We had a machine about 16 cores, with 16 GB of RAM, Red Hat and Java 1.6. On such a gland it was possible to unfold well enough, which, in fact, we successfully did for several months.
Everything was fine until the customer did not knock on us and did not say that the IT infrastructure was revised and instead of 16x16 we have 4x1-2:
Naturally, the requirement of application running time was increased several times, but. To convey our emotions at that time was difficult enough, but the speech, suddenly, became strongly flavored with various allegories, allusions and comparisons.
')
First attempts
First, I’ll explain what the Value-at-Risk calculator is. This is a program with a large number of “simple” calculations that allows a large amount of data to pass through.
Optimization keys that were most helpful:
- -server is an extremely useful key, JVM expands cycles, inline many functions, etc.
- Working with strings: -XX: + UseCompressedStrings, -XX: + UseStringCache, -XX: + OptimizeStringConcat
Naturally, such a simple technique did not give the desired results, and we continued to dig in the direction of further possibilities of “tapping” the application. The first thing that was decided to do was remove unnecessary caches and optimize existing ones (those that give a 20% performance increase of 80%). Unnecessary ones were quickly removed, and to work on the remaining ones, we decided to look at the different types of links in Java.
So, we have the following types of links:
- Hard / Strong
- Soft
- Weak
- Phantom
The dependencies between them look like this:
Let's see what the specification guarantees for working with these types of links.
Hard / Strong links are the most common links that are created when we use the keyword "new". Such a link will be deleted when the number of links to the created object reaches zero. Soft links (Soft) can be removed in case the virtual machine does not have enough memory for further work. Weak links can be collected at any time, if GC so decides. Phantom link (Phantom) is a special type of link that is required for more flexible object fi nalization than the classic finalize.
Hard and Phantom links were immediately removed from our consideration due to the fact that they do not provide the required functionality and flexibility. Hard is not deleted at the right time, but everything was in order with the fainalization.
Consider, for example, how Weak links are collected:
We see that we have no guarantee that the object will be available all the time and can be deleted at an arbitrary point in time. Because of this specificity, it was decided to rebuild the internal, most "heavy" caches on the Soft links. We were driven by something like the following statement: “Let the object live in the cache as long as possible, but if there is a shortage of memory, we will be able to calculate it again, due to the fact that the time requirements have been increased.”
The results were significant, but the work of the application in the coveted 4GB did not bring.
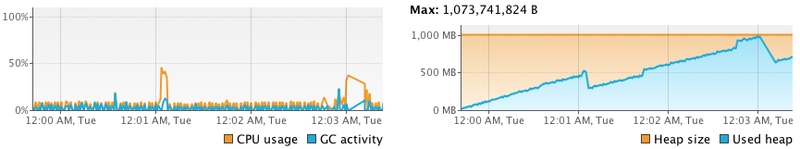
Detailed study
Further studies were carried out using various profiling tools:
- Standard JVM Tools: -XX: + PrintGCDetails, -XX: + PrintGC, -XX: PrintReferenceGC, etc
- MXBean
- Visualvm
Data collection took not much time, as opposed to analysis. After spending several wonderful days observing numbers and letters, the following conclusions were made: many objects are being created and the old generation is very overloaded. In order to solve this problem, we began to look in the direction of various garbage collectors and methods of working with them.
First, it was necessary to reduce the number of objects generated. It was noted that most of the data have a similar structure: "XXX1: XXX2: XXX3, etc.". All patterns like “XXX” were replaced with links to objects from the pool, which resulted in a significant reduction in the number of objects created (about five times), and also freed up additional amount of precious memory.
Secondly, we decided to work in more detail with garbage collection strategies. As we know, we have the following garbage collection strategies:
- Serial
- Parallel
- Parallel compacting
- Concurrent mark-sweep
- G1 collector
G1 was not available to us due to the fact that the sixth version of Java was used. Serial and Parallel are not much different and did not perform well on our task. Parallel compacting was and is interesting due to the phase, allowing to reduce data defragmentation. Concurrent Mark-Sweep was interesting due to the fact that it allowed to reduce the time for the phase of the stop-the-world and also did not allow strong fragmentation.
After comparing Parallel compacting and Concurrent Mark-Sweep collectors, it was decided to stop at the second, which turned out to be a good solution.
After the combat test of all the above techniques, the application was fully compatible with the new requirements and successfully launched in production! Everyone sighed with relief!
Lesson learned
- The keys for working with strings helped: -XX: + UseCompressedStrings, -XX: + UseStringCache, -XX: + OptimizeStringConcat and the very specifics of string data
- Reducing the number of objects used
- Tweaking a JVM is time consuming, but the results are more than justified.
- Get to know your requirements as soon as possible! :)
A more detailed version of the problem and the stages of the solution can be heard at the upcoming JPoint conference, which will be held in St. Petersburg.
Source: https://habr.com/ru/post/174231/
All Articles