Don Jones "Creating a unified IT monitoring system in your environment." Chapter 2. Elimination of management practices for individual sites in IT management
 We continue to translate the book about the unified system of IT monitoring. After intrigue with questions, the author begins to answer them gradually.
I remind you that this book does not contain ready-made recipes, references to certain software and detailed implementation techniques (there are a large number of books on specific monitoring systems for this), the material presented here is rather a set of techniques that you can use or alternatively continue anything not to do.
So, Chapter 2. On what to do so that the information was not scattered. For those who already use monitoring systems, many things will seem familiar.
Content
')
Chapter 1. Managing your IT environment: four things you do wrong
Chapter 2. Elimination of management practices for individual sites in IT management
Chapter 3. We combine everything into a single IT management cycle
Chapter 4. Monitoring: a look beyond the data center
Chapter 5: Turning Problems into Solutions
Chapter 6: Unified Case Management
Chapter 2. Elimination of management practices for individual sites in IT management
In the previous chapter, I expressed the opinion that one of the biggest problems in modern IT is our way of managing IT across technologically isolated domains: database administrators are responsible for database servers, Windows administrators are responsible for their machines, VMware administrators are responsible for virtualization infrastructure and so Further. In fact, I do not propose to take and abolish the existing practice of having narrow specialists in the IT team - this is, in fact, a serious benefit. However, if each of these experts uses their own specialized tool, then this creates certain difficulties. In this chapter, we will explore some of these problems, and see what we can do to solve them and how to create a more efficient, unified IT environment.
Too many tools means too few solutions.
“Comparing warm with mild” is a saying that comes to mind when it comes to our ways of measuring performance, resolving issues, and working with other major IT processes. Tell the Exchange Server administrator that our mail system is slowing down, and, most likely, it will start Windows Performance Monitor, most likely with a pre-created set of counters, which include disk bandwidth, processor utilization, the number of RPC requests, and so on. Further, approximately as it looks
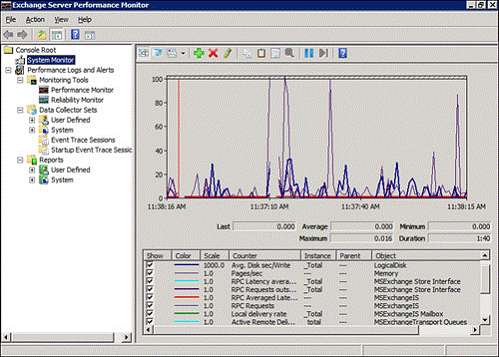
Figure 2.1: Exchange Server Monitoring.
If the Exchange administrator finds nothing on his server, he will pass the problem on to someone else. Perhaps this will be the Active Directory administrator, because the Microsoft directory service plays a very important role in the performance and health of the Exchange server. The Active Directory administrator runs his favorite performance utility, most likely it will look exactly like in Figure 2.2. This is a very specialized tool, with special screens and measuring instruments, which are tied
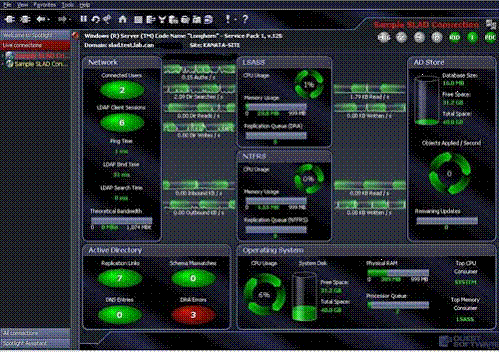
Figure 2.2: Monitoring Active Directory Status.
If everything is in order with the directory service, then the problem should be referred to the network infrastructure specialist. It will get another tool that can look like enterprise router management software, with performance evaluation screens. See Figure 2.3.
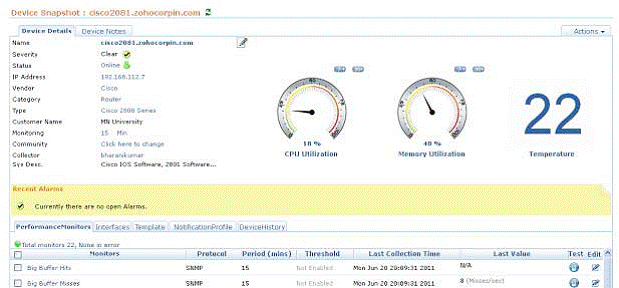
Figure 2.3: Monitoring the performance of the Cisco router.
To summarize, all the tools led experts to the same conclusion - everything works fine. And this is despite the fact that Exchange, from the user's point of view, definitely works ' not great', but at the same time, experts did not find any evidence that would indicate a problem. Simply put, this is exactly the case “when there are a lot of tools and few answers”. In today's complex IT systems, performance — along with other characteristics, such as availability and scalability — is the result of the interaction of many components with each other. You will not be able to fully manage IT, watching the work of a single subsystem; you need to consider the work of complexes of interacting and interdependent elements.
Our reliance on specialized tools does not give full answers to existing IT issues. This dependence begins to tie hands when it comes time to expand our system, manage service level agreements (SLAs) and solve other basic tasks. I actually saw situations where such a specialized tool worked like horse blinkers: significantly narrowing the field of view, and not letting the expert solve the problem, or identify it as quickly as possible.
Heather is the database administrator in his organization. She is responsible for the entire DBMS server, including the DBMS software, the operating system and the hardware on which it all works. One day, she gets a ticket in which users complained about a sharp decrease in the performance of an application using its DBMS. She launched her monitoring tools, but did not see the problem. The processor on the server is for the most part completely unloaded, the exchange with the disk is normal, and the memory consumption is also in order. But she noticed that the workload, which is usually on the server, is lower than usual. This raised her suspicion that the problems were somewhere on the network side, so she transferred the ticket to the infrastructure team. Specialists quickly returned the ticket back, assuring it that although there are some small gags on the network, they are all caused by traffic coming from its server.
Heather checked everything again and saw that the network interface on the server is quietly working peacefully, but with traffic a little more than usual. Having started a thorough check, she finally realized that the server was registering too many checksum errors (CRC), and because of this, she had to resend too many packets. And customers see this problem as a general system slowdown, because normal packages need more time to get to their computers.
Due to the fact that Heather checked, first of all, those things that she knew well herself, this made her “stretch the problem over the wall” and transfer it to the network engineers, losing time. She did not have the habit of controlling the operation of the network interface of the server, and the procedures for evaluating its operability were not included in the routine procedure of standard checks when troubleshooting DBMS problems.
Specialized tool does not promote collaboration
If the components of our complex IT systems are interdependent and tightly coupled, our IT specialists often look whatever you like, just not as professionals. In other words, this way of managing IT provokes the creation of separate technological domains. A DB Administrators group, an Active Directory Administrators group, a network infrastructure group, and so on appear. Even companies that practice “matrix management”, in which narrow specialists are distributed across broad functional groups, still admit the presence of narrow technological sectors. There are two main reasons why such places exist and practically every IT professional can describe them to you:
- "I don't know anything about that ." Each specialist is an expert in his field of technology. The DBA does not understand anything in monitoring or managing routers, and does not particularly want to work with them in principle. Extensive cross-specialization in most organizations has little effect, because the staff do not have enough time for this. The redistribution of time for training in the disciplines of the second and third specialty inevitably leads to a decrease in the time required for the performance of duties on the main work.
- "I do not want anyone to interfere in what I do." IT professionals want to do their job well, and understand the fact that most problems arise as a result of changes and react very painfully to this. Allow someone to climb uncontrollably anywhere, and you are guaranteed to get problems. If someone changes something in your part of the IT environment and you don’t know anything about it, then hard times are waiting for you to eliminate the problems associated with extraneous interference.
Both of these arguments are serious enough, and I absolutely do not advocate that each specialist in the IT team become an expert in each of the technologies used in the organization. However, a number of points, which are reflected in these two statements, require small clarifications. One reason (I again return to the specialized toolkit) is that the tools used in technologically independent areas provoke the building of communication barriers and do nothing even for superficial cooperation between IT specialists. Collaboration, if any, arises from good human relationships, but even these relationships often conflict with the fact that each specialist looks at his or her own separate set of data and “plays from another sheet of music,” so to speak. I have been to companies where administrators spent hours arguing about whose “failure” it was; where each nodded at the other, showing, as proof, data from their own technology sites, taken with their own specialized tools.
Dan works as an Active Directory administrator for his company and is responsible for about a couple of dozen domain controllers, each of which runs on a virtual machine. Peg is responsible for organizing the infrastructure of virtual servers, as well as managing the physical hosts that run virtual machines.
One afternoon, Peg got a call from Dan. Dan tried to deal with the problem of poor performance on some domain controllers and suggested that something was devouring the resources needed by its controllers on a physical virtualization host.
Peg opens the virtual server console and assures Dan that the servers have not exhausted the resources of the physical CPU or memory, and the exchange with the disk is quite normal and is also within the limits of the assigned values.
Dan objects, referring to the values from his Active Directory monitoring utility, which shows the maximum CPU and memory utilization values, and also mentions the lengthening of disk queues, which means that the data is read and written to disks with a delay. Peg insists that the physical servers are fine. Dan asks if anyone could change the settings of the virtual servers, so they were allocated less resources, but Peg says no.
Two administrators go in for football for a few hours, both look at their own screens, on which completely different things are written. They are not able to speak a common technological language, and they cannot work together to solve a problem.
In fact, we do not need every IT specialist to be an expert in any technology — this is not very realistic; but we need to simplify the process of their interaction with each other in issues such as performance, performance, scalability, availability, and so on. If one uses a non-intersecting toolkit, which is individual for each technological domain, then this will be a difficult task. The network administrator does not need the tools to monitor the database servers at all, and the DBA is not particularly eager for the person who manages the network hardware to have access to his working tools.
The presence of specialized software, which is related to another technical specialization, results in precisely those two difficulties that I mentioned earlier.
In the end, the problem can be solved if we have a unified set of tools in which all the information on performance, with which different specialists work, is collected on one screen. In this case, everyone will play by the same rules, and look at the same data, reflecting the overall picture of the environment, full of internal dependencies. Everyone will be able to see where the problem is located, and ONLY AFTER THIS, they can get their favorite special tools and start fixing the problem in their subject areas, if there is such a need.
Cloud question. Unification of local and remote monitoring
The concept of a unified monitoring console becomes even more important as organizations begin to move more and more of their IT infrastructure to the cloud.
There is nothing new in the cloud
I must admit that I am not a big fan of the term "cloud". It smells marketing and advertising for a mile, and in fact there is nothing supernaturally new about it. Organizations have outsourced some of their IT elements for years. Perhaps the most frequently used service for this was web hosting; either it was the removal of single websites deployed on someone else’s equipment outside the company, or the collocation of their servers in a third-party data center.
We agree that in our discussion, the concept of "cloud" will simply refer to some element of IT that is outsourced and hides its underlying infrastructure. For example, if you collocate your servers in the data center of a company providing hosting services, you usually do not have detailed information about the internal structure of their network, methods of connecting to the Internet, types of routers, and so on, the data center, in this case, provides you abstract something for which you pay money. In the modern cloud computing model, which is provided, for example, by Windows Azure or Amazon Elastic Cloud, you have no idea what physical hosts your virtual machines are running on. You pay money for the abstraction of the physical layer, as well as for related elements such as data storage, network communications, etc. When using the Software as a Service (SaaS) service, you will not even know which virtual machines are involved in the operation of the software you have ordered, because you pay for abstracting all the underlying infrastructure.
Regardless of how many subsystems of your infrastructure, large or small, have passed into the hands of a cloud service provider, these components are still part of your business . You still have critical business applications and processes that depend on their normal operation. You have less control over the remote infrastructure, and less opportunity to understand what is happening inside there at a specific point in time.
In this case, specialized tools become completely unsuitable. Undoubtedly, part of the general idea of outsourcing is precisely to worry less about the work of the tasks that other people are involved in, but the IT systems that have been moved outside the company are still involved in supporting the business for which you are personally responsible . So, at a minimum, you need to see how the work of the elements brought into the cloud affects the rest of your environment. And besides, you need the ability to authoritatively "poke a finger" at a specific source of the problem - even if it is an outsourced element, and you do not have the opportunity to directly influence the elimination of failures. It is here that unified monitoring takes its right place in the IT environment. For example, on ris.2.4. A very simple “unified monitoring dashboard” is shown that shows the general state of some infrastructure components, including some components that are outsourced - for example, Amazon Web Services.
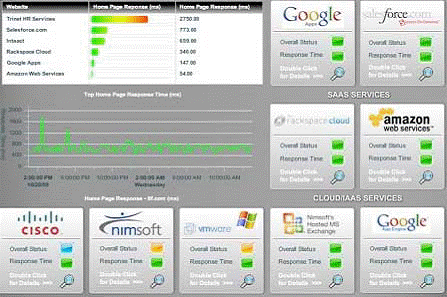
Figure 2.4: A set of indicators for unified monitoring.
The idea of the indicator panel is to quickly determine, by sight, where the performance problems begin, then, if necessary, quickly get to the details, and either begin to correct the problem, if it is at your end of the cloud, or escalate the problem to who is responsible for it.
Let one thought be completely understandable: Any organization that outsources any part of its IT environment that influences a business should prepare for big trouble when sooner or later something goes wrong in the cloud. Yes, of course, you have Service Level Agreements (SLAs) with your cloud partners, but read these SLAs carefully - as a rule, they describe that they will refund your payment if the SLA conditions are not met, and nothing - The case concerns compensation for damage to a business provoked by the failure of the SLA. So maximum control over the rendered infrastructure is completely in your interests.
And if you have already built such a system, then as soon as it turns out that things are going to go bad, you can immediately contact your outsourcing partner and get someone to start solving the problem. Thus, the negative impact on your business will be at least minimized.
Missing plots
There is another problem that occurs when it comes to performance monitoring, management procedures, scalability planning, and so on, and it is called “missing sites”. Our IT approach, focused exclusively on technology, leads to a very short-sighted look at our environment. For example, let's look at the scheme in Fig.2.5. This is a typical (if not simplified) scheme that each IT administrator draws when he needs to see the structure of the components of a particular application.
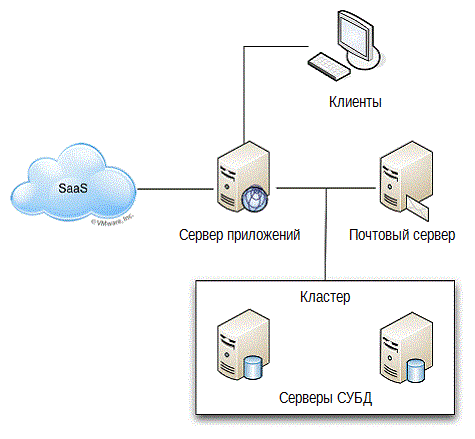
Figure 2.5: Application structure.
The problem is that there are obviously missing areas in this picture. Where is the infrastructure, for example? The one who drew this picture did not seem to deal with the infrastructure: switches, routers, etc. — none of this is included. The implication is that it exists, just like some components brought into the cloud. Perhaps Figure 2.6 will be a more accurate representation of our environment.
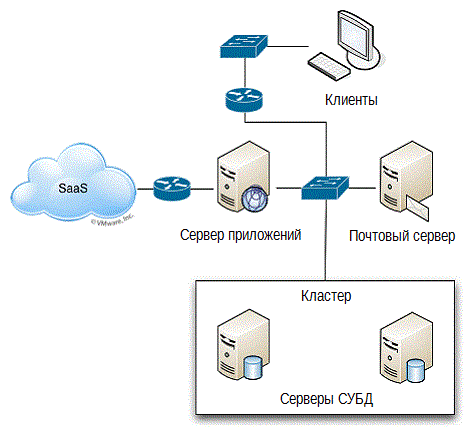
Figure 2.6: Detailed application diagram.
But even on this scheme, most likely, something is missing ( for example, an uninterruptible power supply management system - av. Re ). This is the reality, and perhaps it is one of the greatest dangers that exist in IT today: some parts of the environment that fall outside our ordinary understanding are missing from our attention.
And again, unified monitoring can be an advantage. Instead of focusing on only one technology part - for example, servers; it can be technologically independent and collect information from anywhere .
In fact, it is even better if the unified monitoring systems will be able to independently search for new components in your environment. Software does not need to be guided by the same assumptions and experience the same technological prejudices as a person. A unified console, in general, no matter who you are, Hyper-V specialist, or you prefer Cisco routers to other brands. It perceives reality as it is, searches for various components and creates an accurate and complete environment diagram. The system can then start monitoring these components (possibly requesting you logins and passwords to access each individual component, if necessary), and allows you to create comprehensive, unified indicator panels. I came across infrastructures where the lack of auto search feature sometimes became a problem:
Terry is responsible for the infrastructure components that make up the core business applications. Components are routers, switches, DBMS servers, virtualization servers, mail servers, and even outsourced as a SaaS sales management application. Terry had heard about the unified monitoring system, and his company even invested in a service that provides unified environmental monitoring. Terry has carefully configured each component, and all that was shown on the monitoring console in the form of indicators.
One day, one of the applications completely stopped working. Terry got to the monitoring console and saw several indicators showing 'alarm'. He quickly saw that the channel was not available until the application was in the cloud. Looking further into the state of the infrastructure indicators, he saw that the router through which this connection passed works fine and the state of the firewall is also normal. Terry was completely confused.
A few hours of manual work and cable tracking revealed something about the structure of the environment that Terry did not realize: on the other side of the firewall there was a faulty router. The connection to the Internet was fully operational, because it went through another channel, and the connection through which the connection to the business application did not work. This “extra” router was an old, inherited device that everyone had long forgotten about.
A monitoring solution that has an autodiscovery function would not “forget” anything. It would be able to find this extra router and add it to the indicator panel, which, no doubt, would allow Terry to isolate the problem much faster.
Autodiscovery can also help identify components that are outside of our technology domains and generally do not belong to anything. Infrastructure components such as routers and switches are the most commonly used examples of “orphaned” elements, because not every organization has a dedicated specialist who supports these devices. However, there are still legacy applications and servers, specialized equipment and other components that are easy to see if they are not in anyone's area of responsibility. Autodiscovery avoids such omissions.
Not everything in IT is a problem: orders, routing and provision of services.
Most organizations tend to have a habit of seeing the IT department as a “fire brigade”, because from their point of view, IT exists to solve problems. Of course, this is not the case, and each organization may be much more dependent on IT in carrying out its daily tasks and requires from the IT service not only emergency problem solving. But routine work is not so striking, while “extinguishing fires” attracts everyone's attention.
As a result of this attitude, IT management tries, first of all, to use tools that make it easier to eliminate the consequences of serious incidents. Unified monitoring systems fit well here. On the other hand, if so far nothing has happened, then we don’t need them. They are needed in order to quickly solve problems, just in the area of health and availability. Right?
Not really. A truly unified management also entails facilitating daily tasks for all participants in IT processes.
Users, for example, need to order and receive routine daily services, ranging from simply resetting a password and unlocking a user account to requests for new hardware and software.
I bet that someone will consider this a bold statement and say that these routine requests should be handled in exactly the same way as problems. Look at any IT framework, such as ITIL, and see how it runs through it: Routine IT procedures should be part of a unified management process that also includes problem solving.
Consider some of the broad functional capabilities that unified management (as opposed to just “monitoring”) can offer for work related to solving problems and performing routine IT services:
- Workflow sequence — when problems arise, they must be directed to a structured process or sequence of work. This will help make problem solving more efficient with the obligatory walk through a chain of mandatory steps. Work sequences will be different for solving problems and various routine services, but having the ability to manage and monitor workflows can be a real benefit.
- Reconcile. Workflows must include approvals. This feature is most obvious to routine services such as requests to change software and hardware, requests to perform security procedures, and so on, and this can be just as important as solving problems. ; , , , .
- . , , , . , – - , , «». , . : , . .
- . -. , . , , . , -.
- . « » , .
, , . , , .
…
, , , , .
, , , . .
: . . , – , , , , . , «», .
1
3
Source: https://habr.com/ru/post/173815/
All Articles