6 practical tips for beginners in building a simple BI solution
This article would like to show the steps and offer some recommendations in the process of creating a BI solution using virtually the entire Microsoft BI stack. In the creation of BI-solutions will be used SQL Server, SQL Service Integration Services, SQL Server Analysis Services.
For example, we chose the development of our company RetailIQ - a BI-system for in-depth analysis of checks for retail sales, supplies and inventory for a network of pharmacies. For a general understanding of the context of the topic: all data is uploaded from the accounting systems (1C, M-Pharmacy, etc.), verified, stored in a special database with the subsequent construction of multidimensional OLAP-cubes. From sources (accounting systems) with the help of ETL, we transfer data to the storage, on the basis of which we build a cube, which will be discussed further.
The construction of the data mart is the most important step, since the correctness of the displayed data and the processing time of the SSAS cube depend on the data mart.
')
At this step, it is decided which data to display (balances, sales, etc.) and in what sections (for example, product, date, employee, branch).
Data sources from which data can be obtained (files, web services, other databases) are determined. What transformations need to be made in the received data to maintain integrity.
A data showcase is also being prepared - a relational database into which data from disparate sources will be merged. To build a data mart, you can use two data storage schemes: a star schema and a snowflake . This article has a description of both schemes. Which scheme to apply in a particular case depends largely on the data. However, we usually use the snowflake scheme, since, in our opinion, this allows us to simplify data manipulations.
Sources for the OLAP-cube, in our opinion, are best done in the form of representations, rather than being tied directly to the table. This will make any changes to the source without changing the OLAP cube itself. Also, in our opinion, it is best not to make a request in the Data Source View itself, since changes in the DSAS of the SSAS project are problematic.
ETL is the process of transferring and transforming data according to certain business rules. For this step we have a number of recommendations.
“No data” (NA) elements are added to the dimension tables. They will serve as binding to the data that does not have a binding in the fact tables in the sources. For example, if we have sales for a product that cannot be determined, we will add it with its key NA. If a dimension has a binding to other tables, then in those tables you also need to define NA elements and set the binding to these records in the NA element of the measurement.
For example, suppose we have a Car table that has bindings to the CarType and CarMark tables. We do something like this:
We recommend generating a surrogate key, even if there is a primary key in the source. It is better to record the primary key of the source in a separate cell of the dimension table with the name “Native Key”. What we get:
If the CarID and EmployeeID cell values in the fact source contain NULL, or the data that are missing in our measurements, then use the following transformation:
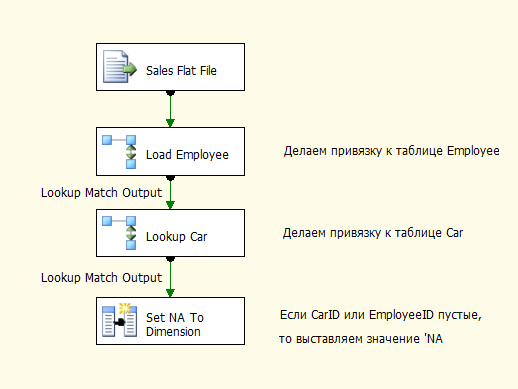
In both Lookups, the “Specify how to handle rows with no matching entries” field is set to “Ignore failure”. Thus, the unknown keys will be NULL. In the “Set NA To Dimension” element, NULL is replaced with the NA value for each measurement.
When the package is completed, we create the following XLS file, which will serve as documentation for our ETL package.

From this table, you can easily determine from where and where data “flow”.
The cube is the end point of our work. To create it, we also have some tips in store.
Date and time must be spread to different measurements.
Typically, OLAP cubes created using SSAS do not work well with dimensions that contain a large number of records. In our opinion, it is best to avoid cases where the date and time are in the same dimension. Suppose we want to create a Date-Time dimension that will have an accuracy of a second. Records in this measurement for 10 years will be: 10 years * 365 days * 24 hours * 60min * 60 seconds = 315 360 000 ≈ 315 million records.
Accuracy up to a second in analytical databases is usually not required, since the tasks of the cube are different compared to the operational bases, but if you still need to add time to the cube, then it is better to do it in a separate measurement.
Suppose we have the task of building a hierarchy: Car type-> Car make-> Car name from the table of the form:
CarID in this case will be the key to the measurement, and CarTypeID and CarMarkID will be the measurement attributes. We assume that after processing the cube we get the following:
But, unfortunately, it will not be so easy, the Mercedes group will belong to either Sport or Microcar (it depends on which line will be processed in the first place). This limitation can be circumvented using the composite key for an attribute. Make a key for the CarMark attribute of the CarTypeID + '_' + CarMarkID type. As a result, at the entrance to the cube we get approximately the following table:
As a result, we obtain the hierarchy necessary for us.
We would also recommend that for each dimension attribute, as far as possible, determine the name and key from separate sources.
We gave only the simplest recommendations when building an OLAP cube, which can add flexibility and extensibility to your BI solutions. We hope the tips will be useful to you and make the work of creating analytical solutions easier!
Sources
Basic information about cubes can be found in the article habrahabr.ru/post/66356 .
The Data Warehouse ETL Toolkit: Practical Techniques for Extracting, Cleaning, Conforming, and Delivering Data
Expert Cube Development with Microsoft SQL Server 2008 Analysis Services
www.sql.ru - :)

For example, we chose the development of our company RetailIQ - a BI-system for in-depth analysis of checks for retail sales, supplies and inventory for a network of pharmacies. For a general understanding of the context of the topic: all data is uploaded from the accounting systems (1C, M-Pharmacy, etc.), verified, stored in a special database with the subsequent construction of multidimensional OLAP-cubes. From sources (accounting systems) with the help of ETL, we transfer data to the storage, on the basis of which we build a cube, which will be discussed further.
Building a data mart
The construction of the data mart is the most important step, since the correctness of the displayed data and the processing time of the SSAS cube depend on the data mart.
')
At this step, it is decided which data to display (balances, sales, etc.) and in what sections (for example, product, date, employee, branch).
Data sources from which data can be obtained (files, web services, other databases) are determined. What transformations need to be made in the received data to maintain integrity.
A data showcase is also being prepared - a relational database into which data from disparate sources will be merged. To build a data mart, you can use two data storage schemes: a star schema and a snowflake . This article has a description of both schemes. Which scheme to apply in a particular case depends largely on the data. However, we usually use the snowflake scheme, since, in our opinion, this allows us to simplify data manipulations.
Tip # 1 Sources for a cube should be views.
Sources for the OLAP-cube, in our opinion, are best done in the form of representations, rather than being tied directly to the table. This will make any changes to the source without changing the OLAP cube itself. Also, in our opinion, it is best not to make a request in the Data Source View itself, since changes in the DSAS of the SSAS project are problematic.
Create ETL
ETL is the process of transferring and transforming data according to certain business rules. For this step we have a number of recommendations.
Tip # 2 Lines NA
“No data” (NA) elements are added to the dimension tables. They will serve as binding to the data that does not have a binding in the fact tables in the sources. For example, if we have sales for a product that cannot be determined, we will add it with its key NA. If a dimension has a binding to other tables, then in those tables you also need to define NA elements and set the binding to these records in the NA element of the measurement.
For example, suppose we have a Car table that has bindings to the CarType and CarMark tables. We do something like this:
INSERT INTO CarType (ID, Name) VALUES (0, 'NA') INSERT INTO CarMark (ID, Name) VALUES (0, 'NA') INSERT INTO Car (ID, Name, CarTypeID, CarMarkID) VALUES(0, 'NA', 0, 0) Tip # 3 Surrogate Keys
We recommend generating a surrogate key, even if there is a primary key in the source. It is better to record the primary key of the source in a separate cell of the dimension table with the name “Native Key”. What we get:
- we can determine the NA element
- primary keys from different sources may match
- we have the freedom to choose the format of the primary key in our database (for example, we can use Guid, even if the sources use INT).
Tip # 4 Setting NA values in an ETL package
If the CarID and EmployeeID cell values in the fact source contain NULL, or the data that are missing in our measurements, then use the following transformation:
In both Lookups, the “Specify how to handle rows with no matching entries” field is set to “Ignore failure”. Thus, the unknown keys will be NULL. In the “Set NA To Dimension” element, NULL is replaced with the NA value for each measurement.
Tip # 5 Documenting ETL
When the package is completed, we create the following XLS file, which will serve as documentation for our ETL package.
From this table, you can easily determine from where and where data “flow”.
Create a cube
The cube is the end point of our work. To create it, we also have some tips in store.
Date and time must be spread to different measurements.
Typically, OLAP cubes created using SSAS do not work well with dimensions that contain a large number of records. In our opinion, it is best to avoid cases where the date and time are in the same dimension. Suppose we want to create a Date-Time dimension that will have an accuracy of a second. Records in this measurement for 10 years will be: 10 years * 365 days * 24 hours * 60min * 60 seconds = 315 360 000 ≈ 315 million records.
Accuracy up to a second in analytical databases is usually not required, since the tasks of the cube are different compared to the operational bases, but if you still need to add time to the cube, then it is better to do it in a separate measurement.
Tip # 6 Creating hierarchies with the same elements.
Suppose we have the task of building a hierarchy: Car type-> Car make-> Car name from the table of the form:
| Carid | Name | CarTypeID | Cartype | Carmarkid | Carmark |
| one | Mercedes-Benz F 800 Style | one | Sport | one | Mercedes |
| 2 | Smart | 2 | Microcar | one | Mercedes |
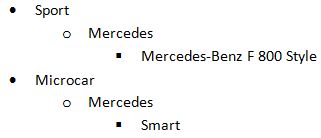
CarID in this case will be the key to the measurement, and CarTypeID and CarMarkID will be the measurement attributes. We assume that after processing the cube we get the following:
But, unfortunately, it will not be so easy, the Mercedes group will belong to either Sport or Microcar (it depends on which line will be processed in the first place). This limitation can be circumvented using the composite key for an attribute. Make a key for the CarMark attribute of the CarTypeID + '_' + CarMarkID type. As a result, at the entrance to the cube we get approximately the following table:
| Carid | Name | CarTypeID | Cartype | Carmarkid | Carmark |
| one | Mercedes-Benz F 800 Style | one | Sport | 1_1 | Mercedes |
| 2 | Mercedes-Benz F 800 Style | 2 | Microcar | 1_2 | Mercedes |
As a result, we obtain the hierarchy necessary for us.
We would also recommend that for each dimension attribute, as far as possible, determine the name and key from separate sources.
We gave only the simplest recommendations when building an OLAP cube, which can add flexibility and extensibility to your BI solutions. We hope the tips will be useful to you and make the work of creating analytical solutions easier!
Sources
Basic information about cubes can be found in the article habrahabr.ru/post/66356 .
The Data Warehouse ETL Toolkit: Practical Techniques for Extracting, Cleaning, Conforming, and Delivering Data
Expert Cube Development with Microsoft SQL Server 2008 Analysis Services
www.sql.ru - :)
Source: https://habr.com/ru/post/173711/
All Articles