Space Retreat from Flurry
It would seem that common to one of the largest analytical sites for developers of mobile applications and space? The answer to this question lies in the translation of this article from Flurry. The author of the text is Mary Ellen Gordon, Ph.D. and simply an extremely intelligent person. Thoughts and hypotheses presented in the original text seem to us very reasonable, and besides they are confirmed by our personal experience.

Mobile application developers need their own metrics to get an idea of how their application looks compared to others.
To understand which metrics to use for this, Flurry conducted a study based on data on the return of the audience and its size. In addition, the relationship between these indicators and the degree of their influence on each other was evaluated. For example, do applications with a larger user base have a large retension? Do applications with a small audience get retention more because they focus on a narrower segment?
The study involved applications (which use the Flurry tracker) with an audience of 1000 or more active users (MAU) as of early November 2012. Applications that are in test mode or are no longer supported were excluded from the sample. Then, based on the MAU data, the applications were divided into 3 groups of the same size.
')
The first group included applications with the number of active users> = 32,000, the second> = 8,000, and the third, respectively, the rest (0 <x <8000).
The same approach was used in retension grouping. For the purposes of this analysis, retenshen should be understood as the percentage of people who, after the first launch of the application, launched it again within the next 30 days. In order to get into the first group, the retension index in the application should have been at least 37%. For the second group, the retenshene threshold was determined at 22%.
After that, these two main metrics (active users and retension) correlated with each other. What came of this can be seen in the comparative table-illustration.

If we assume that active users and retenshen are two completely independent characteristics, then each of the 9 categories would have to contain approximately 11% of applications.
As can be seen from the table, the categories that are in the middle just fall under this pattern, but the categories that are on the edges of the table behave quite differently. Thus, with the current distribution of applications between the categories, statistically significant deviations from the expected 11% are observed, which allows to conclude that the hypothesis about the independence of these metrics from each other is incorrect.
15% of applications are in a very favorable position; they belong to the first group both in the number of active users and in their return. Such applications fall into the category of “Superstar” applications, since they are successful in both dimensions. Such applications generate revenue regardless of the selected monetization model.
The other 17% are in a diametrically opposite situation: they have very few active users, and a rather low retention. Such applications belong to the “Black Hole” group, and as a rule, these are new applications, which so far have only begun to build up their user base, either old dying applications, or simply poorly made applications (and there are also such).
Perhaps the most interesting applications are those that were in the lower right and in the upper left sector of the table. 6% below were called “Red Dwarf” - a small user base is compensated by a very impressive retension. Such applications have a great chance to develop into something more.
The opposite 6% called “Shooting Stars” turned out to be applications with a large number of users, but with a small rethension, which ultimately will lead to the rapid extinction of the application itself.
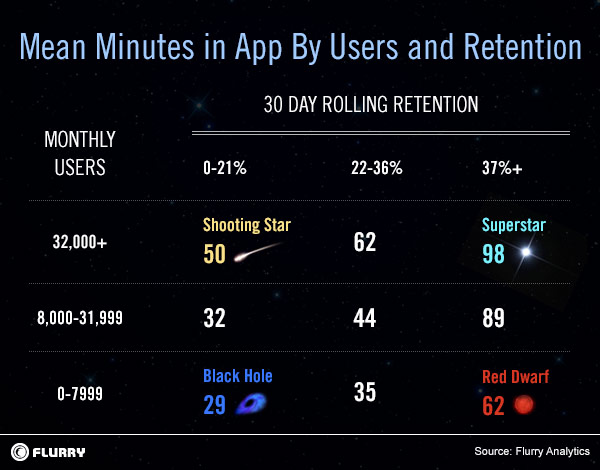
It is obvious that the average amount of time spent in the application is greater for applications with a higher retension. For example, in Superstars applications, the user spends twice as long as in Shooting Stars applications (98 vs. 50 minutes, respectively). Such a relationship between concepts (time spent in the application and retenshena) can be considered statistically significant.
The number of users also has a relationship with the time they spend in the application. This is easy to understand if you look at each column from top to bottom. For example, users spend almost 50% more time in Superstar applications than in Red Dwarf app. However, retention affects the time spent in the application more than the number of active users.
From this study, we can draw the main conclusion: one of the most important indicators that developers need to pay attention to is the return of users. Moreover, developers always have ways to influence retension, changing and complementing applications and ways of user interaction with it.
And more importantly, it is the retenshene that generates the revenue of the application, this is proved by the direct relationship between the retenshen and the time spent in the application.
More frequent use of the application increases the likelihood of in-apps and increases the effectiveness of advertising. Simply put, the better the application is done, the better it returns users, which in turn reduces the cost of developing this application. Aggressive traffic purchases before an application demonstrates high retention can be a very costly mistake.
At the same time, an application with a high return of users has every chance of spreading through word of mouth, which is one of the most effective, and most importantly, free promotion channels. The more a developer spends time and effort on increasing retenshen, the more likely that their Red Dwarf will eventually turn into a Superstar.
Mobile application developers need their own metrics to get an idea of how their application looks compared to others.
To understand which metrics to use for this, Flurry conducted a study based on data on the return of the audience and its size. In addition, the relationship between these indicators and the degree of their influence on each other was evaluated. For example, do applications with a larger user base have a large retension? Do applications with a small audience get retention more because they focus on a narrower segment?
The study involved applications (which use the Flurry tracker) with an audience of 1000 or more active users (MAU) as of early November 2012. Applications that are in test mode or are no longer supported were excluded from the sample. Then, based on the MAU data, the applications were divided into 3 groups of the same size.
')
The first group included applications with the number of active users> = 32,000, the second> = 8,000, and the third, respectively, the rest (0 <x <8000).
The same approach was used in retension grouping. For the purposes of this analysis, retenshen should be understood as the percentage of people who, after the first launch of the application, launched it again within the next 30 days. In order to get into the first group, the retension index in the application should have been at least 37%. For the second group, the retenshene threshold was determined at 22%.
After that, these two main metrics (active users and retension) correlated with each other. What came of this can be seen in the comparative table-illustration.
If we assume that active users and retenshen are two completely independent characteristics, then each of the 9 categories would have to contain approximately 11% of applications.
As can be seen from the table, the categories that are in the middle just fall under this pattern, but the categories that are on the edges of the table behave quite differently. Thus, with the current distribution of applications between the categories, statistically significant deviations from the expected 11% are observed, which allows to conclude that the hypothesis about the independence of these metrics from each other is incorrect.
15% of applications are in a very favorable position; they belong to the first group both in the number of active users and in their return. Such applications fall into the category of “Superstar” applications, since they are successful in both dimensions. Such applications generate revenue regardless of the selected monetization model.
The other 17% are in a diametrically opposite situation: they have very few active users, and a rather low retention. Such applications belong to the “Black Hole” group, and as a rule, these are new applications, which so far have only begun to build up their user base, either old dying applications, or simply poorly made applications (and there are also such).
Perhaps the most interesting applications are those that were in the lower right and in the upper left sector of the table. 6% below were called “Red Dwarf” - a small user base is compensated by a very impressive retension. Such applications have a great chance to develop into something more.
The opposite 6% called “Shooting Stars” turned out to be applications with a large number of users, but with a small rethension, which ultimately will lead to the rapid extinction of the application itself.
It is obvious that the average amount of time spent in the application is greater for applications with a higher retension. For example, in Superstars applications, the user spends twice as long as in Shooting Stars applications (98 vs. 50 minutes, respectively). Such a relationship between concepts (time spent in the application and retenshena) can be considered statistically significant.
The number of users also has a relationship with the time they spend in the application. This is easy to understand if you look at each column from top to bottom. For example, users spend almost 50% more time in Superstar applications than in Red Dwarf app. However, retention affects the time spent in the application more than the number of active users.
From this study, we can draw the main conclusion: one of the most important indicators that developers need to pay attention to is the return of users. Moreover, developers always have ways to influence retension, changing and complementing applications and ways of user interaction with it.
And more importantly, it is the retenshene that generates the revenue of the application, this is proved by the direct relationship between the retenshen and the time spent in the application.
More frequent use of the application increases the likelihood of in-apps and increases the effectiveness of advertising. Simply put, the better the application is done, the better it returns users, which in turn reduces the cost of developing this application. Aggressive traffic purchases before an application demonstrates high retention can be a very costly mistake.
At the same time, an application with a high return of users has every chance of spreading through word of mouth, which is one of the most effective, and most importantly, free promotion channels. The more a developer spends time and effort on increasing retenshen, the more likely that their Red Dwarf will eventually turn into a Superstar.
Source: https://habr.com/ru/post/173567/
All Articles