Does every kernel really have its “own” cache of the first and second levels?
Modern Core i7 processors have an obvious, documented, but for some reason not very well-known, even among many specialists, scenario priority inversion. I will describe it in this post. It has C code, three diagrams, and some details of how caches work in Core i7 processors. No cover is not broken, all information has long been publicly available.
Priority inversion is a situation where a low priority process can block or slow down a high priority. Usually we mean the sequence of access to execution on the core for a high-priority code with respect to a low-priority one. The core of the OS should do quite well with this. However, in addition to computational cores, which are easy to distribute through affinity and MSI-X, there are resources in the processor that are common to all tasks - a memory controller, QPI, a shared third-level cache, and a PCIe device. I will not go into PCIe issues, since I am not an expert in this topic. Priority inversion on the basis of memory access and QPI I have not seen for a long time - the bandwidth of a modern multi-channel controller is usually enough for both high-priority and low-priority tasks. I will stop on caches.
Consider a diagram with caches in the processors of the Core i7 architecture of the third generation. However, it does not even matter which generation.
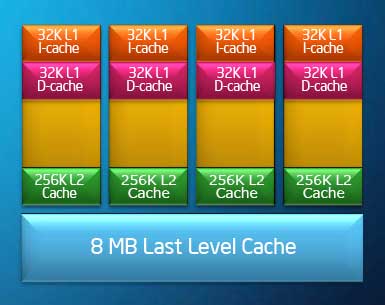
At this rather high level of abstraction, the difference between Nehalem, Westmere, Sandy Bridge, Ivy Bridge and Haswell is not noticeable. By the way, the most detailed description of how everything is arranged inside Sandy Bridge can be found in the article by Hennessey (yes, that one).
We see that the third-level cache (LLC), the largest, simultaneously serves all cores — both those that “mold” are low-priority processes, and those that receive external device interrupts or a local APIC timer, which should be process and produce results faster. Eviction policy cache last level - some approximation to the LRU . Consequently, the more and the more often a certain kernel uses the cache, the more LLC will get it. Priorities? What are the priorities ?? By the way, not very important tasks are very often not programmed as carefully as high-priority ones, and therefore require a lot of memory and cache. A high-priority task often waits for an external event, while its data and code are pushed out of the LLC. I have already written about this once, but in the comments to that post I incorrectly answered the question about the exclusivity of the L1 / L2 cache.
')
If you look at the diagram above, it seems that each kernel has its “own” cache, at least 256 kilobytes in size. More than enough for many realtime .text and .data tasks. Well, at least you can always count on the storage of 32kb data + 32kb code in the cache with a response time of several cycles? It is easy to check.
Disable hypertreaming and power management. I run the following microbenchmark:
Helper functions
The build_list initializes the list so that the prefetcher cannot find the regular access pattern. At the same time, the entire list is in the cache, in that level where it fits.
Now on kernel number 2, we run a list traversal, and measure how much time it takes on average for each iteration.
Linked list traversal speed measurements
The code of the flow measuring the passage time through lists of various sizes will be like this:
Measurements for different linked list sizes
Add a second thread, clogging the third level cache: let it spin on the core number 3, and copy 18MB of data back and forth. 18 MB - for sure to score LLC. Let it be synchronized with the first thread so that almost at any moment in time only one of them is actively working with the cache. (I am aware that the implementation of the spinlock is wrong and inefficient, and everything works only due to suitable timing.)
A thread that runs on another core and consumes LLC
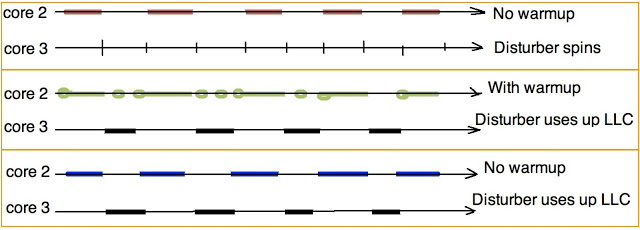
We will conduct three types of measurements:
For control, I also ran a test in which the data of the pest stream fit into its “own” L2. As expected, in this case there was no effect on the speed of traversing the list by the first thread. (The conflict missies could theoretically be seen, but I did not observe them)
Here are the measurement results:
Horizontal - the number of items in the list. Vertically - CPU cycles spent on traversing a single element. Interestingly, to get the “steps” (a graph that shows the boundaries of the caches) you only need to slightly change the benchmark, adding a bit of spatial locality.
For comparison, on the computer on which I drove this test, the access times to the elements of the memory hierarchy are as follows:
The time spent on one move through the list is proportional to
L1D_hit * P (L1D_hit) + L2_hit * P (L2_hit) + LLC_hit * P (LLC_hit) + DRAM_hit * P (DRAM_hit), where P is the probability of finding the next element of the list at a given cache level. Those.
P (L1D_hit) + P (L2_hit) + P (LLC_hit) + P (DRAM_hit) = 1
The specific probability distribution depends on the size of the list relative to the caches, and can be measured using Vtune, oprofile or Linux perf. For example, here is the measurement of probabilities with Vtune for a fixed list length of 16384 items (512 kilobytes).
Vtune confirms that the difference in performance between the "blue" and "green" options lies in the proportion of misses on the caches of different levels caused by the transition to the next item in the list. It can be seen that if the data of the high-priority flow were pushed out of the third-level cache, they are automatically invalidated in the first and second level caches of the corresponding core . However, the figures of the measured probabilities themselves were unexpected for me. There are no surprises in the “blue” column, and in the red one I expected more hits in L1, and in the “green” one - much more hits in L2. However, the latter partly explains the incomprehensible peak on the green graph in the region of 16k list elements.
If the first thread woke up via an interrupt, in the “blue” version even the IDT and the ISR code would have to be dragged out of memory for it, since it would have already been pushed out of L1I, L2, and LLC. To my great regret, modern processors of the Core i7 architecture do not have the ability to “lock” a part of LLC for exclusive use by a specific core. Therefore, the only way to avoid deleting important data from LLC, and, as a result, from L2 and L1, is to update them periodically, even if they are not needed at the moment.
In this post I don’t want to say at all that I have found some problem in the architecture of the Core i7. Such an organization of the work of the cache (more resources are received by the one who needs more) in the general case (desktop, most server loads) improves performance. The priority inversion case described above may occur in a narrow class of tasks, usually associated with real-time systems. Also, prefetcher usually should help. They do not cope with this test just because I located pointers at pseudo-random addresses.
Whew! It seems that I just wrote a large text, the essence of which could be posted in tweet: “When I download it, I’m not sure what I’m looking for. So warm up "
Priority inversion is a situation where a low priority process can block or slow down a high priority. Usually we mean the sequence of access to execution on the core for a high-priority code with respect to a low-priority one. The core of the OS should do quite well with this. However, in addition to computational cores, which are easy to distribute through affinity and MSI-X, there are resources in the processor that are common to all tasks - a memory controller, QPI, a shared third-level cache, and a PCIe device. I will not go into PCIe issues, since I am not an expert in this topic. Priority inversion on the basis of memory access and QPI I have not seen for a long time - the bandwidth of a modern multi-channel controller is usually enough for both high-priority and low-priority tasks. I will stop on caches.
Consider a diagram with caches in the processors of the Core i7 architecture of the third generation. However, it does not even matter which generation.
At this rather high level of abstraction, the difference between Nehalem, Westmere, Sandy Bridge, Ivy Bridge and Haswell is not noticeable. By the way, the most detailed description of how everything is arranged inside Sandy Bridge can be found in the article by Hennessey (yes, that one).
We see that the third-level cache (LLC), the largest, simultaneously serves all cores — both those that “mold” are low-priority processes, and those that receive external device interrupts or a local APIC timer, which should be process and produce results faster. Eviction policy cache last level - some approximation to the LRU . Consequently, the more and the more often a certain kernel uses the cache, the more LLC will get it. Priorities? What are the priorities ?? By the way, not very important tasks are very often not programmed as carefully as high-priority ones, and therefore require a lot of memory and cache. A high-priority task often waits for an external event, while its data and code are pushed out of the LLC. I have already written about this once, but in the comments to that post I incorrectly answered the question about the exclusivity of the L1 / L2 cache.
')
If you look at the diagram above, it seems that each kernel has its “own” cache, at least 256 kilobytes in size. More than enough for many realtime .text and .data tasks. Well, at least you can always count on the storage of 32kb data + 32kb code in the cache with a response time of several cycles? It is easy to check.
Disable hypertreaming and power management. I run the following microbenchmark:
Helper functions
#define POOL_SIZE_L1D_LINES 512 #define POOL_SIZE_L2_LINES 8192 // This can differ on your CPU. Check with CPUID or some system diagnostics tool #define POOL_SIZE_LLC_LINES 6*1024*1024/64 // Yes, I waste 3/4 of space for the sake of test simplicity // 1 cache line == 1 linked list item. // Pointer length is hard coded to 8 bytes (Intel 64) struct list_item { unsigned long long int tick; list_item *next; unsigned char padding[48]; }; // Build a linked list of size N with pseudo-random pattern void build_list(list_item *head, int N, int A, int B) { int C = B; list_item *current = head; for (int i = 0; i < N - 1; i++) { current->tick = 0; C = (A*C + B) % N; current->next = (list_item*)&(head[C]); current = current->next; } } // Touch first N elements in a linked list void warmup_list(list_item* current, int N) { bool write = (N > POOL_SIZE_L2_LINES) ? true : false; for(int i = 0; i < N - 1; i++) { current = current->next; //No write is needed to keep a line in L1,but looks like it is needed to keep it in L2! if (write) current->tick++; // FIXME AK: to check on HSW } } The build_list initializes the list so that the prefetcher cannot find the regular access pattern. At the same time, the entire list is in the cache, in that level where it fits.
Now on kernel number 2, we run a list traversal, and measure how much time it takes on average for each iteration.
Linked list traversal speed measurements
void measure(list_item* head, int N) { unsigned __int64 i1, i2, avg = 0; for (int j = 0; j < 50; j++) { list_item* current = head; #if WARMUP_ON while(in_copy) warmup_list(head, N); #else while(in_copy) spin_sleep(1); #endif i1 = __rdtsc(); for(int i = 0; i < N; i++) { current->tick++; current = current->next; } i2 = __rdtsc(); avg += (i2-i1)/50; in_copy = true; } printf("%i\n", avg/N); } The code of the flow measuring the passage time through lists of various sizes will be like this:
Measurements for different linked list sizes
// We initialize the linked list only once, and make it big enough to make sure // we do not observe effects of spatial locality but only effects of temporal locality // Magic numbers 509, 509 <= Hull-Dobell Theorem criteria build_list(head, POOL_SIZE_LLC_LINES*2, 509, 509); for (int i = 10; i < POOL_SIZE_L1D_LINES; i+=5) { warmup(head, i); measure(head, i); }; for (int i = POOL_SIZE_L1D_LINES; i < POOL_SIZE_L2_LINES; i+=50) { warmup(head, i); measure(head, i); }; for (int i = POOL_SIZE_L2_LINES; i < POOL_SIZE_LLC_LINES*2; i+=1000) { warmup(head, i); measure(head, i); }; Add a second thread, clogging the third level cache: let it spin on the core number 3, and copy 18MB of data back and forth. 18 MB - for sure to score LLC. Let it be synchronized with the first thread so that almost at any moment in time only one of them is actively working with the cache. (I am aware that the implementation of the spinlock is wrong and inefficient, and everything works only due to suitable timing.)
A thread that runs on another core and consumes LLC
list_item *area1 = (list_item *)malloc(POOL_SIZE_LLC_LINES*64*2); list_item *area2 = (list_item *)malloc(POOL_SIZE_LLC_LINES*64*2); while (true) { while(!in_copy) spin_sleep(1); #if DISRUPT_ON memcpy(area1, area2, POOL_SIZE_LLC_LINES*64*3); memcpy(area2, area1, POOL_SIZE_LLC_LINES*64*3); #else spin_sleep(10); #endif in_copy = false; }; We will conduct three types of measurements:
- Baseline, the "red" test, shows the speed of traversing the list in favorable conditions - the second thread does not use the cache.
- The bad option, the “blue” test, shows what happens if the second stream has time to pick up the entire LLC volume, while the first stream is hanging in the spinlock.
- Finally, the “green” test shows what happens if the first stream, while waiting, periodically reads its data.
For control, I also ran a test in which the data of the pest stream fit into its “own” L2. As expected, in this case there was no effect on the speed of traversing the list by the first thread. (The conflict missies could theoretically be seen, but I did not observe them)
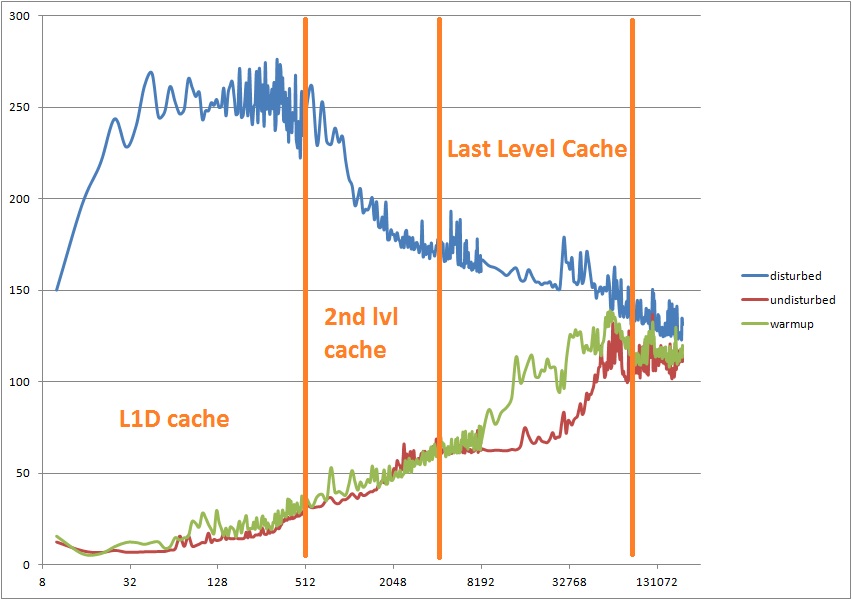
Here are the measurement results:
Horizontal - the number of items in the list. Vertically - CPU cycles spent on traversing a single element. Interestingly, to get the “steps” (a graph that shows the boundaries of the caches) you only need to slightly change the benchmark, adding a bit of spatial locality.
For comparison, on the computer on which I drove this test, the access times to the elements of the memory hierarchy are as follows:
- L1D hit = 4 cycles
- L2 hit = 11 cycles
- LLC hit = 31 cycle
- DRAM hit = ~ 100 cycles
The time spent on one move through the list is proportional to
L1D_hit * P (L1D_hit) + L2_hit * P (L2_hit) + LLC_hit * P (LLC_hit) + DRAM_hit * P (DRAM_hit), where P is the probability of finding the next element of the list at a given cache level. Those.
P (L1D_hit) + P (L2_hit) + P (LLC_hit) + P (DRAM_hit) = 1
The specific probability distribution depends on the size of the list relative to the caches, and can be measured using Vtune, oprofile or Linux perf. For example, here is the measurement of probabilities with Vtune for a fixed list length of 16384 items (512 kilobytes).
| undisturbed | disturbed | warmup | |
| L1 hit% | 0.08 | 0 | 63 |
| L2 hit% | 72 | 0.07 | 0.1 |
| LLC hit% | 25 | 2.6 | 22 |
| DRAM hit% | 3 | 97 | 15 |
| DTLB miss% | 21 | 66 | 37 |
If the first thread woke up via an interrupt, in the “blue” version even the IDT and the ISR code would have to be dragged out of memory for it, since it would have already been pushed out of L1I, L2, and LLC. To my great regret, modern processors of the Core i7 architecture do not have the ability to “lock” a part of LLC for exclusive use by a specific core. Therefore, the only way to avoid deleting important data from LLC, and, as a result, from L2 and L1, is to update them periodically, even if they are not needed at the moment.
In this post I don’t want to say at all that I have found some problem in the architecture of the Core i7. Such an organization of the work of the cache (more resources are received by the one who needs more) in the general case (desktop, most server loads) improves performance. The priority inversion case described above may occur in a narrow class of tasks, usually associated with real-time systems. Also, prefetcher usually should help. They do not cope with this test just because I located pointers at pseudo-random addresses.
Whew! It seems that I just wrote a large text, the essence of which could be posted in tweet: “When I download it, I’m not sure what I’m looking for. So warm up "
Source: https://habr.com/ru/post/173001/
All Articles