Tom's Planner Review
The coolest tools are universal, with their help you can solve a variety of tasks. Examples of such tools are Google documents and spreadsheets, mindmeister mental maps, and Realtimeboard . You can adapt them for anything, especially tables. To invent and make such a tool the most difficult. I will talk about another universal tool that we actively use - Tom's Planner .
I'll start with the background. We were looking for a tool to build Gantt charts for our projects. This problem arose because we were desperate to find a project management system that incorporates a good and convenient Gant. We used Redmine, and in it, as in most plugins for it, Gantt charts are implemented in such a way that it is rather difficult to use them every day.
In addition, we gradually came to the conclusion that the distribution of tasks in the project management system and planning are essentially different tasks. Attempts to combine them greatly complicate the work. We decided to have a separate tool for planning and forecasting.
')
After reviewing a number of systems for constructing Gantt charts, we realized that they are complex. We needed a simple visual planning tool, and a flexible, very flexible one. Tom's Planner came into view.

After a simple registration, you get a free and sufficient account to work. You can quickly and easily create stages, drag them, drag the beginning and end of the stage. Each stage can be called and described, you can assign a color. The man, who for the first time in his life learned that Gant exists, immediately begins to create diagrams without any training.

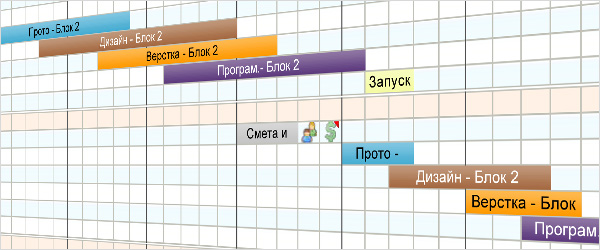
The ability to assign different colors to the stages is a unique feature of the service. This makes the diagrams surprisingly readable - if, of course, everyone adheres to a common legend:

But that's not all! You can insert symbols into any part of the diagram to indicate any events in the project. It is very convenient.

All elements can be named, each element can be commented. Such flexible possibilities of including information in a diagram turn it into a convenient storage of the most important data about a project.

The tool is very flexible. We have each employee, despite the previously created legend, yet began to use additional features that are important to him. Let's see how it looks.
Project manager Lena likes to mark all the events in the project on the diagram.

Light costs a minimum of tools.

Pavel either HAS a lot of payments this month, or he got confused with badges.

When does the free service end? When you need to export a chart to the outside, share with colleagues or publish. Yes, all these features are also available and work fine. For corporate use, a single paid account is sufficient, to which free ones are connected. It is more convenient if each member has an extended account, since the tariffs are loyal .
Our project managers adjust the charts once a week, noting payments, deadlines and exit points from the project. Once a week we collect individual charts in a general Review. On it we analyze the download and determine how to proceed. It turns out like this:

It looks difficult, but knowing that brown is the design stages, you can easily determine how many projects are at this stage and when the unloading will occur. Everything is clear and simple.
And here is an example of diagrams that our sales for commercial offers do in order to explain to the client the stages of work, show the dates of meetings and argue the need for paralleling some stages. Charts can be exported to PDF or Excell and included in commercial offers.

The simplicity and versatility of the tool gives rise to some drawbacks. In Tom's Planner there is no possibility to link the stages, respectively, the shift of the stages does not cause the displacement of the next. The system does not have such an entity as a task, although, if desired, they can be imitated by available means. Only Gant, nothing but him ...
In general, we recommend: http://www.tomsplanner.com
Source: https://habr.com/ru/post/170367/
All Articles