Pattern Processing Optimization
In practice, we had to deal with some not obvious features of the performance of template processing. The study of the issue gave rise to a small study, the results of which I hasten to share.
Currently I am developing a fairly large project on Django. The project is large, I am actually developing it alone, respectively, the issue of optimization arises only when it is completely gone. General technical information on the project:
Project size: about 70k lines
Django: 1.4.3
Environment: apache2 + mod_wsgi + virtualenv, python2.6, mysql, dedicated server. The project on the server is not the only one.
I am a fan of the invention of bicycles; according to this decorator, I collected the execution time, the module name, the name of the function, the user and the key parameter from the presentation and saved everything in the database.
The result - the average execution time of one of the main ideas was 1200ms, which is extremely sad.
')
The first thing that comes to mind is of course the ineffective work with the database. A sufficiently large amount of work was carried out, which reduced the number of queries to the database in half, their complexity (and the execution time) was still doubled. It was supposed that this would correct the situation, but the result was not at all impressive. The execution time dropped “only” to 100ms and amounted to 1,100ms, which did not make the weather. Stock optimization database still remained, but there are many other ways, but it became clear that the problem is clearly not in working with the database. More detailed profiling of the presentation function showed that about 80-90% of the time a line that you get used to not notice is executed:
As a template engine in the project, hamlpy is used, which in itself is not fast. The templates themselves are quite complex - they include double inheritance, several include, cycles, quite a lot of logic associated with the display. However, 950ms for rendering is too much.
Updating hamlpy to the latest version won about 50ms more. Rendering a template still takes an average of 900ms.
A more detailed study of the issue allowed us to learn that django can cache templates, and this should be configured separately:
The processing time of the template has fallen markedly, to 500-600ms, but still remains significant. At the same time, an unpleasant effect appeared - changes in patterns, which is logical, ceased to cling on the fly. So under DEBUG it is better to refuse caching.
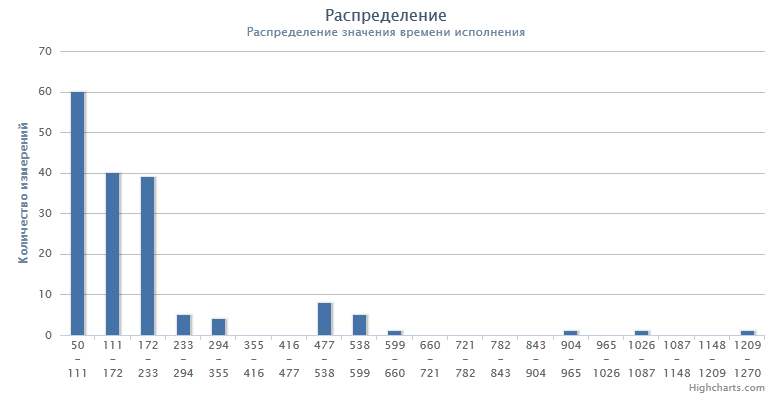
Looking in more detail at these statistics, I noticed that the results are heterogeneous. If I had a distribution graph, then probably there would be not one Gaussian curve, but two. Curiosity overcame laziness, and graphics were fastened to the statistics. Going back a bit, this is how the distribution of template processing time looks like without caching:

There is no clearly defined curve on the graph, since the statistics are collected from one representation without specification. The output HTML code of this view depends on a large number of different parameters, and the processing of its template takes different times. The peaks in the graph are presumably the result of overlapping curves from several key factors. Probably, if we take the samples not only by the presentation, but also by its parameters, then we would get the classical curves. But this is somewhat beyond the scope of the study.
Returning to caching, its distribution schedule looks like this:

Indeed, it has two peaks. The nature of the peak on the left is clear - this is the result of caching. But the peak on the right obviously arises from the lack thereof. Apache regularly kills streams of execution to protect against memory leaks. How often he does it is unknown to me, but judging by the schedule, he kills them after every third request, which makes caching not too effective.
Go to the Apache host configuration and do the following:
This translates the life cycle of threads from running Apache to mod_wsgi and sets the lifetime of the thread to 5 requests. We get the following schedule:

As you can see, the peak on the right has become smaller. Streams began to die less often, caching efficiency increased, the average execution time fell. The path is clearly correct, but a well-running caching schedule should obviously look different. We increase the lifetime to 10 queries:

Already not bad. The execution time has fallen noticeably to an acceptable value of 230ms. The best is the enemy of the good, and the longevity of the stream is not nonsense. The study of memory consumption through top did not reveal any tangible problems, so we increase the life expectancy to 15:
Such a graph looks plausible - not cached requests are no longer statistically significant, which means a further increase in the life of threads will not give a tangible result. The total execution time reached is 190ms. The time of the performance of the performance fell from 900 to 290ms, which is much better.
When optimizing the application code, you should also pay attention not only to the presentation itself, but also to the template processing. A key factor in the struggle for processing speed may be the life of threads executing your application. In my case, the optimal life time of threads was 15 requests, but most likely for different projects it could be a different number that needs to be selected, looking at the memory consumption.
Prehistory
Currently I am developing a fairly large project on Django. The project is large, I am actually developing it alone, respectively, the issue of optimization arises only when it is completely gone. General technical information on the project:
Project size: about 70k lines
Django: 1.4.3
Environment: apache2 + mod_wsgi + virtualenv, python2.6, mysql, dedicated server. The project on the server is not the only one.
Problem evaluation
I am a fan of the invention of bicycles; according to this decorator, I collected the execution time, the module name, the name of the function, the user and the key parameter from the presentation and saved everything in the database.
The result - the average execution time of one of the main ideas was 1200ms, which is extremely sad.
')
Database Optimization
The first thing that comes to mind is of course the ineffective work with the database. A sufficiently large amount of work was carried out, which reduced the number of queries to the database in half, their complexity (and the execution time) was still doubled. It was supposed that this would correct the situation, but the result was not at all impressive. The execution time dropped “only” to 100ms and amounted to 1,100ms, which did not make the weather. Stock optimization database still remained, but there are many other ways, but it became clear that the problem is clearly not in working with the database. More detailed profiling of the presentation function showed that about 80-90% of the time a line that you get used to not notice is executed:
return direct_to_template(request, template_name, locals()) As a template engine in the project, hamlpy is used, which in itself is not fast. The templates themselves are quite complex - they include double inheritance, several include, cycles, quite a lot of logic associated with the display. However, 950ms for rendering is too much.
Updating hamlpy to the latest version won about 50ms more. Rendering a template still takes an average of 900ms.
A more detailed study of the issue allowed us to learn that django can cache templates, and this should be configured separately:
TEMPLATE_LOADERS = ( ('django.template.loaders.cached.Loader', ( 'hamlpy.template.loaders.HamlPyFilesystemLoader', 'hamlpy.template.loaders.HamlPyAppDirectoriesLoader', 'django.template.loaders.filesystem.Loader', 'django.template.loaders.app_directories.Loader', )), ) The processing time of the template has fallen markedly, to 500-600ms, but still remains significant. At the same time, an unpleasant effect appeared - changes in patterns, which is logical, ceased to cling on the fly. So under DEBUG it is better to refuse caching.
Looking in more detail at these statistics, I noticed that the results are heterogeneous. If I had a distribution graph, then probably there would be not one Gaussian curve, but two. Curiosity overcame laziness, and graphics were fastened to the statistics. Going back a bit, this is how the distribution of template processing time looks like without caching:
There is no clearly defined curve on the graph, since the statistics are collected from one representation without specification. The output HTML code of this view depends on a large number of different parameters, and the processing of its template takes different times. The peaks in the graph are presumably the result of overlapping curves from several key factors. Probably, if we take the samples not only by the presentation, but also by its parameters, then we would get the classical curves. But this is somewhat beyond the scope of the study.
Returning to caching, its distribution schedule looks like this:
Indeed, it has two peaks. The nature of the peak on the left is clear - this is the result of caching. But the peak on the right obviously arises from the lack thereof. Apache regularly kills streams of execution to protect against memory leaks. How often he does it is unknown to me, but judging by the schedule, he kills them after every third request, which makes caching not too effective.
Go to the Apache host configuration and do the following:
WSGIDaemonProcess mysite threads=5 maximum-requests=5
This translates the life cycle of threads from running Apache to mod_wsgi and sets the lifetime of the thread to 5 requests. We get the following schedule:
As you can see, the peak on the right has become smaller. Streams began to die less often, caching efficiency increased, the average execution time fell. The path is clearly correct, but a well-running caching schedule should obviously look different. We increase the lifetime to 10 queries:
Already not bad. The execution time has fallen noticeably to an acceptable value of 230ms. The best is the enemy of the good, and the longevity of the stream is not nonsense. The study of memory consumption through top did not reveal any tangible problems, so we increase the life expectancy to 15:
Such a graph looks plausible - not cached requests are no longer statistically significant, which means a further increase in the life of threads will not give a tangible result. The total execution time reached is 190ms. The time of the performance of the performance fell from 900 to 290ms, which is much better.
findings
When optimizing the application code, you should also pay attention not only to the presentation itself, but also to the template processing. A key factor in the struggle for processing speed may be the life of threads executing your application. In my case, the optimal life time of threads was 15 requests, but most likely for different projects it could be a different number that needs to be selected, looking at the memory consumption.
Source: https://habr.com/ru/post/170297/
All Articles