How to use the Instruments utility in Xcode

At this point, your iOS development career is in the state where you wrote one application or two, and you are certainly wondering what you can do to make your applications even better.
In addition to improving your application by adding to it all kinds of "curlicues", there is one thing that all good developers have to do with their code - process it with the Instruments utility!
This guide will show you how to use the most important features of the tool called Instruments, which comes with Xcode. It will allow you to check your software code for performance problems, memory leaks and other problems.
You will learn:
- How to detect and fix memory management errors in your code using the Allocations and Leaks tools, and
- How to determine the problem place in the code using the time profiling tool, and
- How to make your code more efficient.
Note: This guide assumes that you are competent in Objective-C and iOS programming. If you are a complete beginner in iOS programming, you need to read other lessons from this site . The app on which we are training in this tutorial uses a storyboard, so make sure that you are familiar with this concept; if not, start with this guide .
This tutorial uses Xcode 4.5, make sure your Xcode is updated to the latest version that is available in the Mac App Store.
')
All is ready? Get ready to plunge into the fascinating world of Instruments!
Getting started
In this guide, you will not need to go through the process of creating an application from scratch, we will give you a ready-made example of a project. Your task is to improve this application using Instruments and our recommendations, and then do the same with your own applications!
Download the project , unpack it and open it in Xcode.
Compile and run the application, in the application, enter some text in the search box, perform a search, then enter the search results, and you will see something like this:

Use the application, try its basic functions. As you understand, the meaning of the application - search and display photos from Flickr. At the top of the application there is a search string, where you write the query, perform the search, and the result string appears in the table.
This table row contains the search query and the number of results found in parentheses. If you click on a row, you will see another table with a small image and its name.
If you click on one of the lines with the image, you can already see a large image, full screen. At the same time, using the Rotate button, you can rotate the image.
So far so good! You can see that the application works as intended. And you are ready to upload it to the store. However, let's see what the Instruments utility says about this application.
Time to profile
Many developers start developing with a vague internal need to make an application that will be fast - and this is a worthy goal. Then they read about the so-called “premature optimization” and ask themselves how to avoid this terrible phenomenon, condemned by gray-bearded programmers. And in the worst case, novice developers forget about optimization in general!
Of course, you can exclude optimization from your application development process. This ten years ago, mobile devices were incredibly limited, even the use of floating-point numbers was forbidden, because it made the size of the code huge, and the calculations went at the speed of the glacier.
And now in your pocket is incredible power, which is already able to beat the best examples of desktop computers. But you will not always nod to the powerful hardware and processor speed, instead of removing the inefficient bits in your application.
What is "profiling"? Profiling is a dimension. The result of the profiling session allows you to determine which parts of the code are used most often, which in turn tells you which parts of the code you should try to improve.
You can spend a week fine-tuning an interesting algorithm, but if this code takes only 0.5% of the total execution time, no one will ever notice the difference, no matter how much you have improved it. If, instead, you optimized the cycle for which your program spends 90% of its time, and improved the cycle by only 10%, then most likely the updated program will receive five stars in reviews, because it will become much faster!
First optimization lesson: find the right places to optimize them!
Premature optimization, as you may have guessed, spends time optimizing code, which ultimately does not matter.
The first tool we’ll look at is Time Profiler. When profiling, you will often be confronted with a thread stack trace. For example, the trace window:

This screen displays the call stack of each thread. Each line, or frame, as it is also called, is a command executed by the program, and the topmost line (frame number 0) is the line in which the processor is currently executing code.
The time spent by each line is determined by how many times the profiler has stopped on this line while the processor has processed the code specified in this line.
For example, if you run 100 samples at intervals of 1 millisecond, and a specific line of code appears in the top line of a stack trace for 10 samples, you can conclude that approximately 10% of the total execution time, that is, 10 milliseconds, was spent on this code. This is a pretty rough approximation, but it works!
If it is not yet clear, we shall understand later, we will start using Instruments!
In the Xcode menu, select the item ProductProfile or press ⌘ I. So you will compile the application and launch Instruments. You will be greeted with a selection window that looks like this:
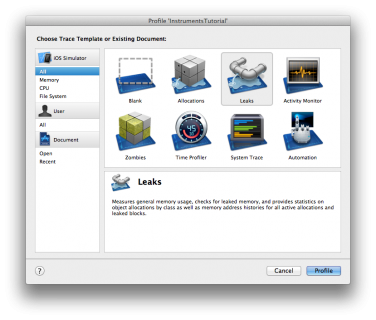
Here you can select the profiling template you want to use.
Select the Time Profiler template and click the Profile button. The iOS simulator and your application will start. The system will ask you to enter a password for Instruments utility access to other processes - do not be afraid, it is safe!
In the Instruments window, you can see the countdown, and how the little arrow moves from left to right above the graph in the center of the screen. This means that your application is running.
Now, we use our application as intended. Do a couple of searches, click on the search results. You may have noticed that entering the search results is tediously slow, and scrolling through the list of search results is also incredibly annoying - we have a terribly awkward app!
Well, you're lucky, because we're going to fix it all! However, for a start, let's take a quick look at Instruments.
First, make sure that all three selection items are pressed on the toolbar's View selector and it looks like this:

This means that all panels are visible. Now look at the screenshot below and the description of each section below it:

- This is the launch control buttons. The middle red button stops and starts the application, which is currently profiled. It actually stops and starts the application - and does not pause.
- This is a work timer and a navigator. The timer counts how long the application is running, which is profiled. Arrows can be moved between launches. If you stop and then start the application using the controls, you will start a new launch. The display will read “Run 2 of 2”, but you can return to the data of the first launch by stopping the current launch, and then pressing the left arrow.
- This is called a track. In the Time Profiler template that we have selected, there is only one instrument, and therefore, only one track. You will learn more about the features of track graphics later in this tutorial.
- This is a panel of additional details. In the Time Profiler template, it is used to display the stack trace.
- This is the details panel. This shows the basic information about the particular instrument you are using. In our case, it shows calls that can be called "hot" - that is, those that used the most CPU time.
If you click on the panel just above, which says: “Call Tree” (the “Call Tree” on the left) and select “Sample List”, then you will see a different type of data. This will be a list of samples. Click on a couple of samples, and you will see the stack trace caught by them in the additional details panel. - This is the options panel. You will learn about it soon.
And now rule the clumsy interface of our program!
Looking deep
Start the image search and enter the result. I personally like to look for the word “dog”, but you yourself choose what you want to look for - you can be one of those very people who adore kote!
Twist the result window up and down several times so that you have a good amount of data to profile. You will see that the numbers in the middle of the screen are changing and the graph is being filled; This means that CPU cycles are used.
You probably did not expect such a "braked" behavior of the user interface; The application with the list is not ready for the AppStore until the list scrolls like clockwork! To help pinpoint the problem, you need to change some of the time profiling options.
In the options panel (remember, # 6 in the picture), in the Call Tree section, tick off the Separate by Thread , Invert Call Tree , Hide System Libraries and Show Obj-C Only checkboxes. It will look like this:

This is what these options are for:
- Separate by Thread : Each thread must be considered separately. This allows you to understand which threads are responsible for the most CPU usage.
- Invert Call Tree : The stack trace will be displayed from top to bottom. This means that you will see in the report those lines of code that were in frame number 0 when the sample stopped. After all, as a rule, you want to see the most "heavy" lines of code for which the processor spends the most time.
- Hide Missing Symbols : If a dSYM file is not found for your application or system framework, then instead of procedure names, you will see only hexadecimal values. If this option is selected, they will be hidden, and only fully recognized calls will be shown. This will help to streamline the submitted data.
- Hide System Libraries : If this option is selected, then only calls to your own application will be displayed. This is a very useful option, as you are usually interested only in the processor costs of your code - you can not do anything with the processor costs of the system libraries!
- Show Obj-C Only : If this option is selected, then only Objective-C methods will be displayed, and not all C or C ++ functions. They are usually not in your program, well, unless you use OpenGL, for example.
- Flatten Recursion : This option allows you to display a recursive function (a function that calls itself) as one record in each stack trace, rather than as multiple records.
- Top Functions : If you tick the box, the Instrumens will consider the time spent by the function as the sum of the time immediately inside this function and the time spent in the sub-function caused by this function. That is, if function A caused function B, then the time spent by A would be equal to the time spent by function A PLUS time spent by function B. This can be very useful, as it allows you to immediately find the most time-consuming call.
Although some values may differ slightly, after setting the checkboxes I specified, the report should look like this:

Well, of course, we see the problem. The vast majority of time is spent on executing the setPhoto procedure : from the PhotoCell class, that is, on displaying a photo in a row of a table. This should not be news for you, you remember that the scrolling of the table was the slowest element of the program interface.
To find out what is happening inside this method, double-click on the line with its name. You will see this window:

Now that's interesting, isn't it! Almost three-quarters of the time spent setPhoto procedure: busy creating an imageData variable for a photo!
Now you can see what the problem is. The dataWithContentsOfURL method waits and does not return until the data has been loaded. And each request to the Internet to receive data can take up to several seconds. This method runs on the main thread, and therefore the entire user interface is blocked while images are being loaded.
To solve this problem, you need to use the call ImageCache , which allows you to asynchronously load images in the background thread. The code is already in the PhotoCell class.
You can switch to Xcode and find the file you want, but Instruments has a convenient “Open in Xcode” button. Find it on the panel just above the code and click:

Click! Xcode gives us the right place!
Now, comment out the two lines in which we populate the imageData variable and the image at the row of the table, and remove the comment in the code block below. Now the setPhoto method will look like this:
- (void)setPhoto:(FlickrPhoto *)photo { _photo = photo; self.textLabel.text = photo.title; // NSData *imageData = [NSData dataWithContentsOfURL:_photo.thumbnailUrl]; // self.imageView.image = [UIImage imageWithData:imageData]; [[ImageCache sharedInstance] downloadImageAtURL:_photo.thumbnailUrl completionHandler:^(UIImage *image) { self.imageView.image = image; [self setNeedsLayout]; }]; } Re-run application profiling using Instruments by clicking ProductProfile (or ⌘ I - remember that these hot keys really save you time).
Please note that this time you were not asked which Instruments pattern to use. This is because you still have our application window open, and Instruments assumes that you want to run it again with the same template.
Work again in the application, run a couple of searches. Note that this time the interface is not as clumsy as it was before! Images are now loaded asynchronously and cached in the background, so if they were loaded once, they are not loaded again.
Looks good! Is it time to send the program to the AppStore? Not yet!
Something with my memory has become
The next tool we consider is Allocations. He will give you detailed information about all the objects that were created and about the memory they occupied; it also shows the number of links to each object.
Let's start profiling our application with a new profile. Close the Instruments, go back to Xcode and select the ProductProfile menu item again. Then select the Allocations profile and click the Profile button.

The Instruments utility will open again, and you will see the following window:

This time you will see two tracks. One of them is called Allocations , the other is VM Tracker . We will take a closer look at the Allocations profile in this lesson; VM Tracker profile is also very useful, but it is more difficult, about him another time.
So what error are we going to look for?
She is in the project, but you do not know where. You've probably heard of memory leaks. But, most likely, you do not know that in reality there are two types of leaks.
One of them is a real memory leak when the object was not released, but no one needs it. Because of this, the occupied memory cannot be reused.
The second type of leak is a bit more complicated. It is called "unlimited growth of memory." It occurs when memory continues to stand out and is not given a chance to be released.
If this continues indefinitely, at some point the memory will be full, and you will encounter big problems with memory. In iOS, this means that the application will be killed by the system watchdog timer. So your application will not get five stars!
We develop a plan for how we can detect unlimited memory growth. First, perform in the application of pieces of 10 different searches (but do not enter the results yet). Make sure the search yielded some results! Now we will wait a few seconds without touching the application.
You will notice that the graph in the Allocations track is growing. This suggests that memory continues to be allocated. So you got an unlimited growth of memory.
We will do the so-called "snapshot analysis of the heap." To do this, click the button called “Mark Heap”. You will find it on the panel on the left side:

Click it and see a red flag appear in the track, like this:

The purpose of analyzing a heap snapshot is to perform some action several times, and see where memory grows indefinitely. Enter one of the search results and wait a few seconds for the images to load, and then return to the main page. Check one more box on the heap. Do this several times with different search results.
After 10 entries in all 10 results, the Instruments window will look like this:

Well, of course, there is nothing good here. But wait, but what about the message about the lack of memory? You know about them, right? The message about the lack of memory iOS says that the application has become cramped in memory, and you need to clear part of the memory occupied.
It is possible that your application is not guilty of anything, and this is something in the depths of UIKit memory consumption. Let's give the system frameworks and your application a chance to clear your memory before pointing your finger at the guilty one.
We simulate a message about low memory by selecting the Hardware \ Simulate Memory Warning option in the iOS simulator menu (in the Russian version, the Hardware \ Simulate a low memory warning). You will notice that memory has become less used, but, of course, not as little as before. That is, somewhere there is an unlimited growth of memory.
Let's take a look at the snapshots taken.
Hit me with your best shot
The first shot is the base one. Open it, you will see all the objects for which memory was allocated and which were not released at the time when the picture was taken. Subsequent snapshots will contain only changes in objects between the current and previous snapshots.
Look at the “Heap Growth” column, and you will see that, of course, growth is happening somewhere. Open one of the heap snapshots and you will see the following window:

Wow, how many objects! Where to begin?
It is best to look at the classes that you use in your application directly. In our case, the classes are HTTPHeaderDict, CGRegion, CGPath, CFNumber, etc. can be ignored.
But the UIImage class that we use in the application is interesting for us. Click the arrow to the left of the UIImage to expand the list of created UIImage objects. Select one of the specific UIImage objects from the list and look at the additional information panel (on the right):

This is a stack trace at the time this particular UIImage was created. The trace lines shown in gray are in the system libraries; lines in black font - in the application code. If you double-click on such a black line, we will get into the code of our application:
- (void)downloadImageAtURL:(NSURL*)url completionHandler:(ImageCacheDownloadCompletionHandler)completion { UIImage *cachedImage = [self imageForKey:[url absoluteString]]; if (cachedImage) { completion(cachedImage); } else { dispatch_async(dispatch_get_global_queue(DISPATCH_QUEUE_PRIORITY_DEFAULT, 0), ^{ NSData *data = [NSData dataWithContentsOfURL:url]; UIImage *image = [UIImage imageWithData:data]; [self setImage:image forKey:[url absoluteString]]; dispatch_async(dispatch_get_main_queue(), ^{ completion(image); }); }); } } The Instruments utility is very useful, but it can not do everything for you! Now you need to work independently to understand where the problem is with the memory.
Look at the method above and you will see that it calls a method called SetImage: forKey . This method caches the image so that it can be used again in the application later. Aha Maybe we found a problem!
Take a look at the implementation of this method:
- (void)setImage:(UIImage*)image forKey:(NSString*)key { [_cache setObject:image forKey:key]; } Here an image is added to the dictionary, as the object corresponding to the key is the URL of the image. But if you look at the code, you will notice that the image is never removed from this dictionary!
This is where our unlimited memory growth happens! Everything works as it should, but the application does not remove anything from the cache - it only adds!
To solve this problem, you need to enable the ImageCache class to hear the low-memory warnings that UIApplication receives. When ImageCache receives a warning, it will be a good boy and clear its cache.
To get ImageCache to receive warnings, change the initialization method to become like this:
- (id)init { if ((self = [super init])) { _cache = [NSMutableDictionary new]; [[NSNotificationCenter defaultCenter] addObserver:self selector:@selector(memoryWarning:) name:UIApplicationDidReceiveMemoryWarningNotification object:nil]; } return self; } So you register the receipt of UIApplicationDidReceiveMemoryWarningNotification messages in the memoryWarning method :. Now implement this method as shown below:
- (void)memoryWarning:(NSNotification*)note { [_cache removeAllObjects]; } The memoryWarning method will only delete all objects in the cache. This ensures that the images will not remain in memory, they will all be released.
To check this, run the Instruments utility again (in Xcode, press ⌘ I) and repeat the steps you did before. Do not forget to simulate the lack of memory at the end!
Note: Make sure you start the fixed application from Xcode, and not just press the red button in Instruments. This is the only way to start profiling the modified code.
This time, the heap snapshot analysis will look like this:

This time, memory usage plummeted after a low-memory message was received. Of course, a certain amount of memory is still used, but not as large as before.
The reason for some growth in the use of memory can be system libraries, and here we can not do anything. All you can do in your application is free up as much memory as possible, and you have already done it!
Well done! Another problem fixed! Well, now it’s time to download the app in the AppStore! Oh, wait - there is still a problem of the first type of memory leak, and we still have not solved it.
Call the plumber - you have a leak!
The next profile we look at is Leaks. It is used to find memory leaks of the first kind, as we said earlier - this is when the object is no longer referenced, and it takes up memory.
Leak detection seems to be very difficult, but the Leaks profile remembers all the objects for which memory was allocated and periodically scans each object to determine which may not be available from any other object.
Close Instruments, go back to Xcode and select the menu item ProductProfile . Select a Leaks profile and click the Profile button:

In the Instruments window there are 2 tracks - Allocations and Leaks. Track Allocations is the same as you used in the previous section.
We will only use the Leaks track in this section, so click on it to highlight it. Please note that the contents of the other Instruments windows have changed since then and now show information about the Leaks track.
In the information panel, at the bottom left, the Automatic Snapshotting flag is already on. This means that memory snapshots for detecting memory leaks will be taken automatically.
The interval between shots can be changed, but 10 seconds set by default is quite enough for our purposes. You can also take a picture at any time by clicking on the “Snapshot Now” button.
Work with the application! Run the search and enter the search results. Then click on one of the lines with the result to see the image in full screen. Press the Rotate button several times in the upper left corner.
Return to Instruments. If you have done all these steps correctly, you will notice a leak! The Instruments window will look like this:

Return to the iOS simulator and press the Rotate button a couple more times. Return to Instruments and wait. More leaks will appear, the window now looks something like this:

Where did these leak? If the additional information panel is not open for you, open it by pressing the button on the far right in the View selector:
Select the CGContext object from the list of objects with a detected memory leak. Look at the additional information panel, it shows the stack trace at the time the object is created. Tracing looks like this:

And again in the list of frames among the "gray" frames, calls to system frameworks, there is a "black" frame - a call to the code of our application. Double-click on it to see the code for this method.
This is the rotateTapped: method, which handles pressing the Rotate button. This method rotates the original image and creates a new image, the code is shown below:
- (void)rotateTapped:(id)sender { UIImage *currentImage = _imageView.image; CGImageRef currentCGImage = currentImage.CGImage; CGSize originalSize = currentImage.size; CGSize rotatedSize = CGSizeMake(originalSize.height, originalSize.width); CGContextRef context = CGBitmapContextCreate(NULL, rotatedSize.width, rotatedSize.height, CGImageGetBitsPerComponent(currentCGImage), CGImageGetBitsPerPixel(currentCGImage) * rotatedSize.width, CGImageGetColorSpace(currentCGImage), CGImageGetBitmapInfo(currentCGImage)); CGContextTranslateCTM(context, rotatedSize.width, 0.0f); CGContextRotateCTM(context, M_PI_2); CGContextDrawImage(context, (CGRect){.origin=CGPointZero, .size=originalSize}, currentCGImage); CGImageRef newCGImage = CGBitmapContextCreateImage(context); UIImage *newImage = [UIImage imageWithCGImage:newCGImage]; self.imageView.image = newImage; } And again, Instruments utility gives you a hint where the problem is, but what the problem is, she cannot tell you for sure. Instruments can only show you where the memory leak object was created. And your job is to solve the problem!
The person who wrote the code probably thought that ARC should have taken over all the memory management ... right?
Recall that ARC only works with Objective-C objects. It does not count references and free CoreFoundation objects that are not Objective-C objects.
And now it becomes obvious that the problem is that the CGContextRef and CGImageRef objects were not freed! To fix this, add the following two lines of code at the end of the rotateTapped method :
CGImageRelease(newCGImage); CGContextRelease(context); These two calls are necessary to balance the number of references to these two objects. The moral of this story is that you still have to remember about the counting of links to objects, even if you use ARC in your project!
Log in to Xcode, press ⌘I to profile the application in Instruments.
Run the application again using the Leaks profile and verify that the memory leak has been fixed. If you completed the steps described correctly, the leak should disappear!
Well done! Keep it up!
What's next?
Now use the knowledge gained to profile your own applications with the help of Instruments and see what is happening in them! Also, try making Instruments part of your software development work.
Instrument through your code as often as possible. Spread your application in the AppStore, only making sure that you have done everything possible to find problems with performance and memory management.
Now go and make effective applications!
Source: https://habr.com/ru/post/168491/
All Articles